0470
Calcification and iron deposition in basal ganglia structures: reversible and irreversible transverse relaxation rates at 7T1Department of Radiology, Boston Children's Hospital, Boston, MA, United States, 2Harvard Medical School, Boston, MA, United States, 3Athinoula A. Martinos Center for Biomedical Imaging, Department of Radiology, Massachusetts General Hospital, Charlestown, MA, United States, 4Harvard-MIT Division of Health Sciences and Technology, Massachusetts Institute of Technology, Cambridge, MA, United States
Synopsis
Gradient-Echo Sampling of the Spin Echo (GESSE) data were acquired at 7T in 16 volunteers (ages: 23-87 years). In globus pallidus and putamen, the reversible and irreversible transverse relaxation rates derived from this data varied with age in a manner largely consistent with prior postmortem studies of iron concentration. The exception to this was when calcifications appeared to be present, leading to outliers in the reversible (but not irreversible) relaxation rates. Our results suggest that consideration of both reversible and irreversible transverse relaxation rates may reveal valuable information about tissue microstructure and may complement measurements based primarily on phase contrast.
Purpose
Reversible and irreversible transverse relaxation rates, typically characterized by R2′=1/T2′ and R2=1/T2, respectively, are sensitive to field variations at different spatial scales[1]. The goal of this study was to investigate the hypothesis that calcification and iron deposition in basal ganglia structures lead to distinct patterns of the above transverse relaxation rates, implying different spatial scales for these substrates. This would provide an alternative approach to methods that are currently challenged by the presence of both paramagnetic (iron) and diamagnetic (calcium) substrates in these structures, e.g., methods based on phase contrast directly[2] or indirectly, such as susceptibility-weighted imaging (SWI)[3] and quantitative susceptibility mapping (QSM)[4]. It would also serve as an example of how reversible and irreversible transverse relaxation could provide insight into tissue microstructure.Methods
Sixteen healthy volunteers (9F/7M, ages: 23-87 years), having given informed consent, were scanned on a Siemens 7T whole-body scanner (Siemens Healthcare, Erlangen, Germany) using a custom-built 32-channel head receive coil and birdcage transmit coil. On each volunteer, 2D multiple-slice Gradient-Echo Sampling of the Spin Echo (GESSE) data[5], which enable the concurrent measurement of reversible and irreversible transverse relaxation rates, were acquired in ~4 minutes with the following parameters: TR=2 s, 15 unipolar gradient-echoes with the 8th gradient-echo coinciding with the spin-echo at TE=24 ms (BW=2441 Hz/px), 19 axial slices with 2/1 mm slice thickness/gap and 2×2 mm2 in-plane resolution (matrix=128×96). For two of the volunteers (V01 and V02), 0.5×0.5×0.5 mm3 ME-MPRAGE scans[6] with TE1/TE2/TI/TR = 2.05/4.01/1100/2530 ms were also available and were used to aid the identification of basal ganglia calcifications. Fits of Lorentzian and Gaussian models to per-voxel GESSE time-domain signals were performed[7], leading to the characterization of reversible transverse relaxation rates by R2′ and σ, respectively, with irreversible transverse relaxation rates characterized by R2. Regions of interest (ROIs) for globus pallidus and putamen were drawn on the GESSE spin-echo images, and the mean value of the relaxation rates within each ROI was computed.Results
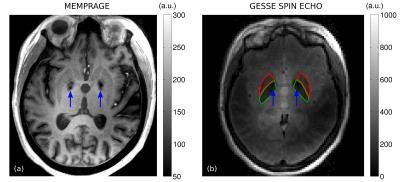
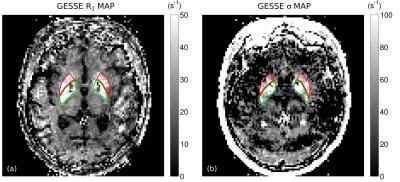
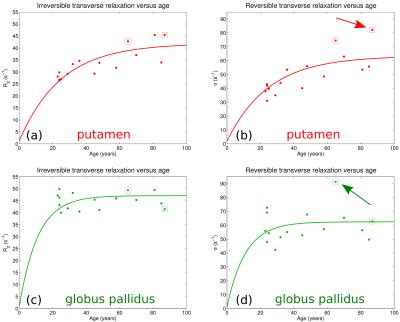
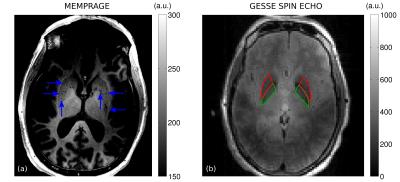
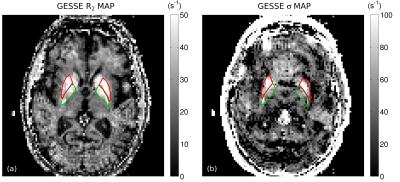
Fig. 1 shows a slice through globus pallidus and putamen from the ME-MPRAGE and GESSE spin-echo data for volunteer V01 (65 year-old female). Based on a reading of the ME-MPRAGE scan, a staff radiologist identified calcification in the globus pallidus (see hypointensities indicated by blue arrows). Fig. 2 shows R2 and σ maps for V01, revealing high rates of both irreversible and reversible relaxation in the globus pallidus and putamen. For all volunteers, the Gaussian model was found to fit GESSE time-domain signals as well as or better than the Lorentzian model and therefore reversible transverse relaxation rates are characterized herein by σ rather than R2′. Fig. 3 shows plots of subject age versus mean R2 and σ in globus pallidus and putamen, along with curves of the form y=a⋅(1−exp(−b⋅x))+c taken from the landmark Hallgren and Sourander[8] postmortem study of age (x) versus iron concentration (y) in various structures. We used their values of a, b and c for globus pallidus and putamen, but applied a vertical scaling factor to each curve to account for the difference in units—mg of iron per 100 g fresh weight versus s-1 for relaxation rates. Our R2 and σ plots are mostly consistent with Hallgren and Sourander’s finding that iron in globus pallidus accumulates rapidly at an early age and then levels off, whereas iron in putamen accumulates more gradually with age[9]. For volunteer V01, however, the value of σ presents as an extreme outlier in globus pallidus, i.e., in the structure in which calcification was identified. Another (less extreme) outlier can be seen in Fig. 3 in the σ value in putamen for volunteer V02 (87 year-old male). Based on this observation, we retrospectively examined this volunteer’s ME-MPRAGE scan: as shown in Fig. 4, hypointensities can be seen in the putamen (see blue arrows), suggestive of calcification in this structure. R2 and σ maps for V02 are shown in Fig. 5.Discussion
Irreversible transverse relaxation is sensitive to field variations smaller than the water diffusion length whereas reversible relaxation reflects inhomogeneities at a larger scale[1]. Our results—indicating that σ, but not R2, deviates from the Hallgren and Sourander curves when calcification is present—suggest that calcification in the basal ganglia primarily leads to field variations at a scale greater than the diffusion length whereas iron deposition leads to field variations at spatial scales both above and below the diffusion length. If so, measurements of reversible and irreversible transverse relaxation could complement studies of calcification based on phase contrast[2], SWI[3] or QSM[4], which struggle in iron-rich structures due to the presence of both paramagnetic and diamagnetic components.Acknowledgements
Supported by NIH NIBIB P41-EB015896 and R01-EB019437, and the Athinoula A. Martinos Center for Biomedical Imaging.References
[1] Fernández-Seara MA, Wehrli FW. Postprocessing technique to correct for background gradients in image-based R2* measurements. Magn Reson Med 2000;44:358-366.
[2] Yamada N, Imakita S, Sakuma T, Takamiya M. Intracranial calcification on gradient-echo phase image: depiction of diamagnetic susceptibility. Radiology 1996;198:171-178.
[3] Wu Z, Mittal S, Kish K, Yu Y, Hu J, Haacke EM. Identification of calcification with MRI using susceptibility-weighted imaging: a case study. J Magn Reson Imaging 2009;29:177-182.
[4] Chen W, Zhu W, Kovanlikaya I, Kovanlikaya A, Liu T, Wang S, Salustri C, Wang Y. Intracranial calcifications and hemorrhages: characterization with quantitative susceptibility mapping. Radiology 2014;270:496-505.
[5] Yablonskiy DA, Haacke EM. An MRI method for measuring T2 in the presence of static and RF magnetic field inhomogeneities. Magn Reson Med 1997;37:872-76.
[6] van der Kouwe AJW, Benner T, Salat DH, Fischl B. Brain morphometry with multiecho MPRAGE. NeuroImage 2008;40:559-569.
[7] Mulkern RV, Balasubramanian M, Mitsouras D. On the Lorentzian versus Gaussian character of time-domain spin-echo signals from the brain as sampled by means of gradient-echoes: Implications for quantitative transverse relaxation studies. Magn Reson Med 2015;74:51-62.
[8] Hallgren B, Sourander P. The effect of age on the non-haemin iron in the human brain. J Neurochem 1958;3:41-51.
[9] Balasubramanian M, Polimeni JR, Mulkern RV. Proc Intl Soc Mag Reson Med 2016;24:0505.
Figures
