0468
Frequency difference mapping as a marker of microstructural integrity of white matter in multiple sclerosis at 7T1University of California, Berkeley, CA, United States, 2Sir Peter Mansfield Imaging Centre, University of Nottingham, Nottingham, United Kingdom
Synopsis
Frequency difference maps derived from GRE phase data have been shown to generate orientation-dependent contrast in white matter tracts in the brain due to signal compartmentalization in myelinated nerve fibers. Here, we investigate the use of frequency difference mapping (FDM) as a marker of white matter integrity; comparing FDM with PSIR; T2*-weighted magnitude; and quantitative susceptibility mapping (QSM) images of focal white matter lesions in patients with multiple sclerosis. FDM shows clear contrast between these lesions and the surrounding white matter, suggesting that it has potential as a means of quantitatively identifying changes in white matter integrity in vivo.
Introduction
Frequency difference mapping (FDM) is an imaging technique based on the analysis of multi-echo, GRE MRI phase data which maps the variation of the apparent MR frequency with echo time1. In white matter, frequency difference effects are linked to signal compartmentalization in myelinated nerve fibers, where as a result of the local effects of the magnetic susceptibility of the myelin sheath, signal components with distinct frequencies originate from water confined to the axonal, myelin, and external water pools1,2. In particular, the myelin water pool experiences the largest frequency offset, whose magnitude depends on the fiber orientation to the B0-magnetic field, taking a positive value for fibers that are perpendicular to the field. As a result of the rapid T2*-decay of the myelin water signal, the frequency of the total signal changes with TE, producing a negative frequency difference for perpendicular fibers. Since compartmentalization and myelination are prerequisites for the generation of frequency differences, FDM has potential as a marker of the microstructural integrity of white matter. FDM has potential advantages over quantitative susceptibility mapping (QSM) in this situation since FDM data are only sensitive to changes in myelination, rather than to changes in both iron content and myelination3,4. Here, we use the example of focal white matter lesions in multiple sclerosis (MS) to investigate the sensitivity of FDM to myelin damage, demonstrating its potential as a means of assessment of white matter integrity in vivo.Methods
4 patients with MS were scanned at 7T using a Philips Achieva system equipped with a 32-channel receiver coil. Each patient was scanned 6 times at ~6 week intervals. FDM data were acquired using an 8-echo GRE sequence (TE1/∆TE/TE8 = 2.5/4/30.5 ms, TR = 38ms, BW = 350 Hz/pixel, voxel size = 1.2 mm3), and high resolution quantitative susceptibility mapping (QSM) data were acquired using a 5-echo GRE sequence (TE1/∆TE/TE5 =8/5/28 ms, TR = 50 ms, BW = 525 Hz/pixel, voxel size = 0.6 mm3). A high resolution (0.6 mm3) T1-wt. PSIR scan was acquired for anatomical segmentation. All data were acquired with ethical approval from the local institutional review board.
Frequency difference maps were generated from the FDM data using the protocol described in5 which involves complex division by the signal from the first echo to remove the effect of any RF-induced phase offsets, followed by calculation of the frequency difference by assessment of the phase accumulated during each TE-period. An average FDM data set was formed by summing the maps obtained over the last six echo times. QSM processing was carried out using Laplacian-based phase unwrapping6, background phase removal using V-SHARP7, and QSM inversion using a modified truncated dipole kernel as described in8. Data were co-registered to the T2*-wt. magnitude image from the QSM acquisition in visit 1 using FSL9. Hyperintense focal lesions were manually identified in the T2*-wt. magnitude data from echo 4 of the QSM acquisition and ROIs were drawn using ITK-snap10.
Results
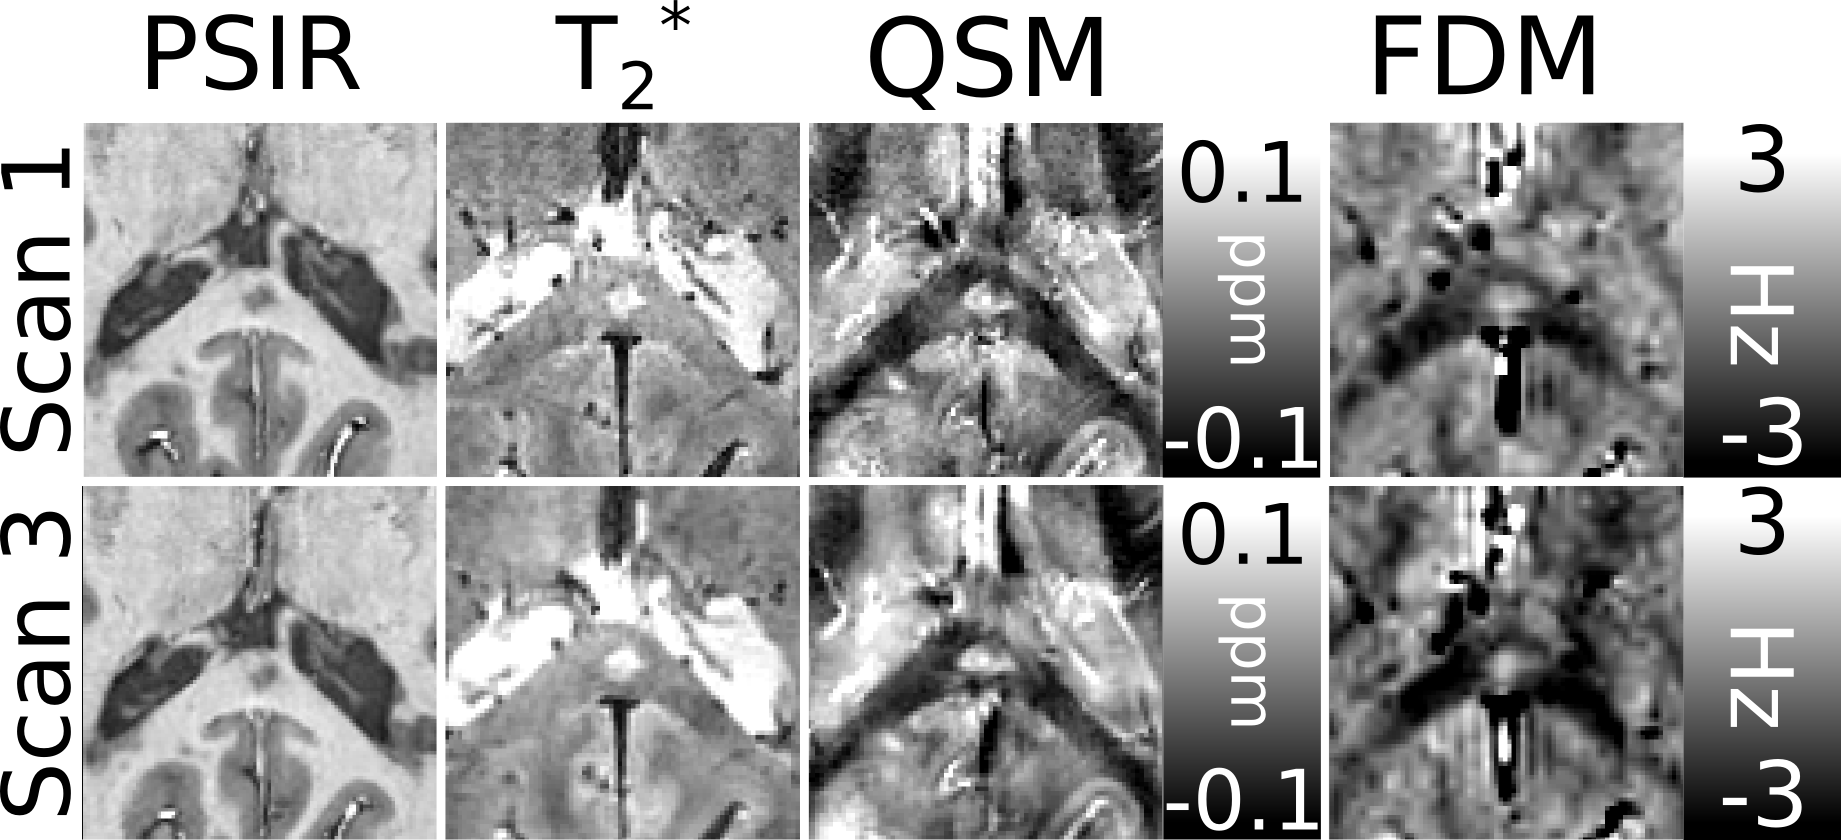
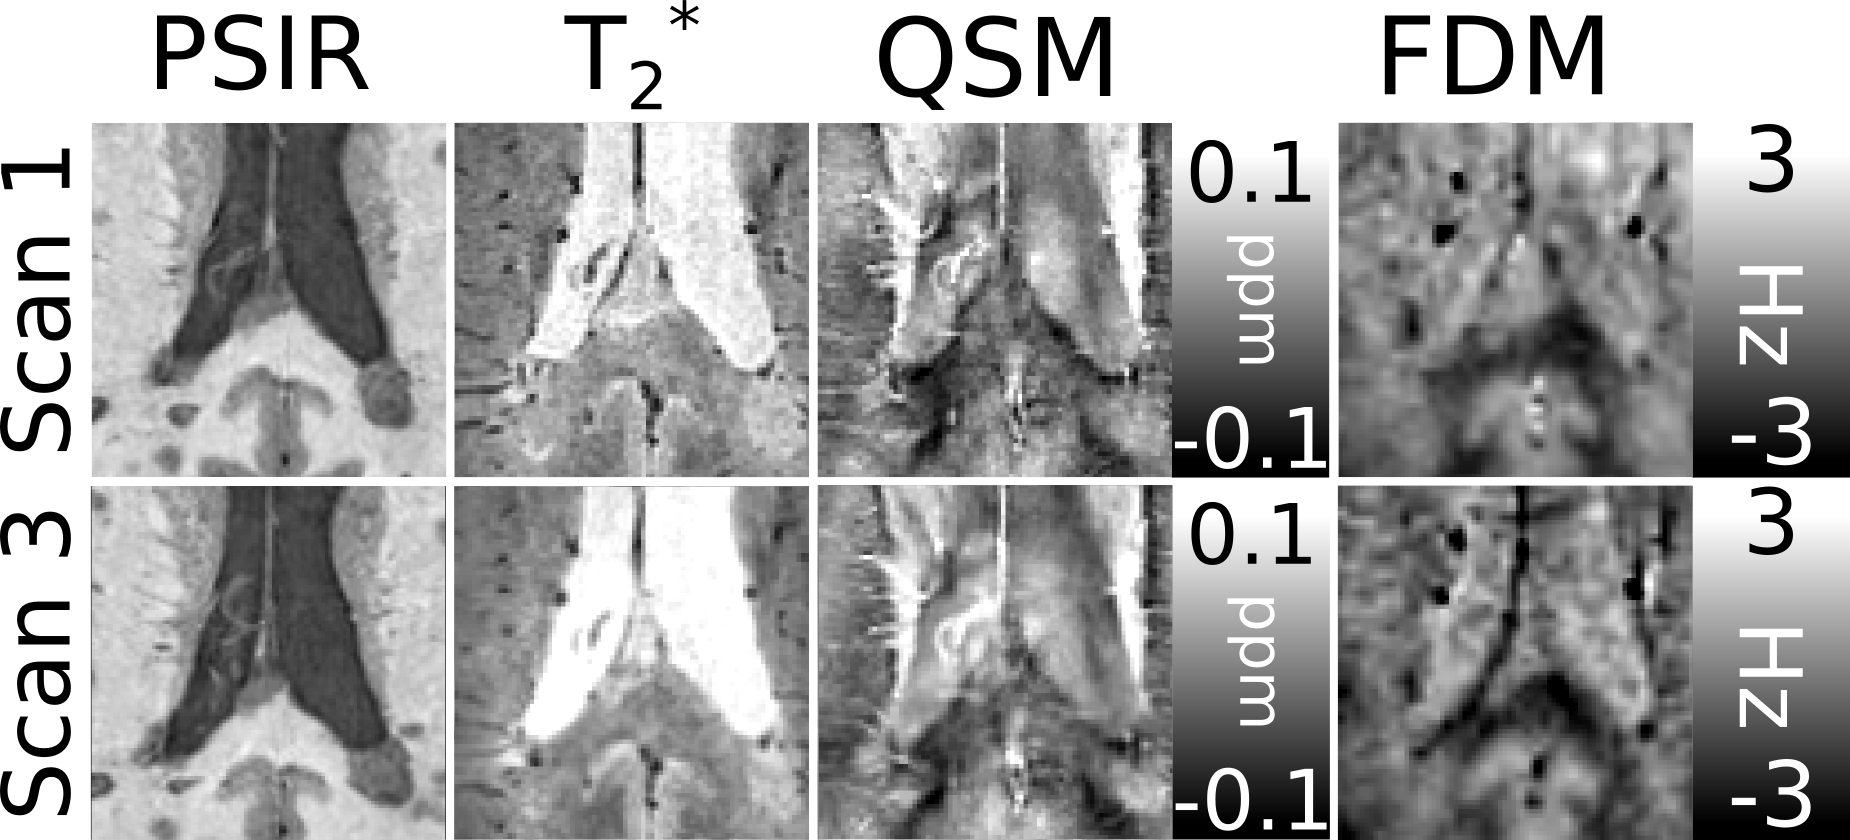
Figures 1 and 2 show examples of focal white matter lesions in the corpus callosum (CC) of one patient with MS. Both lesions appear hypointense in the T1-wt. PSIR, indicating increased fluid content relative to surrounding tissue; hyperintense in the T2*-wt. magnitude indicating reduced myelin or iron content. The lesion in Fig.1 shows strong hyperintense contrast in the QSM relative to surrounding white matter, suggestive of significant demyelination with likely iron deposition; while the lesion in Fig.2 shows only slight hyperintensity in the QSM, which may indicate that demyelination is the primary source of contrast. The FDM contrast in both lesions is hyperintense relative to the surrounding white matter, with values of ~0 Hz and ~-2 to -3 Hz respectively. This is indicative of linear phase evolution in the lesion, and a lack of compartmentalization of the MRI signal in contrast to the unaffected WM of the CC.Discussion
Frequency difference mapping has been shown to be sensitive to the structure and orientation of myelinated nerve fibers in the brain, with this effect being strongest in fibers running parallel to the B01, and so any change in FDM contrast due to demyelination would be strongest in fiber tracts such as the CC running perpendicular to B0. Our results here are consistent with this, showing clear contrast between demyelinating MS lesions and surrounding white matter in the CC; suggesting that FDM has potential as a means of quantitatively identifying changes in white matter integrity in vivo.Acknowledgements
No acknowledgement found.References
1) Wharton, S. and Bowtell, R. Fiber orientation-dependent white matter contrast in gradient echo MRI. Proc Natl Acad Sci USA 2012; 109:18559-18564.
2) Sati, P., van Gelderen, P., Silva, A.C., Reich, D.S., Merkle, H., de Zwart, J.A., and Duyn, J.H. Micro-compartment specific T2* relaxation in the brain. Neuroimage 2013; 77:268-278.
3) Wisnieff, C., Ramanan S., Olesik J., Gauthier,.S. Wang, Y. Pitt, D. Quantitative Susceptibility Mapping (QSM) of White Matter Multiple Sclerosis Lesions: Interpreting Positive Susceptibility and the Presence of Iron. Magnetic Resonance in Medicine 2015, 74:564–570
4) Li, X, Harrison, D.M., Liu, H., Jones, C.K., Oh, J., Calabresi, P.A and van Zijl, P.M., Magnetic Susceptibility Contrast Variations in Multiple Sclerosis Lesions, Journal of Magnetic Resonance Imaging, 2016: 43:463-473.
5) Tendler, B., Wharton, S. and Bowtell, R. Frequency Difference Mapping for Measurement of White Matter Microstructure, Proceedings of the 23rd Annual Meeting of the ISMRM, 2015, p11.
6) Li, W., B. Wu, and C. Liu, Quantitative susceptibility mapping of human brain reflects spatial variation in tissue composition. NeuroImage, 2011. 55: p. 1645-56.
7) Schweser, F., et al., Quantitative imaging of intrinsic magnetic tissue properties using MRI signal phase: an approach to in vivo brain iron metabolism? NeuroImage, 2011. 54: p. 2789-807.
8) Schweser, F., et al., Toward online reconstruction of quantitative susceptibility maps: Superfast dipole inversion. Magnetic Resonance in Medicine, 2013. 69(6): p. 1581-1593.
9) M. Jenkinson, P.R. Bannister, J.M. Brady, and S.M. Smith. Improved optimisation for the robust and accurate linear registration and motion correction of brain images. NeuroImage, 17(2):825-841, 2002.
10) Paul A. Yushkevich, Joseph Piven, Heather Cody Hazlett, Rachel Gimpel Smith, Sean Ho, James C. Gee, and Guido Gerig. User-guided 3D active contour segmentation of anatomical structures: Significantly improved efficiency and reliability. Neuroimage 2006 Jul 1;31(3):1116-28.
Figures