0466
Microscopic susceptibility anisotropy mapping1Centre for Medical Image Computing, Department of Computer Science, University College London, London, United Kingdom, 2Institute of Imaging Science, Vanderbilt University, Nashville, TN, United States
Synopsis
The gradient-echo signal in brain white matter does not only depend on microscopic tissue features such as myelination, but also on the axon orientation distribution with respect to the external magnetic field. Therefore, to map microscopic susceptibility, we need to factor out the confounding effects of fibre crossings and orientation dispersion. This work adapts the Spherical Mean Technique (SMT), recently introduced in diffusion MRI, to estimate the microscopic susceptibility anisotropy in directionally heterogeneous tissue. Moreover, we show that, in combination with diffusion measurements, the proposed technique may be viable in the clinic.
Purpose
Fibre crossings and orientation dispersion are ubiquitous in the brain. It is well known that the directional tissue structure influences the magnitude and phase of the gradient-echo MR signal1–3. The aim here is to disentangle the two principal effects contributing to the macroscopic anisotropy seen in gradient-echo measurements, namely microscopic susceptibility anisotropy, which is mainly attributed to the myelin microstructure4–6, and the fibre orientation distribution.
Methods
Microscopic susceptibility anisotropy. The gradient-echo signal is produced by a large population of microdomains, i.e. (myelinated) axon segments in white matter, which may have a complex orientation distribution. In the following we assume that a single microdomain with orientation $$$\omega\in S^2$$$ gives rise to the microscopic frequency anisotropy
$$(1)\qquad\delta f(\mathbf{\hat B}_0, \omega) = f_A (1-\langle\mathbf{\hat B}_0, \omega\rangle^2).$$
$$$f_A$$$ quantifies the frequency shift when the axon is oriented perpendicular to the magnetic field direction $$$\mathbf{\hat B}_0\in S^2$$$7–9. The microscopic gradient-echo signal then takes the form
$$(2)\qquad h(\mathbf{\hat B}_0, \omega; t) = \exp\left(i\,\left(2\pi [f_0+\delta f(\mathbf{\hat B}_0, \omega)] t+\phi_0\right)-\frac{t}{T_2^*}\right),$$
where $$$t$$$ is the echo time, $$$i$$$ the imaginary unit, $$$f_0$$$ the orientation-independent frequency shift, $$$\phi_0$$$ a phase offset and $$$T_2^*$$$ the orientation-independent relaxation time.
Spherical Mean Technique. The axon orientation distribution $$$p(\omega)$$$ is antipodally symmetric, non-negative and normalised with one. The spherical convolution with the microscopic signal (2) yields the macroscopic gradient-echo signal
$$(3)\qquad\frac{E(\mathbf{\hat B}_0, t)}{E_0\exp(i (2\pi f_0 t+\phi_0)-t/T_2^*)} = e(\mathbf{\hat B}_0, t) = \int_{S^2} \exp(2\pi i f_A [1-\langle \mathbf{\hat B}_0, \omega\rangle^2] t) p(\omega) \, d\omega$$
measured on the voxel scale, where $$$E_0$$$ denotes the proton density. The key insight of the Spherical Mean Technique (SMT)10,11 is that the average $$$\bar e(t)$$$ over the magnetic field directions, with the other sequence parameters fixed, does not depend on the orientation distribution and hence is only a function of the microscopic gradient-echo signal
$$(4)\qquad\bar e(t) = \frac{(1-i)\exp(2\pi i f_A t) \mathrm{erf}\left((1+i)\sqrt{\pi}\sqrt{f_A t}\right)}{4\sqrt{f_A t}}.$$
We may either estimate the microscopic frequency anisotropy $$$f_A$$$ without knowledge of the fibre orientation distribution using Equation (4), which requires a dense sampling of the magnetic field directions. Alternatively, with the orientation distribution recovered from diffusion MRI10,11, $$$f_A$$$ can be estimated using Equation (3), which then requires only few magnetic field directions.
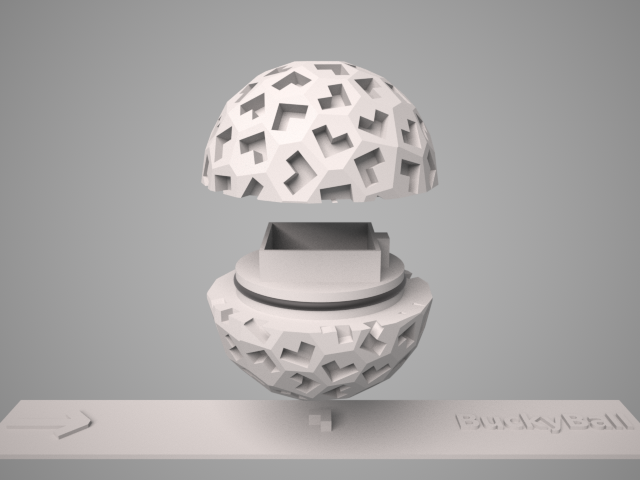
Materials and Experiment. We conducted an ex-vivo study with a brain sample from a female adult owl monkey, which was perfusion fixed and placed in PFA with 10% sucrose until washing with PBS before scanning. The sample was measured in a bespoke BuckyBall holder (Figure 1) filled with Fomblin on a 15.2 T Bruker BioSpec scanner. A 3D gradient-echo experiment with 16 echoes (flip angle 45°, TE1 = 1.837 ms, ESP = 3 ms, TR = 100 ms) was performed at 50 uniformly distributed orientations with respect to the external magnetic field. In addition, we ran a 3D diffusion FSE scan with 60 unique gradient directions evenly distributed over two b-shells of 3000 and 6000 s/mm² as well as a 3D CPMG sequence with 40 echoes (TE1 = 4.5 ms, TR = 3000 ms, 4 averages). The image resolution of all scans was 250 μm isotropic.
Results
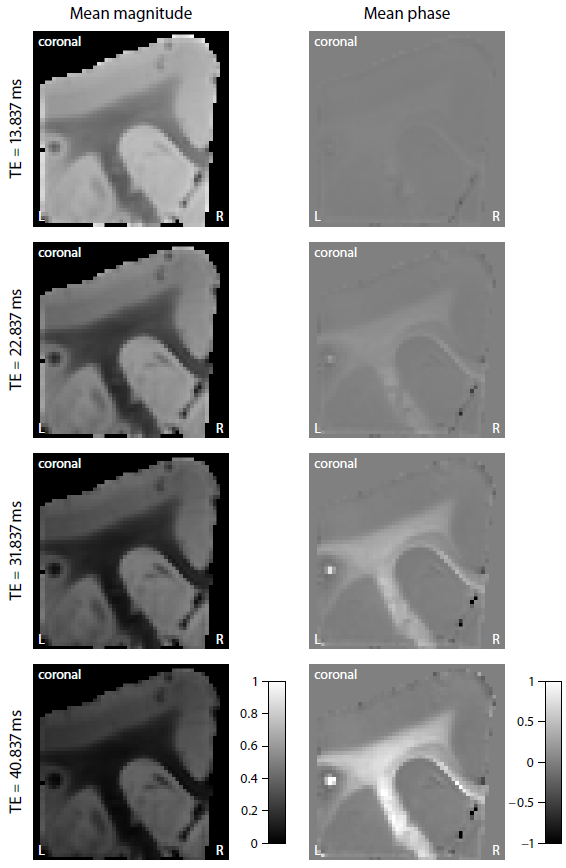
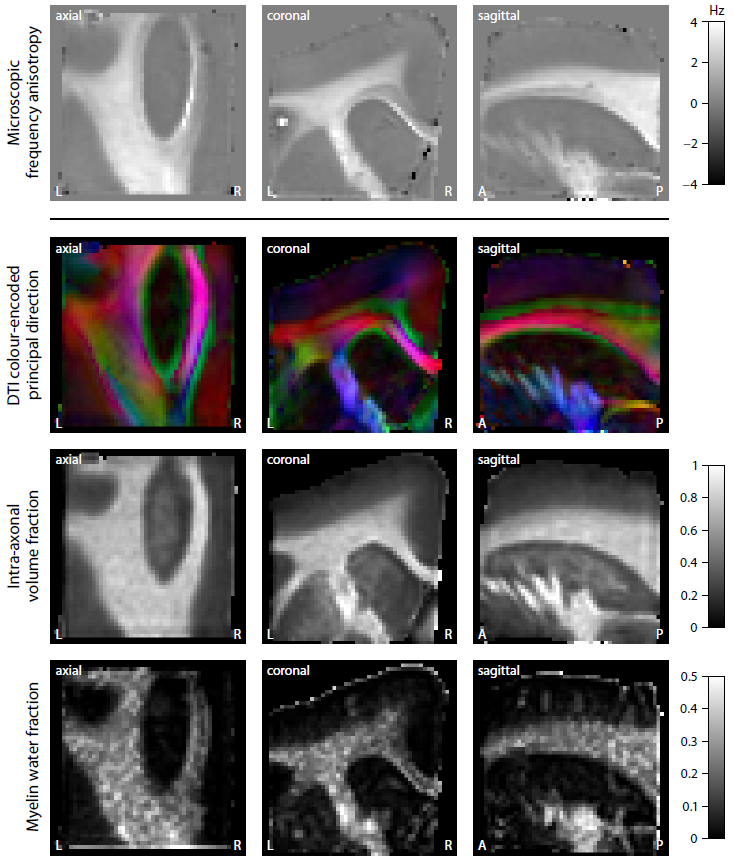
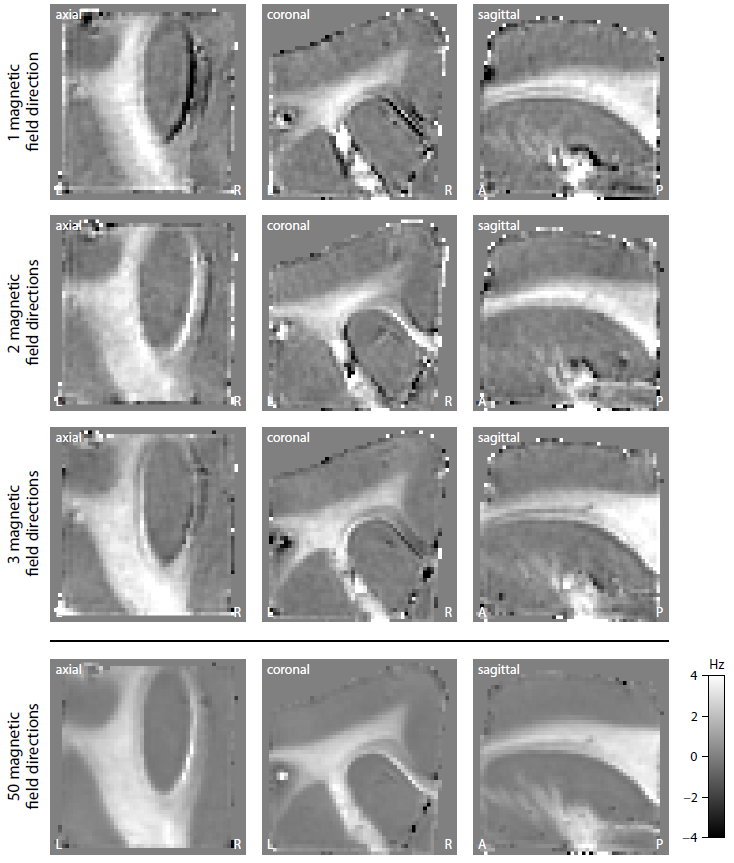
Figure 2 shows the mean magnitude and phase of the gradient-echo signal after frequency difference mapping12, background field removal, normalisation with respect to grey matter and SMT processing. Figure 3 (first row) plots the microscopic frequency anisotropy $$$f_A$$$ unconfounded by the axon orientation distribution and magnetic field direction. These maps were obtained without knowledge of the directional tissue structure, but using a dense sampling of the magnetic field directions. In Figure 4 we demonstrate the estimation of the microscopic susceptibility anisotropy from only few magnetic field directions and the diffusion-based axon orientation distribution. Our results suggest that the proposed technique is capable of recovering the overall contrast, thereby factoring out the effects due to the dependence of the gradient-echo measurements on the magnetic field direction to a large extent.
Discussion
We have introduced a new technique enabling the recovery of microscopic susceptibility anisotropy in the presence of directional tissue heterogeneity. This was carried out by adapting the Spherical Mean Technique (SMT), a method recently proposed in diffusion MRI10,11, to gradient-echo measurements. To demonstrate the general idea, we used a simple phenomenological model of microscopic frequency anisotropy, which can be extended to more complex models. A special feature of this study is the BuckyBall holder, which allowed for the highest angular resolution of magnetic field directions achieved so far. In addition, we demonstrated in principle the clinical viability of microscopic susceptiblity anisotropy mapping. The technique requires only few magnetic field directions if used with diffusion scans.
Acknowledgements
The authors thank the Jon Kaas lab and Kurt Schilling (Vanderbilt University) for providing the brain sample. This work was supported by grants EPSRC EP/M020533/1, EPSRC EP/N018702/1, H2020 634541-2 and NIH/NIBIB EB019980. The software is available online at https://ekaden.github.io and http://www.vuiis.vanderbilt.edu/~doesmd/MERA/MERA_Toolbox.html.References
1. He X and Yablonskiy DA. Biophysical mechanisms of phase contrast in gradient echo MRI. Proceedings of the National Academy of Sciences of the United States of America, 106:13558–13563, 2009.
2. Bender B and Klose U. The in vivo influence of white matter fiber orientation towards B0 on T2* in the human brain. NMR in Biomedicine, 23:1071–1076, 2010.
3. Lee J, Shmueli K, Fukunaga M, van Gelderen P, Merkle H, Silva AC, and Duyn JH. Sensitivity of MRI resonance frequency to the orientation of brain tissue microstructure. Proceedings of the NationalAcademy of Sciences of the United States of America, 107:5130–5135, 2010.
4. Liu C, Li W, Johnson GA, and Wu B. High-field (9.4 T) MRI of brain dysmyelination by quantitative mapping of magnetic susceptibility. NeuroImage, 56:930–938, 2011.
5. Lee J, Shmueli K, Kang BT, Yao B, Fukunaga M, van Gelderen P, Palumbo S, Bosetti F, Silva AC, and Duyn JH. The contribution of myelin to magnetic susceptibility-weighted contrasts in high-field MRI of the brain. NeuroImage, 59:3967–3975, 2012.
6. Lodygensky GA, Marques JP, Maddage R, Perroud E, Sizonenko SV, Hüppi PS, and Gruetter R. In vivo assessment of myelination by phase imaging at high magnetic field. NeuroImage, 59:1979–1987, 2012.
7. Wharton S and Bowtell R. Gradient echo based fiber orientation mapping using R2* and frequency difference measurements. NeuroImage, 83:1011–1023, 2013.
8. Sukstanskii AL and Yablonskiy DA. On the role of neuronal magnetic susceptibility and structure symmetry on gradient echo MR signal formation. Magnetic Resonance in Medicine, 71:345–353, 2014.
9. Aggarwal M, Kageyama Y, Li X, and van Zijl PC. B0-orientation dependent magnetic susceptibility-induced white matter contrast in the human brainstem at 11.7T. Magnetic Resonance in Medicine, 75: 2455–2463, 2016.
10. Kaden E, Kruggel F, and Alexander DC. Quantitative mapping of the per-axon diffusion coefficients in brain white matter. Magnetic Resonance in Medicine, 75:1752–1763, 2016.
11. Kaden E, Kelm ND, Carson RP, Does MD, and Alexander DC. Multi-compartment microscopic diffusion imaging. NeuroImage, 139:346–359, 2016.
12. Wharton S and Bowtell R. Fiber orientation-dependent white matter contrast in gradient echo MRI. Proceedings of the National Academy of Sciences of the United States of America, 109:18559–18564, 2012.
Figures