0464
Relationship between cell swelling, functional neuronal status and water diffusion in the rat brain1NeuroSpin, CEA, Gif-sur-Yvette, France
Synopsis
Diffusion fMRI (DfMRI) allows to monitor brain function without BOLD vascular confounding effects. Infusion in the rat brain thalamus central median nucleus (CM) of a cell swelling inducer/blocker resulted in ADC changes confirming DfMRI sensitivity to local cell size status. ADC changes closely reflected local functional neuronal status, as evidenced from LFP recordings and electrical current thresholds required to wake-up the animals. They were also observed in remote locations connected with CM. Those results support that neural swelling is an important mechanism underlying DfMRI, and that cell size variations in neuronal networks are an important feature associated with their activity.
Purpose
Diffusion fMRI (DfMRI) has been shown to closely reflect neural activity1 without BOLD confounding hemodynamic effects2, as DfMRI signals are not of vascular origin3. Instead, one putative mechanism underlying DfMRI is activity-triggered cell swelling within neural tissue1,3,4. To check this hypothesis we have investigated the relationship between functional neuronal status and water apparent diffusion coefficient (ADC) in the rat brain under different conditions, from resting state under medetomidine anesthesia to pharmacological challenges blocking or enhancing cell swelling using furosemide5,6 or hypotonic artificial cerebrospinal fluid (aCSF)7, respectively.Methods
Experiments were conducted in 86 Wistar rats at 7T (PharmaScan, Bruker). DfMRI images were acquired with the following parameters: diffusion-sensitized double SE-EPI sequence; TR/TE=2500/32 ms, FOV=2.5×2.5 cm2, Matrix=100×100, 10 slices, 1.5 mm thickness, b-values=1000 and 1800 mm2/s along 3 directions; [X=1,Y=0,Z=0], [0,1,0], and [0,0,1]. Breathing, CO2 concentration and rectal temperature of the rats were monitored and artificially controlled during scanning. In a first DfMRI study (Fig. 1), DfMRI images were continuously acquired for 10 min under medetomidine (med) dosages of 0.1 and 0.3 mg/kg/h (i.v.) following a 30 min stabilization interval. Local field potentials (LFPs) were also recorded. ADC maps were calculated for each time point as ADC=ln(S1000/S1800)/800. Pre-processing and statistical analysis of two-way repeated ANOVA were performed with SPM8 over the whole time courses and dosage, respectively. For the pharmacological DfMRI studies (Fig. 2, 5), DfMRI images were acquired under 0.1 or 0.3 mg/kg/h medetomidine for 30 min one day after surgical insertion of a cannula into the central medial thalamus (CM). A 10 min-infusion with normal osmolality aCSF (control), -80 mOsm hypotonic aCSF (H-80) (cell swelling enhancer7), or 1.5 mM furosemide (cell swelling blocker5,6) was performed 5 min after the start of the DfMRI acquisition. As a marker of CM functional neuronal status the current threshold to provoke an awake response under CM electrical stimulation (100 Hz, pulse width 0.4 ms, duration 10s, increasing intensity from 0.3 to 1.2 mA) before and after the CM infusions.Results
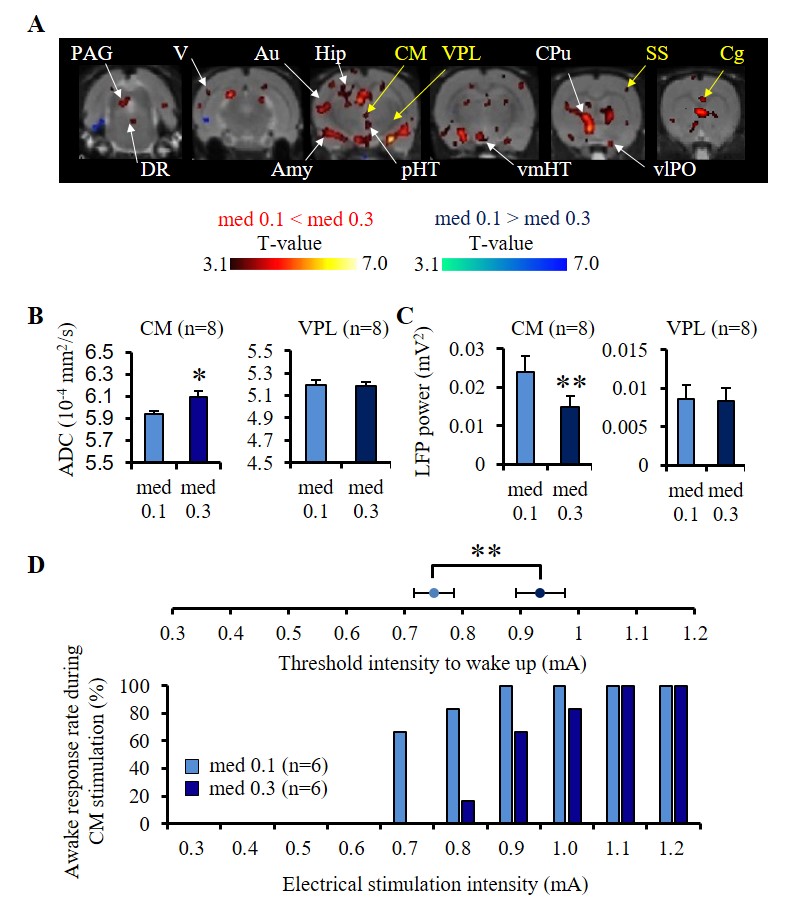
In the resting state the ADC increased upon increasing medetomidine dosage at the cerebral cortex (Au; auditory cortex, V; visual cortex), the limbic region (Hip; hippocampus, Amy; amygdala), a network of regions (CM; central medial thalamus, CPu; caudate-putamen, Cg; cingulate cortex, SS; somatosensory cortex, vlPO; ventrolateral preoptic area, pHT; posterior hypothalamus, vmHT; ventromedial hypothalamus, DR; dorsal raphe, and PAG; periaqueductal gray) known to be associated with wakefulness/sleep conditions8 (Fig. 1A). The ADC increase in CM was negatively correlated with LFP power indicating neural deactivation, while there was no change in ADC and LFP power in the thalamus ventral posterior nucleus (VPL, control area) (Fig. 1B, C). The CM stimulation threshold intensity to trigger a 100% awake response increased significantly upon increasing medetomidine dosage (Fig. 1D). Stimulation of VPL did not wake up any animal.
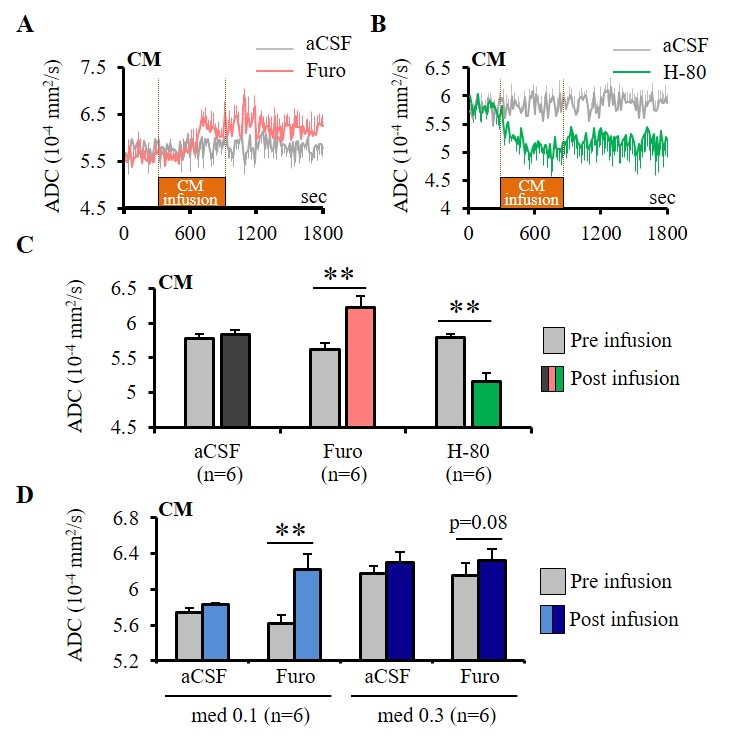
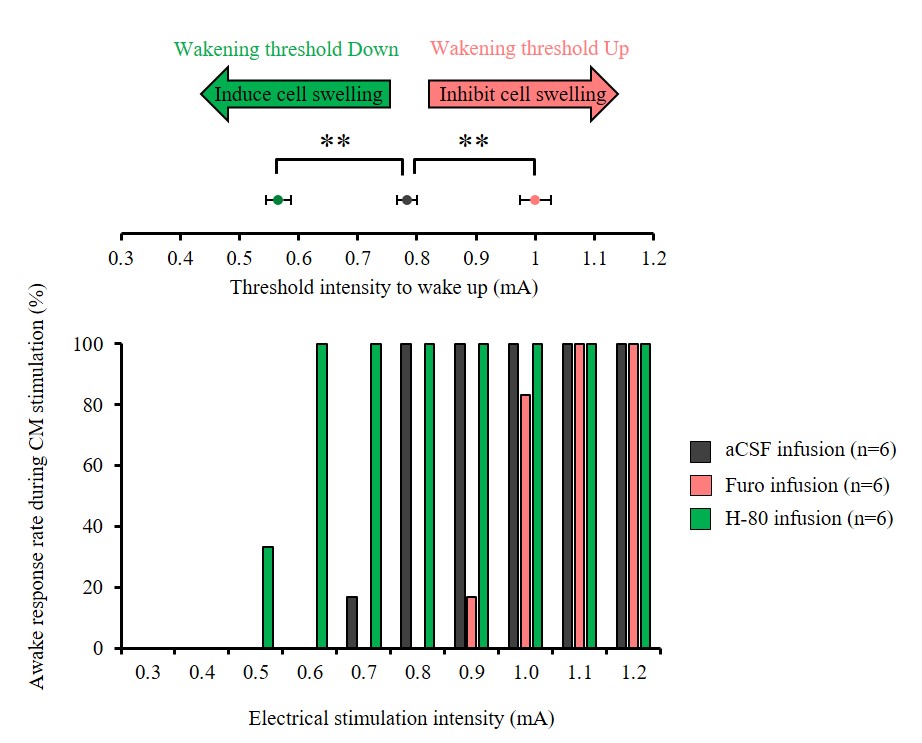
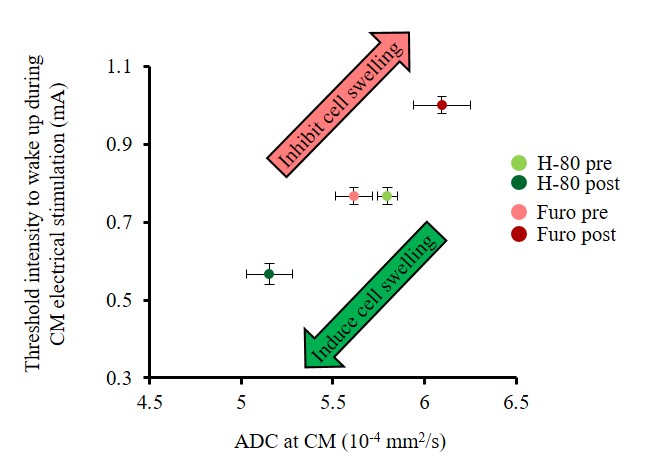
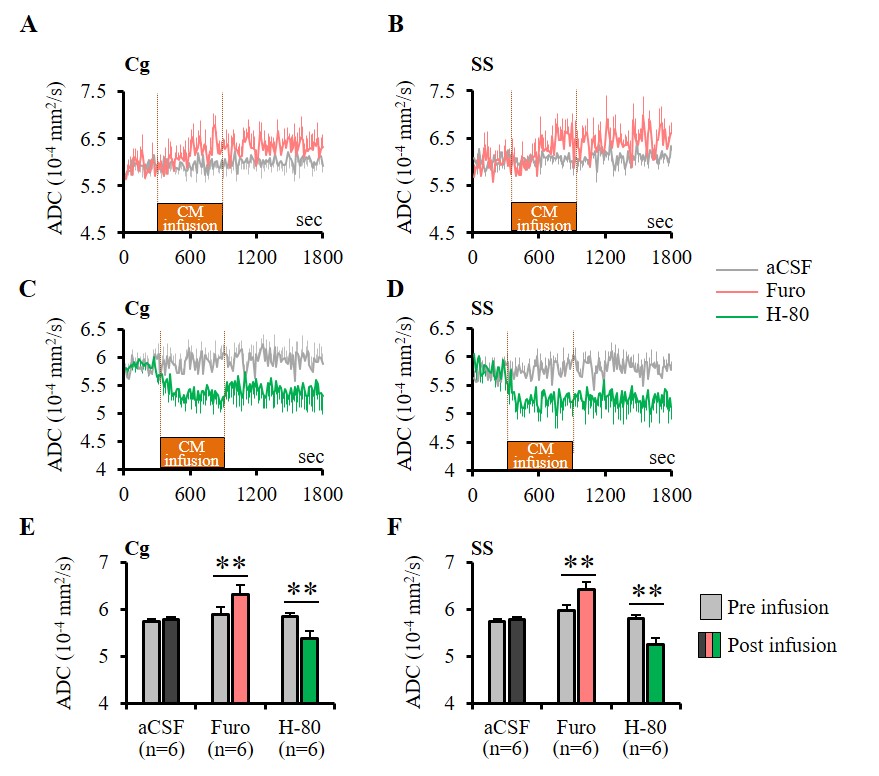
Furosemide (Furo) injection into CM under 0.1 mg/kg/h medetomidine resulted in a significant ADC increase locally (Fig. 2A, C) and a significant increase in the current threshold to wake up the animals (Fig. 3). The ADC increase under 0.3 mg/kg/h medetomidine was not significant, suggesting that residual amounts of dynamic cell swelling could still be inhibited at low dose of medetomidine, but no longer at the lower neuronal activity level associated with deeper anesthesia (Fig. 2D). Conversely, H-80 CM infusion led to a significant ADC decrease (Fig. 2B, C) associated to a decrease of the in the current threshold to wake up the animals (Fig. 3). Overall there was a significant correlation between CM ADC value (as modulated by the pharmacological challenge) and the wake-up current threshold (Fig. 4). Remarkably ADC increases and decreases induced in CM were significantly mirrored in remote regions functionally connected with CM9, especially the cingulate cortex (Cg) and the somatosensory cortex (SS) (Fig. 5).
Discussion and conclusion
Local infusion in CM of a cell swelling inducer and blocker resulted in ADC changes confirming DfMRI sensitivity to local cell size status. Those ADC changes closely reflected local functional neuronal status, as evidenced from LFPs and electrical current thresholds to wake-up the animals, and were also observed in remote locations functionally connected with CM. Those results strongly support that neural swelling is an important mechanism underlying DfMRI, and also that cell size variations in neuronal networks, likely at dendritic spine level, are an important feature associated with the network activity.Acknowledgements
We thank Boucif Djemai for support with general animal handling. We thank the Louis-Jeantet and Louis D. Foundations for their generous support.References
1. Le Bihan D, Urayama S, Aso T, Hanakawa T, Fukuyama H. Direct and fast detection of neuronal activation in the human brain with diffusion MRI. Proc Natl Acad USA. 2006;103(21):8263-8268.
2. Abe Y, Tsurugizawa T, Le Bihan D. Anesthesia increases water diffusion in wakefulness/sleep brain regions in the rat brain. Proc Intl Soc Mag Reson Med 2016;24:3781.
3. Tsurugizawa T, Ciobanu L, Le Bihan D. Water diffusion in brain cortex closely tracks underlying neuronal activity. Proc Natl Acad USA. 2013;110(28):11636-11641.
4. Vincis R, Lagier S, Van De Ville D, Rodriguez I, Carleton A. Sensory-evoked intrinsic imaging signals in the olfactory bulb are independent of neurovascular coupling. Cell Rep. 2015;12(2):313-325.
5. Williams JR, Sharp JW, Kumari VG, Payne JA. The neuron-specific K-Cl cotransporter, KCC2. J Biol Chem. 1999;274(18):12656-12664.
6. Pal I, Nyitrai G, Kardos J, Heja L. Neuronal and astroglial correlates underlying spatiotemporal intrinsic optical signal in the rat hippocampal slice. Plos One. 2013;8(3):e57694.
7. Andrew RD, Lobinowich ME, Osehobo EP. Evidence against volume regulation by cortical brain cells during acute osmotic stress. Exp Neurol. 1997;143(2):300-312.
8. Saper CB, Fuller PM, Pedersen NP, Lu J, Scammell TE. Sleep State Switching. Neuron. 2010;68(6):1023-1042.
9. Liu J, et al. Frequency-selective control of cortical and subcortical networks by central thalamus. Elife. 2015;4:e09215.
Figures