0460
Simultaneous multi-slice whole-brain VASO-BOLD, ToF, and SWI at 3T to investigate the vascular contributions in resting-state networks1Nuclear medecine and radiobiology, Université de Sherbrooke, Sherbrooke, QC, Canada, 2MR Clinical Science, Philips Healthcare Canada, Markham, ON, Canada, 3Research center of aging, CSSS-IUGS, Sherbrooke, QC, Canada, 4Department of Pharmacology and Physiology, Université de Sherbrooke, Sherbrooke, QC, Canada, 5Department of Medecine, Université de Sherbrooke, Sherbrooke, QC, Canada, 6Diagnostic radiology, Université de Sherbrooke, Sherbrooke, QC, Canada
Synopsis
The structural nature of BOLD and CBV fluctuations during resting-state remains unclear. To address this, we first developed a simultaneous multi-slice VASO-BOLD EPI sequence at 3T and isolated resting-state VASO- and BOLD- based networks. We then performed ToF and SWI to quantify the arterial and venous contributions in each network. Overall, both BOLD and VASO showed similar networks which were spatially localized near large veins. Also, similar proportions of vasculature were observed throughout all networks. These results suggest that simultaneous BOLD-CBV acquisitions are feasible at 3T and that their resting state networks are spatially and structurally similar.
Introduction
Resting-state fMRI networks are often used to study the impact of brain disease or healthy aging on brain dynamics1. Since the BOLD contrast combines the cerebral metabolic rate of oxygen (CMRO2) with effects from cerebral blood flow and volume (CBF and CBV), important questions arise regarding the true origin of these networks, or more specifically, whether some simply reflect the heterogeneous layout of cortical veins and/or arteries. Recently, a simultaneous whole-brain vascular space occupancy (VASO)2 and BOLD acquisition was reported at 7T3. Based on this, we sought to develop a similar acquisition at 3T using a simultaneous VASO-BOLD EPI sequence. Image quality of the sequence was first assessed using a known cognitive task. We then used the same VASO-BOLD acquisition to investigate the similarities and differences between CBV- and BOLD-based resting-state networks obtained by machine-learning decomposition. We finally compared this to maps of arterial and venous density computed from Time of Flight angiography (ToF) and susceptibility weighting images (SWI) to investigate the vasculature of these networks.Methods
Image acquisition was performed in healthy young adults (N=12, 18-30 years old) on a Philips 3T scanner. Each session started with an anatomical T1-weighted MPRAGE acquisition (TR/TE 7.8/3.54 msec, voxel size of 1 mm³), followed by a resting-state VASO-BOLD acquisition (5 min, 240x240x100 FOV, TR/TI1/TI2/TE 3000/675/1825/20 msec, voxel size of 3x3x5 mm, 5-slice EPI readout with Multiband SENSE acceleration of 4, for a total of 20 slices). The VASO-BOLD acquisition was also tested on one participant using an alternating finger-tapping task (4min30, 30 secs on/off). Vascular brain structure (veins/arteries) was then assessed using a ToF angiography acquisition (200x200x120 FOV, TR/TE 23/3.6 msec, voxel size of 0.625x0.625x1.3 mm) and a high-resolution multi-echo SWI sequence (230x230x160 FOV, TR 28 msec, TE 6.9/12.6/18.3/24.0 msec, voxel size of 0.6x0.6x1.2mm). BOLD and VASO signal analysis were carried out using a pipeline consisting of motion correction, band-pass temporal filtering (0.005 to 0.1 Hz), spatial smoothing using non-local mean denoising4 and temporal normalisation (signal from -1.0 to 1.0) using AFNI5. Residual BOLD was finally regressed out of the VASO signal using a point-by-point divisions (VASO/BOLD)6. Both ToF and SWI were preprocessed using an in-house algorithm based on a Frangi measure of vesselness and vessels enhancement diffusion filtering7,8, then thresholded to obtain both whole-brain artery and vein maps. VASO and BOLD, SWI and ToF signals and maps were all registered to MNI standard space using ANTs non-linear registration9. The mean of all participants’ veins and arteries was computed to form a multi-subject venous and arterial atlas. The multi-subjects VASO and BOLD were respectively decomposed into 20 functionally defined maps using the multi-subject dictionary learning algorithm10 implemented in Nilearn11, similar to but more consistent, stable and less noisy than independent component analysis12. The VASO components were matched to the BOLD components to finally retain 16 positive matches. From these components, the percentage of veins and arteries was then reported as the proportion of non-zero voxels in each component map.Results
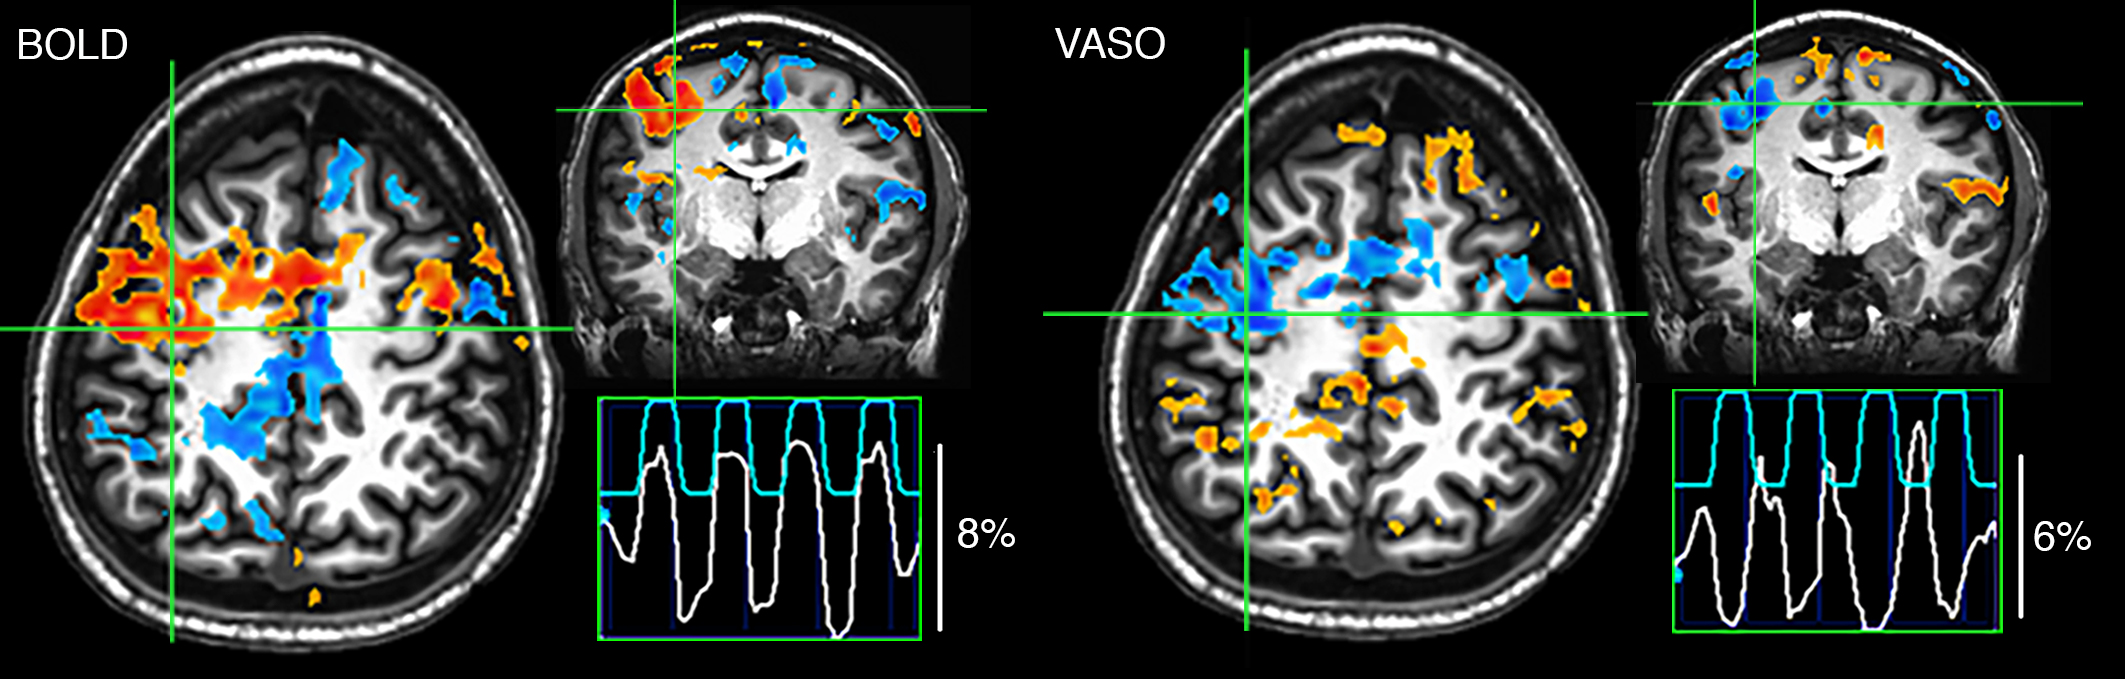
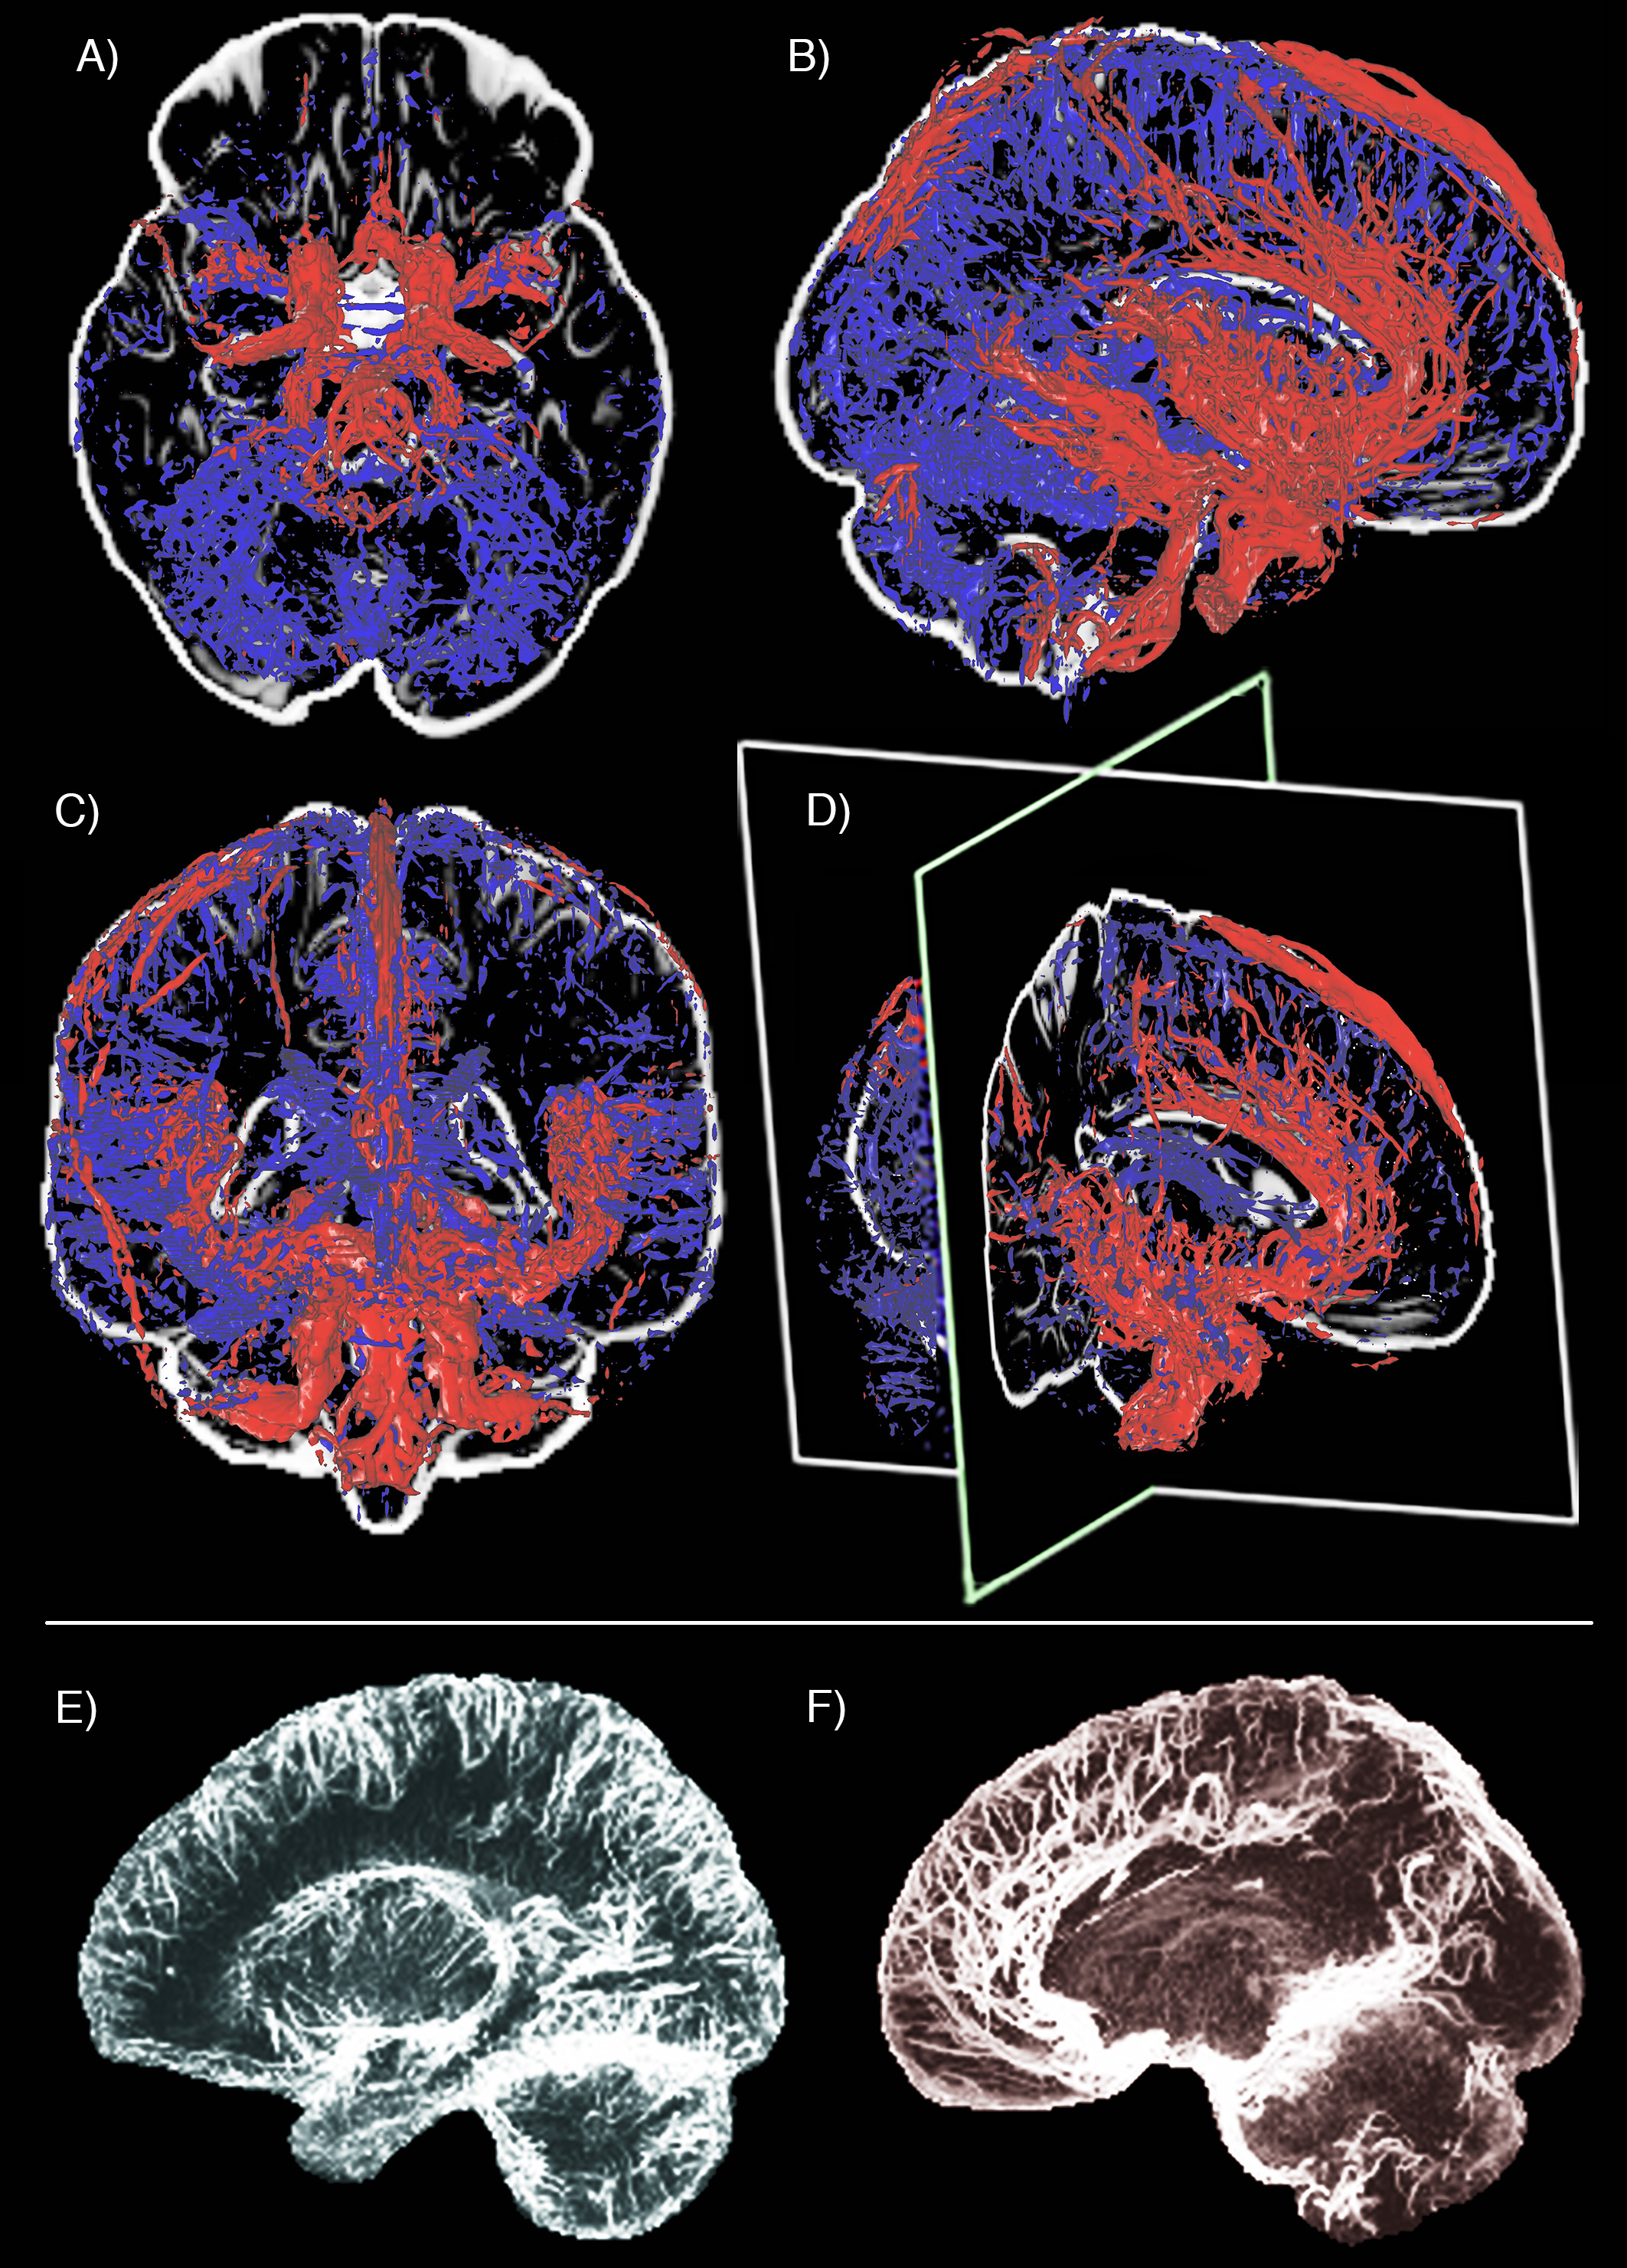
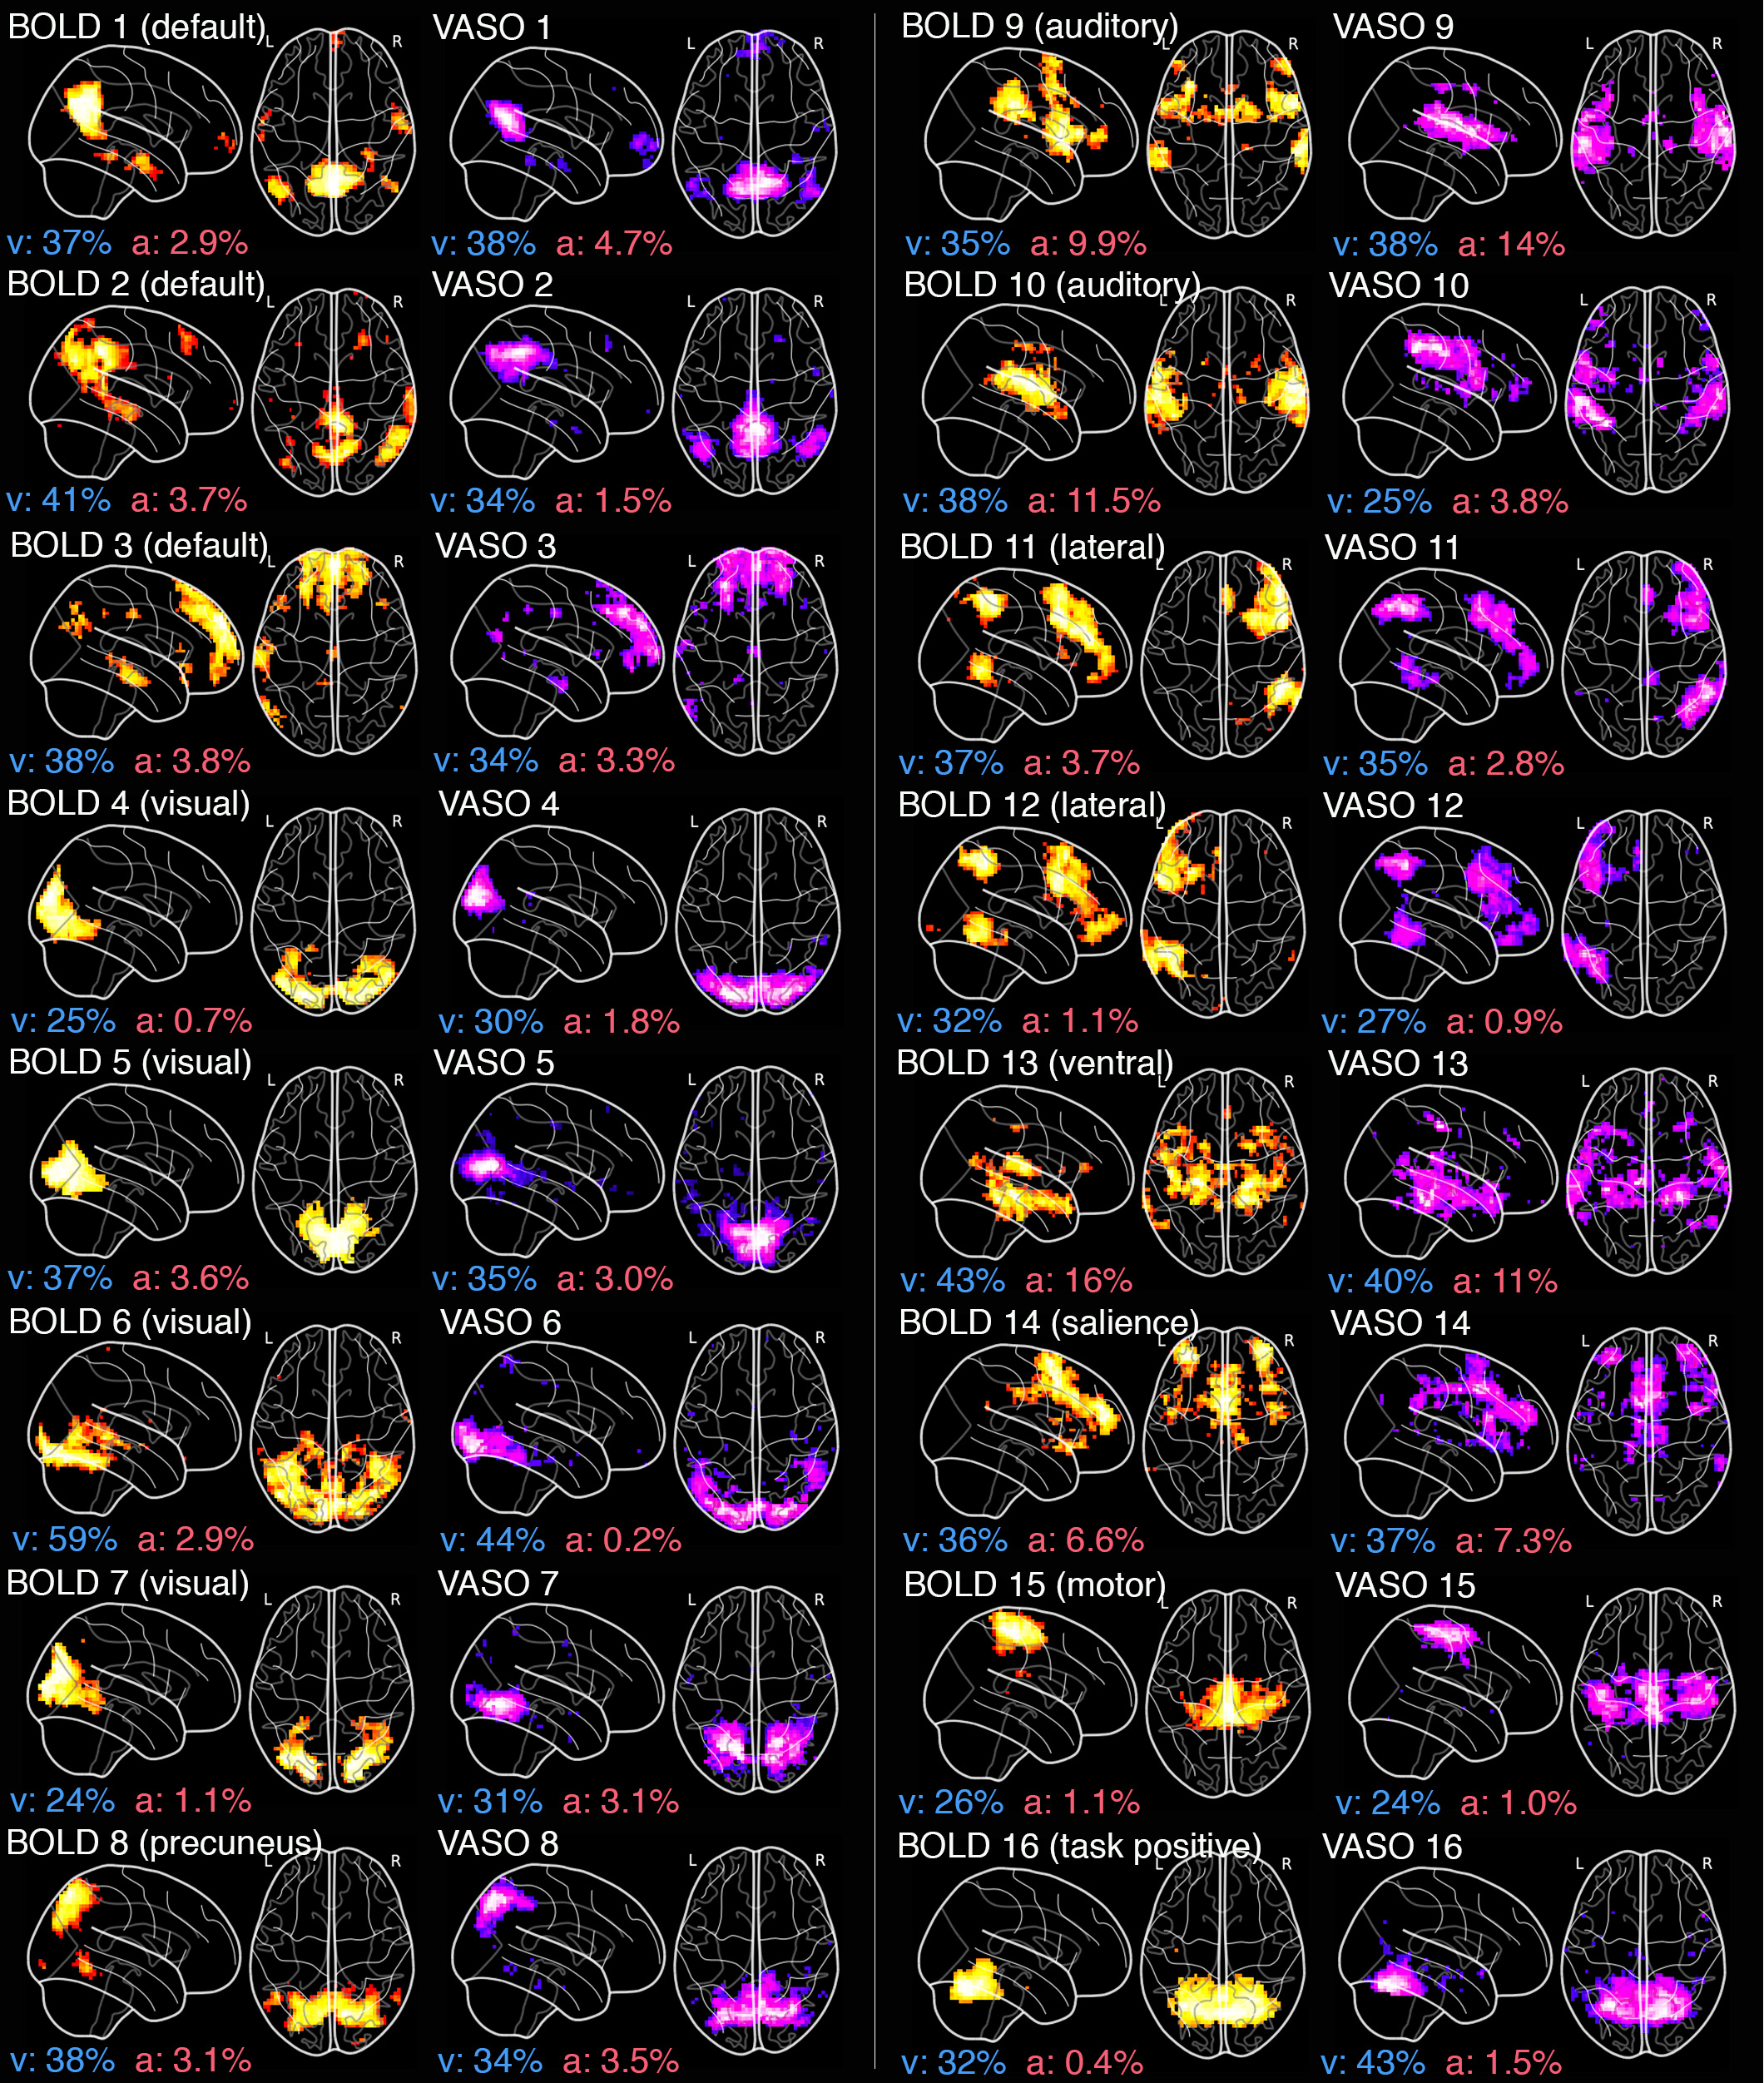
Figure 1 illustrates the proof-of-concept of our 3T simultaneous VASO-BOLD acquisition during a finger-tapping task, where both CBV and BOLD activations in the motor cortex are similar (percent change: 8% vs 6% respectively). Figure 2 illustrates both venous (blue) and arterial (red) vessels computed from the mean of all participants’ SWI and ToF, respectively. Figure 3 shows the 16 BOLD-based and VASO-based network components, as well as their respective proportion of venous and arterial voxels (Whole head: veins 28%, arteries 5.6%; BOLD networks: veins 36.1 +/- 8.2%, arteries 4.5 +/- 4.4%; CBV networks: veins 34.3 +/- 5.9%, arteries 4.0 +/- 3.8%). In all cases, BOLD and CBV networks were highly similar and were for the most part localized near the larger veins.Discussion & conclusion
We report reliable and highly similar brain networks detected from simultaneous multi-slice EPI VASO and BOLD across the brain. These results are in agreement with a previous study reporting a less consistent but similar parity across networks13. The improved correspondence observed in our results may be due to the use of a simultaneous multi-slice VASO-BOLD approach compared to separate 3D-GRASE VASO and EPI BOLD acquisitions which may be biased by slight changes in brain state. Even if our venous and arterial atlas revealed no significant distinction between the vascular composition of the networks, it was demonstrated that the resting state fluctuations observed by either VASO or BOLD occur in regions with a higher than average venous contribution, which is not the case for the arterial contribution.Acknowledgements
The authors would like to acknowledge the funding agencies which have supported this research; Natural Sciences and Engineering Research Council of Canada (NSERC) Discovery Grants (PGSD3-475005-2015), Canada Foundation for Innovation (CFI), Canada Research Chairs (CRC), QBIN (Quebec Bio-Imaging Network), Université de Sherbrooke FMSS graduate scholarship programs. We also thank to Dr. Jun Hua and his team for their help regarding the VASO sequences.References
1 Sala-Llonch R, Bartrés-Faz D, Junqué C. Reorganization of brain networks in aging: a review of functional connectivity studies. Front Psychol 2015; 6: 663.
2 Lu H, Golay X, Pekar JJ, van Zijl PCM. Functional magnetic resonance imaging based on changes in vascular space occupancy. Magn Reson Med 2003; 50: 263–274.
3 Huber L, Ivanov D, Guidi M, Turner R, Uludag K, Möller HE et al. Functional cerebral blood volume mapping with simultaneous multi-slice acquisition. Neuroimage 2016; 125: 1159–1168.
4 Bernier M, Chamberland M, Houde J-C, Descoteaux M, Whittingstall K. Using fMRI non-local means denoising to uncover activation in sub-cortical structures at 1.5 T for guided HARDI tractography. Front Hum Neurosci 2014; 8: 715.
5 Cox RW. AFNI: software for analysis and visualization of functional magnetic resonance neuroimages. Comput Biomed Res an Int J 1996; 29: 162–173.
6 Huber L, Ivanov D, Krieger SN, Streicher MN, Mildner T, Poser BA et al. Slab-selective, BOLD-corrected VASO at 7 Tesla provides measures of cerebral blood volume reactivity with high signal-to-noise ratio. Magn Reson Med 2014; 72: 137–148.
7 Frangi AF, Niessen WJ, Vincken KL, Viergever MA. Multiscale vessel enhancement filtering 1 Introduction 2 Method. Computer (Long Beach Calif) 1998; 1496: 130–137.
8 Manniesing R, Viergever MA, Niessen WJ. Vessel enhancing diffusion: a scale space representation of vessel structures. Med Image Anal 2006; 10: 815–25.
9 Avants B, Tustison N, Song G. Advanced Normalization Tools (ANTS). Insight J 2009; : 1–35.
10 Abraham A, Dohmatob E, Thirion B, Samaras D, Varoquaux G. Region segmentation for sparse decompositions: better brain parcellations from rest fMRI. 2014; : 8.
11 Abraham A, Pedregosa F, Eickenberg M, Gervais P, Mueller A, Kossaifi J et al. Machine learning for neuroimaging with scikit-learn. Front Neuroinform 2014; 8: 14.
12 Varoquaux G, Gramfort A, Pedregosa F, Michel V, Thirion B. Multi-subject Dictionary Learning to Segment an Atlas of Brain Spontaneous Activity. Springer, 2011, pp 562–573.
13 Miao X, Gu H, Yan L, Lu H, Wang DJJ, Zhou XJ et al. Detecting resting-state brain activity by spontaneous cerebral blood volume fluctuations using whole brain vascular space occupancy imaging. Neuroimage 2014; 84: 575–584.
Figures