0459
Mapping the task-related and resting-state vascular dynamic network connectivity in rats and humans1High-field Magnetic Resonance, Max Planck Institute for Biological Cybernetics, Tuebingen, Germany, 2Graduate Training Centre of Neuroscience, International Max Planck Research School, University of Tuebingen, Tuebingen, Germany, 3Department of Physics/Section on Neurobiology, University of California at San Diego, La Jolla, CA, United States, 4MGH/MIT/HMS Athinoula A. Martinos Center for Biomedical Imaging, MGH, Harvard Medical School, Charlestown, MA, United States
Synopsis
We have previously shown that hemodynamic signals can be directly detected from individual arterioles and venules penetrating the cortex. Here, the temporal correlation patterns of the vessel-specific hemodynamic signal are characterized in both rodent and human brains. At the resting state, the blood-oxygen-level-dependent (BOLD) signal from venules and the cerebral blood volume (CBV) signal from arterioles show large-scale vessel-specific correlation patterns in rats under anesthesia. Similarly, in awake human subjects, the BOLD hemodynamic signal correlated at the sulcus veins (3T), as well as at a few intra-cortical veins detected at 9.4T, showing vessel-specific activity and connectivity patterns with slow-frequency oscillation up to 0.1Hz.
Purpose
We have previously shown that hemodynamic signals can be directly detected from individual arterioles and venules penetrating the cortex1. Here, the temporal correlation patterns of the vessel-specific hemodynamic signal are characterized in both rodent and human brains. At the resting state, the BOLD signal from venules and the CBV signal from arterioles show large-scale vessel-specific correlation patterns in rats under anesthesia with slow-frequency oscillation from 0.01 to 0.04Hz. Similarly, in awake human subjects, the BOLD hemodynamic signal correlate at the sulcus veins (3T), as well as at a few intra-cortical veins detected at 9.4T, showing vessel-specific activity and connectivity patterns with slow-frequency oscillation up to 0.1Hz. Therefore, the single-vessel fMRI scheme can be translated to map vascular dynamic network connectivity in the human brain, showing vessel-dominated spatial correlation pattern of the BOLD fMRI signal fluctuation.Methods
All rat images were acquired with a 14.1T Bruker scanner with a transreceiver surface coil (6mm diameter). bSSFP was implemented with the following parameters: TE: 3.9 ms; TR, 7.8 ms; flip angle (FA), 12° ; matric, 128x128; slice thickness, 400 μm; in-plane resolution, 100x100 μm2, resulting in one slice repetition time of 1s. Total duration for each trial of rs-fMRI was 15 minutes, and 2-5 trails of BOLD/CBV rs-fMRI were acquired for each rat. A 3T Siemens Prisma system with a 20-channel receive head coil was used. EPI was applied with the following parameters: TR, 1000 ms; TE, 29 ms; FA, 60°; matrix, 121 x 119; in-plane resolution, 840 x840 μm2; slice thickness, 1.5 mm. The visual stimulation consisted of a circular black-white checkerboard. For the rs-fMRI, the duration of each trial was 15 minutes with the eyes closed. Under the 9.4T scanner, the parameters of EPI were: TR, 1000 ms; TE, 22 ms; FA, 50°; matrix, 300x300; in-plane resolution, 500x500 μm2; slice thickness, 0.8 mm.Results
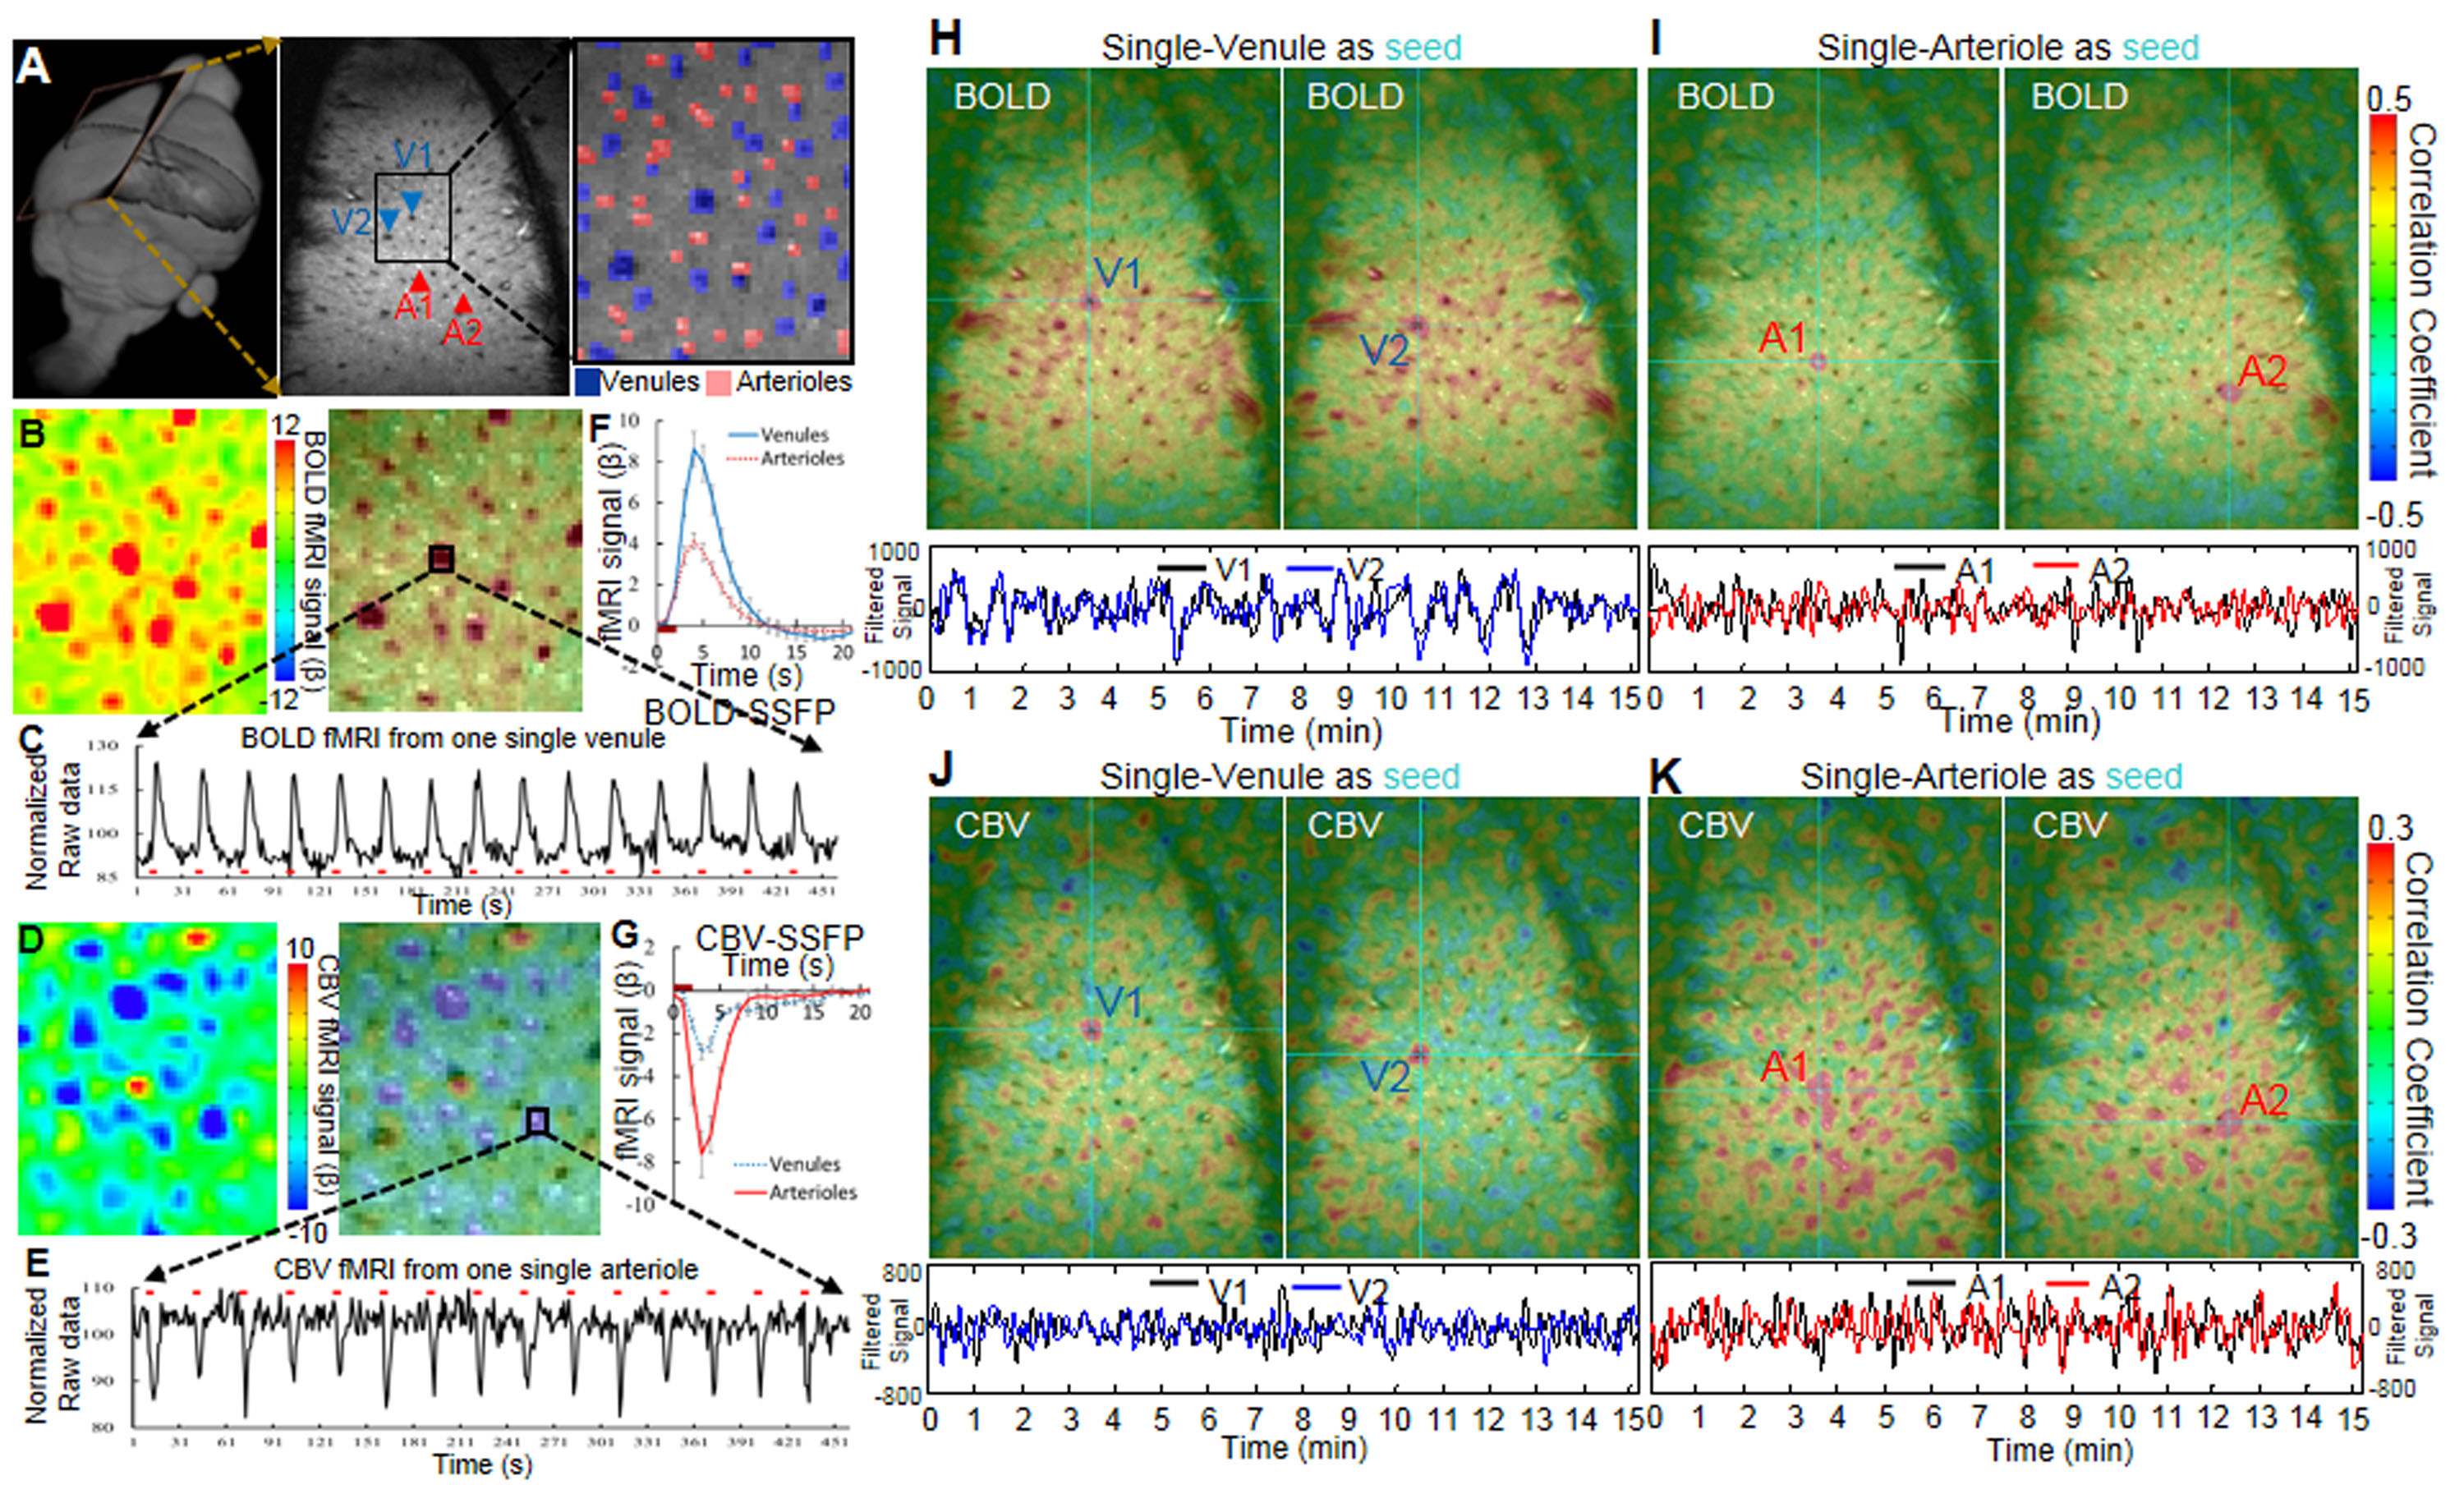
A MGE sequence was used to distinguish individual arterioles and venules to create the arteriole-venule (A-V) map (Fig. 1A). The evoked single-vessel BOLD and CBV fMRI signal was detected by bSSFP in anesthetized rats before and after the iron oxide particle injection (Fig. 1B-E). The averaged hemodynamic signal changes from arteriole and venule ROIs (Fig. 1F, G) showed venules dominated the positive BOLD signal and arterioles dominated the negative CBV signal.
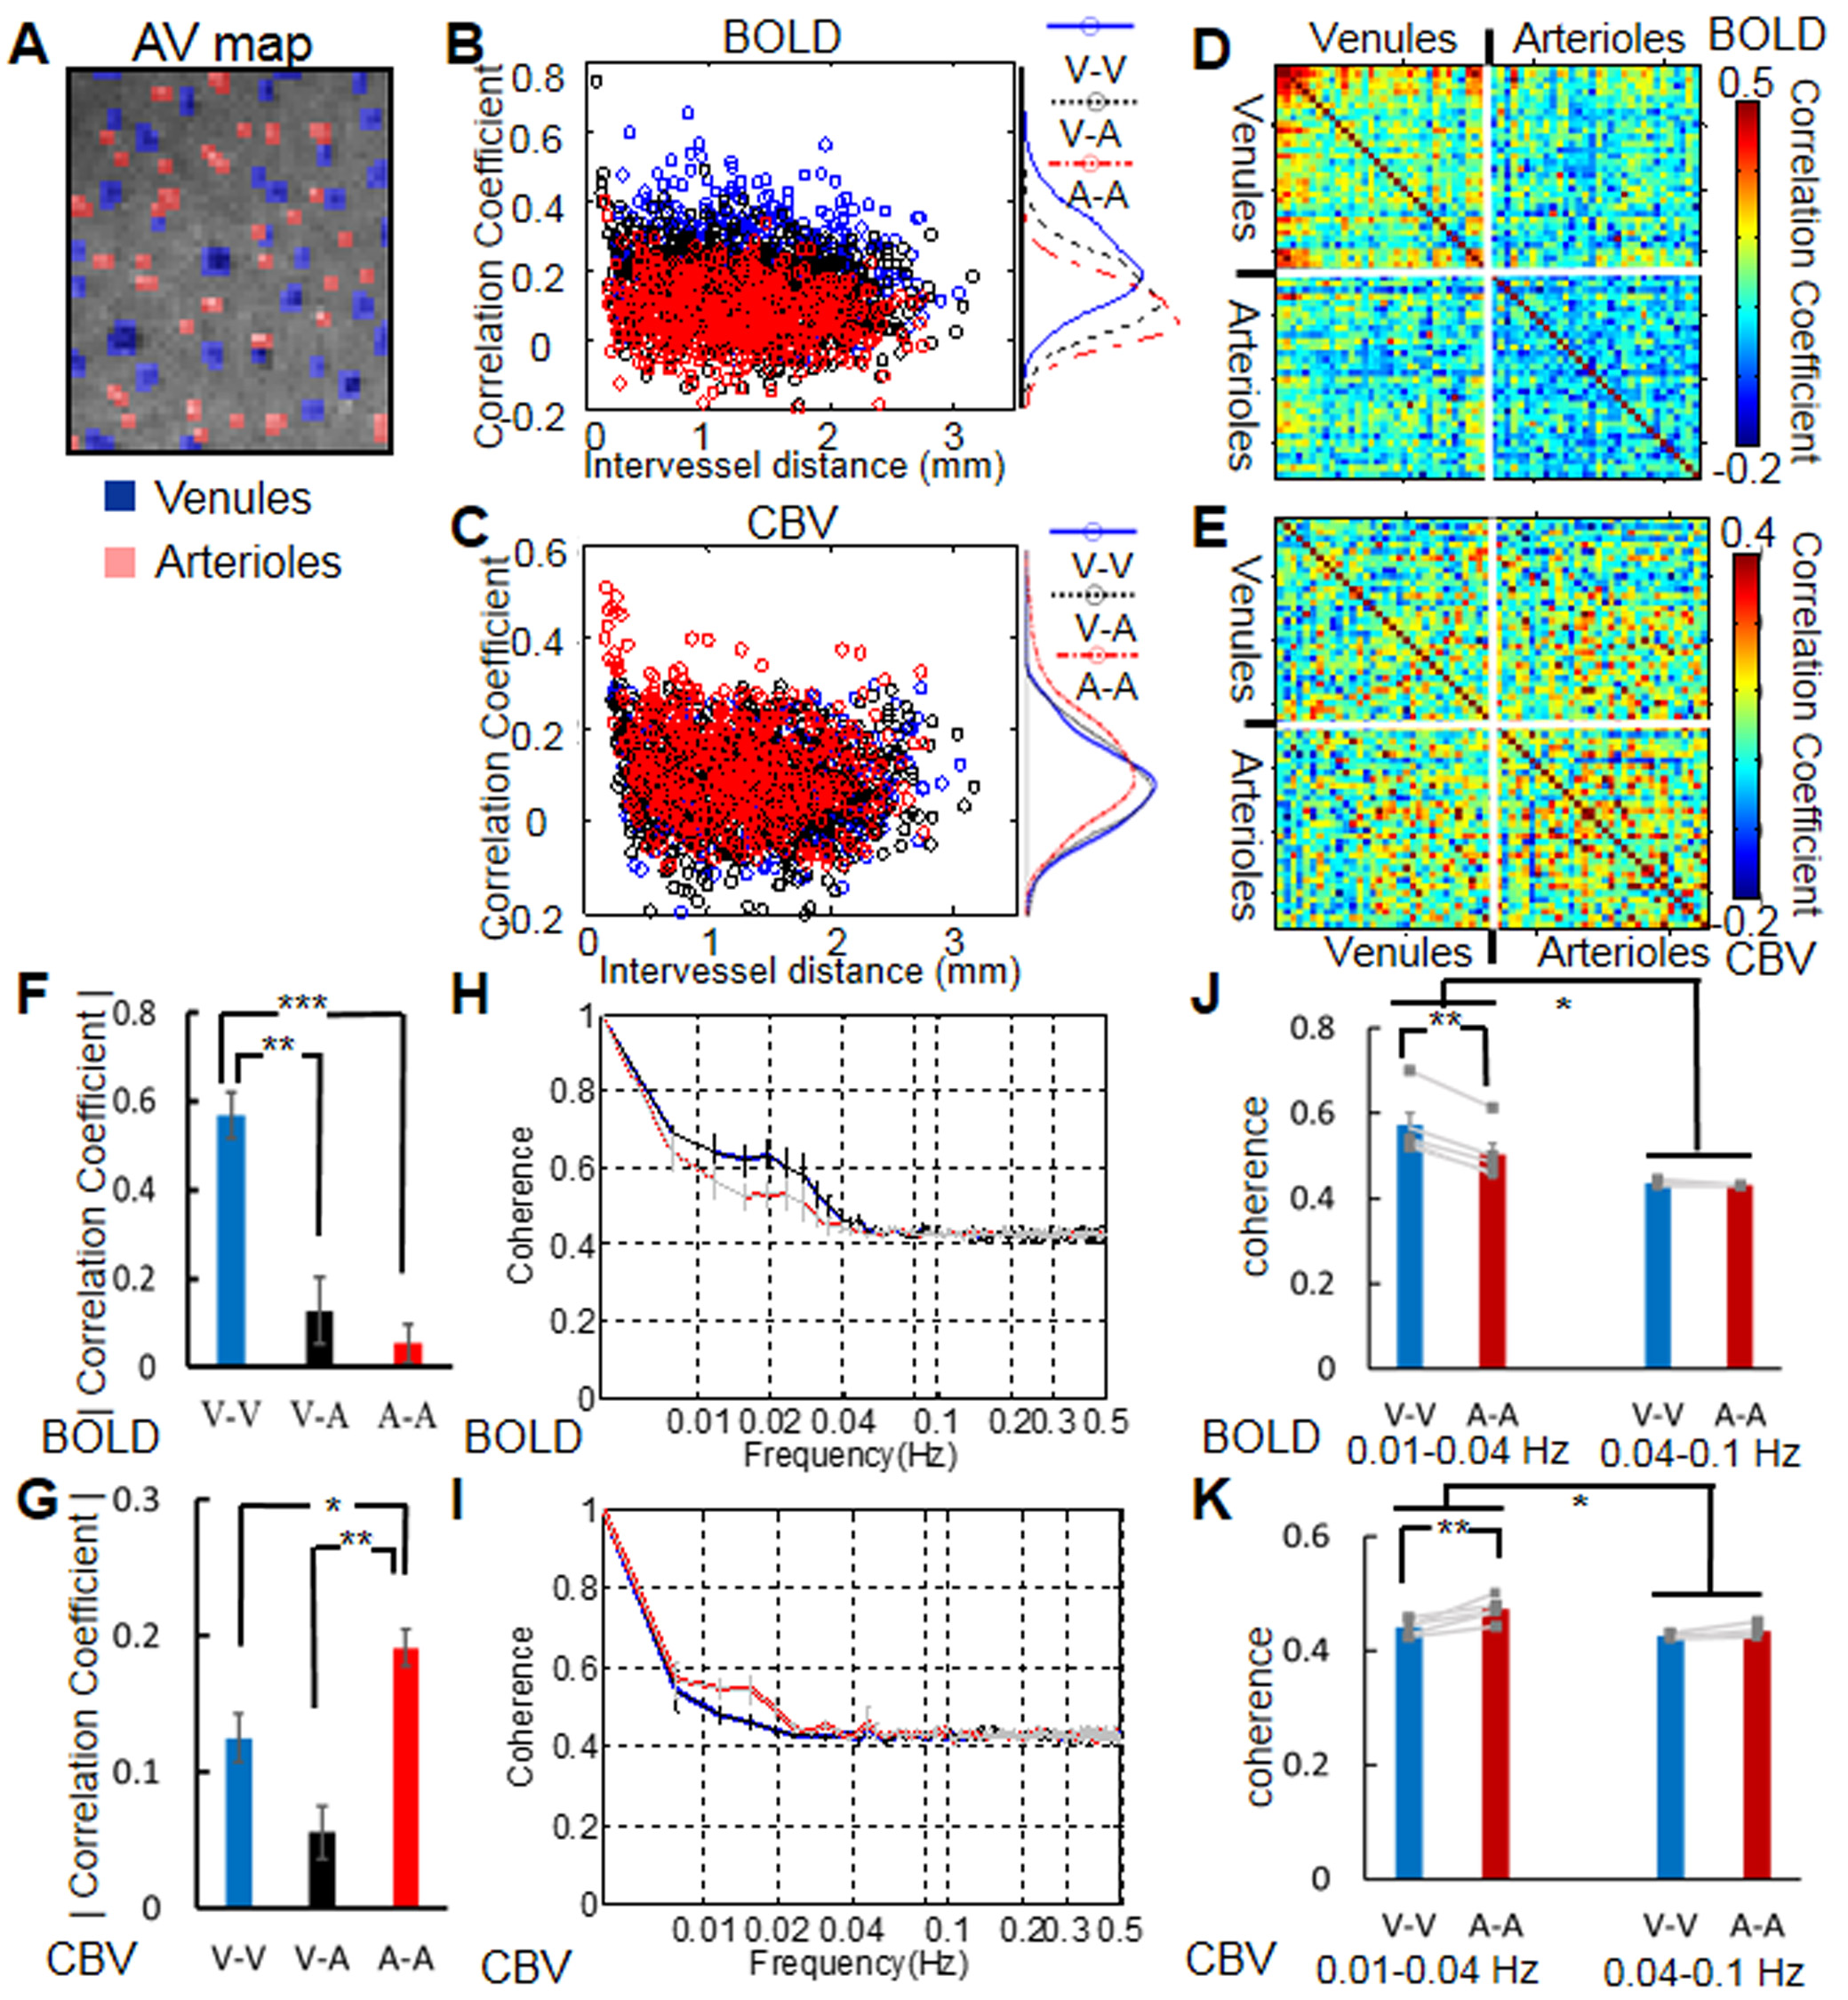
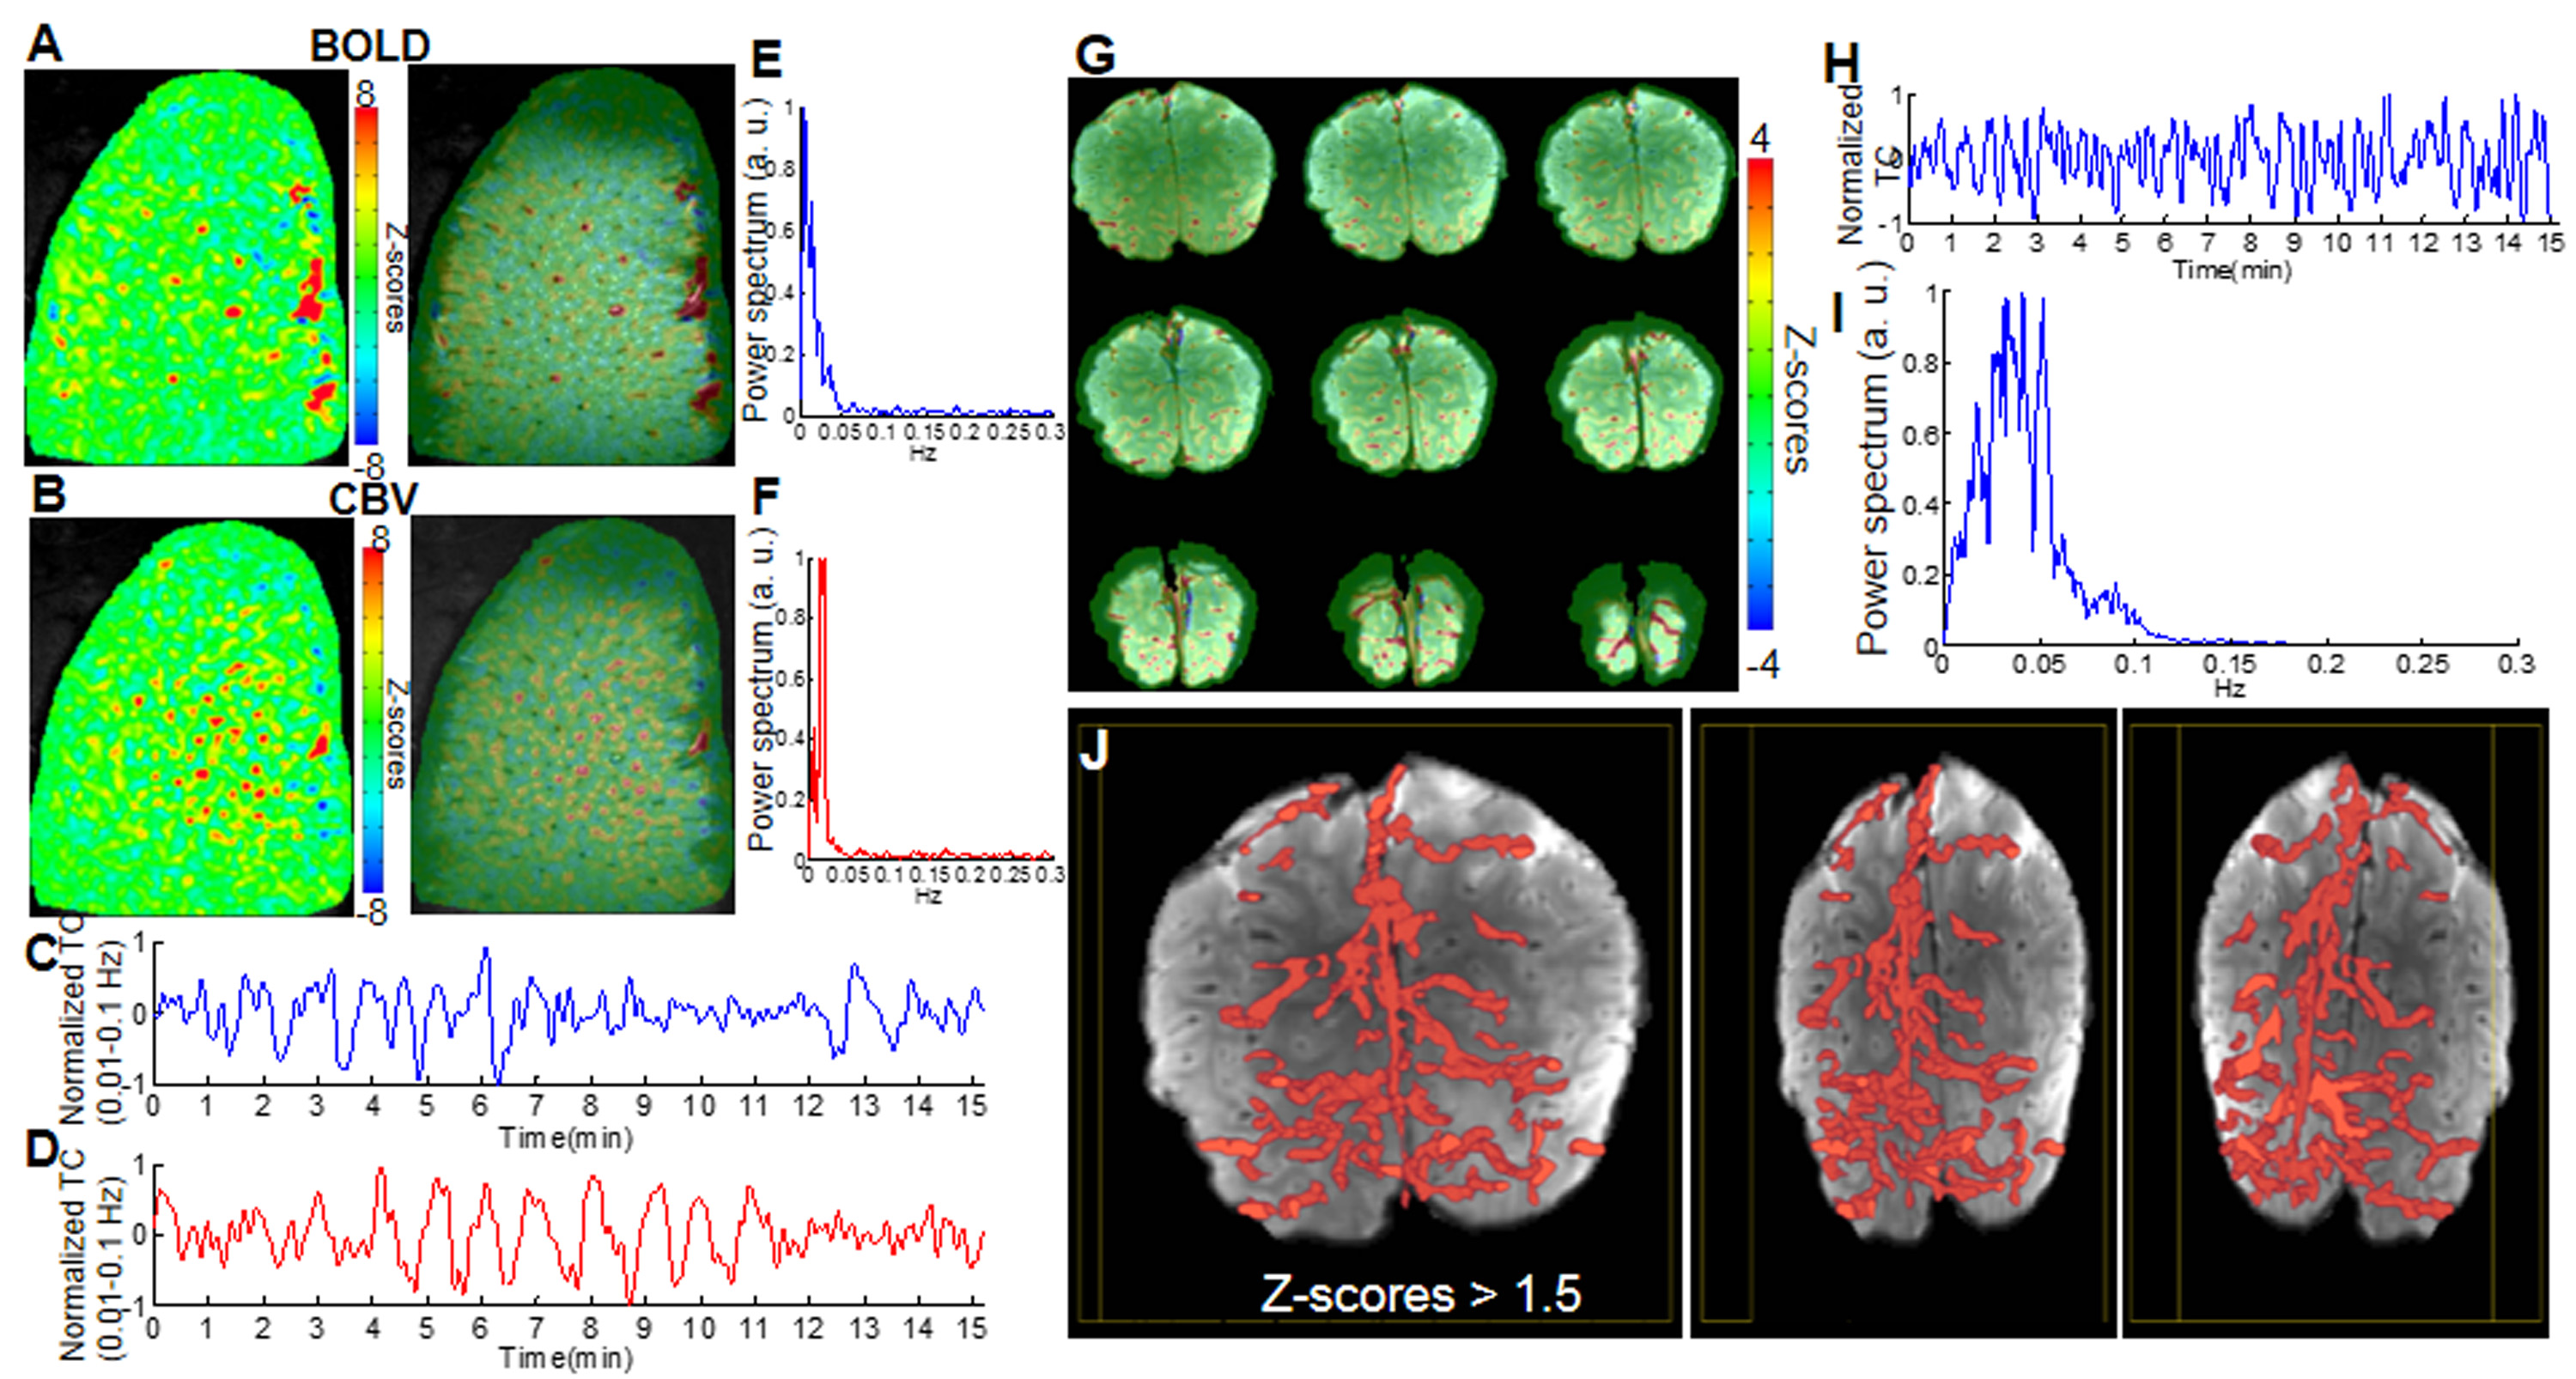
For the resting state fMRI, the individual arterioles or venules were selected as seed-voxels to calculate correlation maps of both BOLD and CBV-based fMRI signal fluctuation. For the BOLD signal fluctuation, venule voxels were highly correlated to each other but less salient for arterioles (Fig. 1H-I); in contrast, for the CBV signal fluctuation, arteriole voxels were correlated but not for venules (Fig. 1J-K). Moreover, the coherence analysis of the dynamic signal from venule or arteriole pairs showed the coherent oscillation mainly distributed in the 0.01-0.04 Hz frequency range in rats anesthetized by alpha-chloralose(Fig. 2H-I). The vessel-specific vascular dynamic connectivity mapping was also identified using independent component analysis (ICA), showing the venule-specific dynamic connectivity for the BOLD signal fluctuation and arteriole-specific dynamic connectivity for the CBV signal fluctuation (Fig. 4A-F).
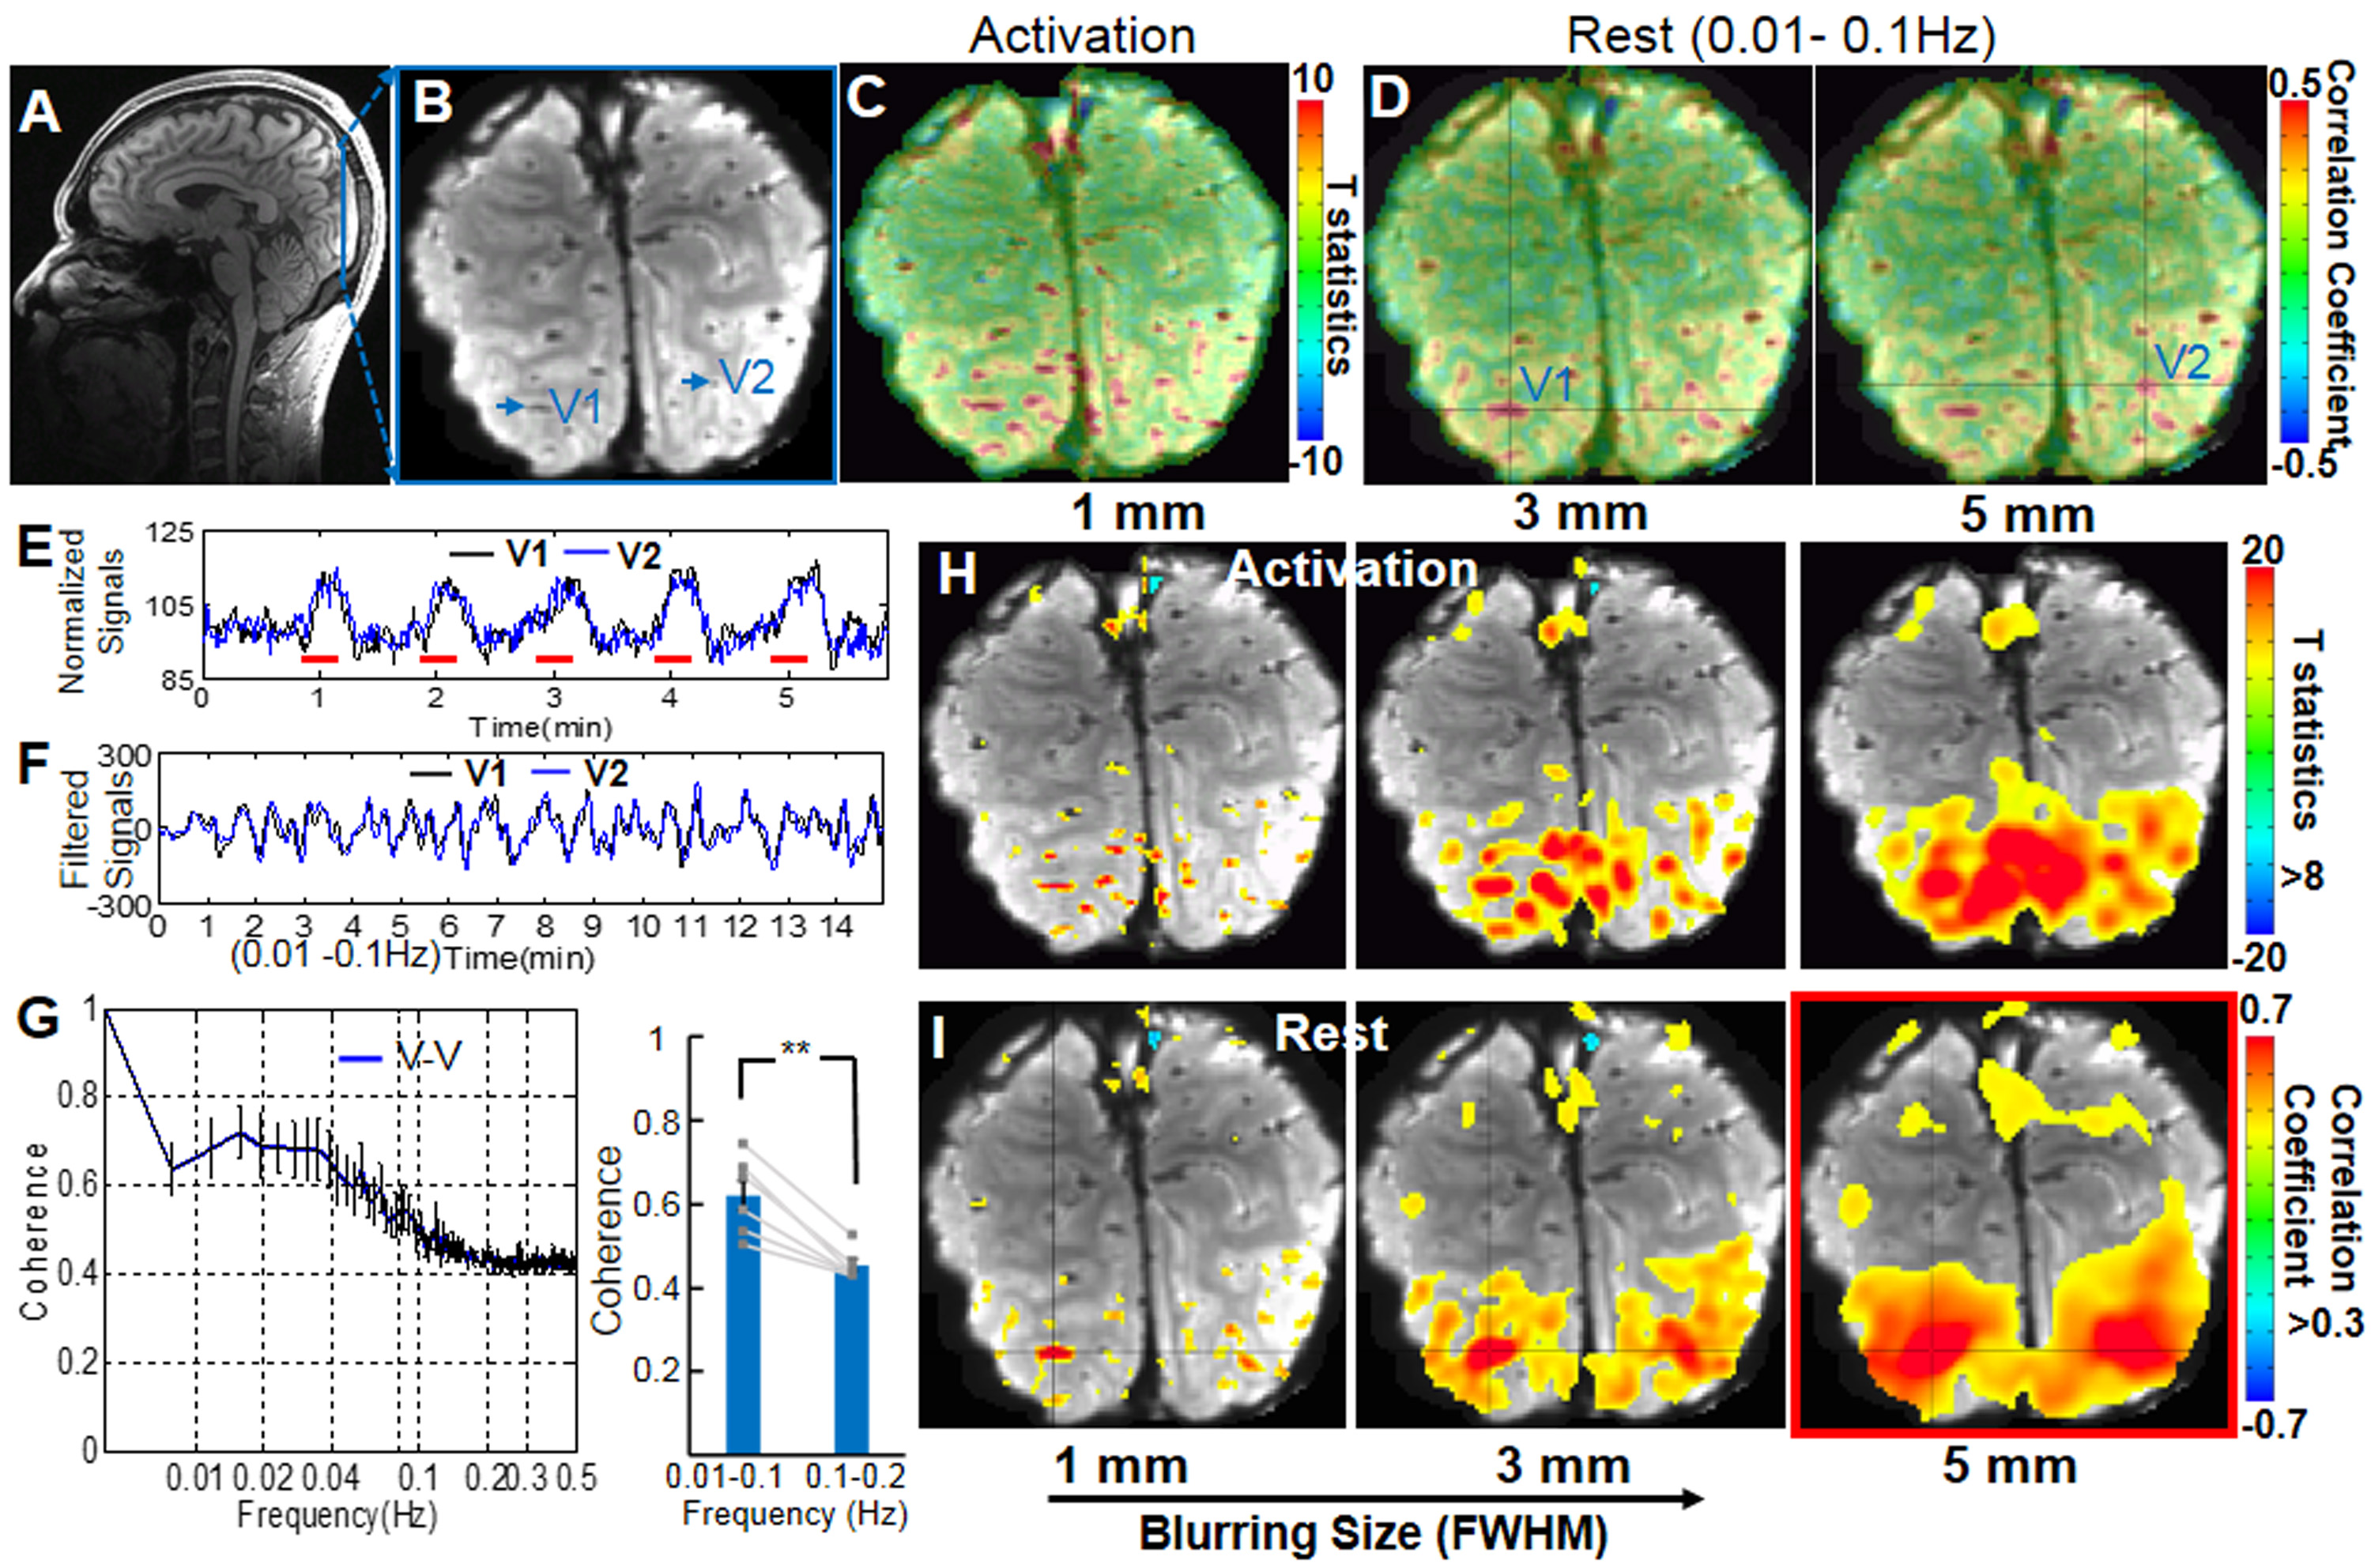
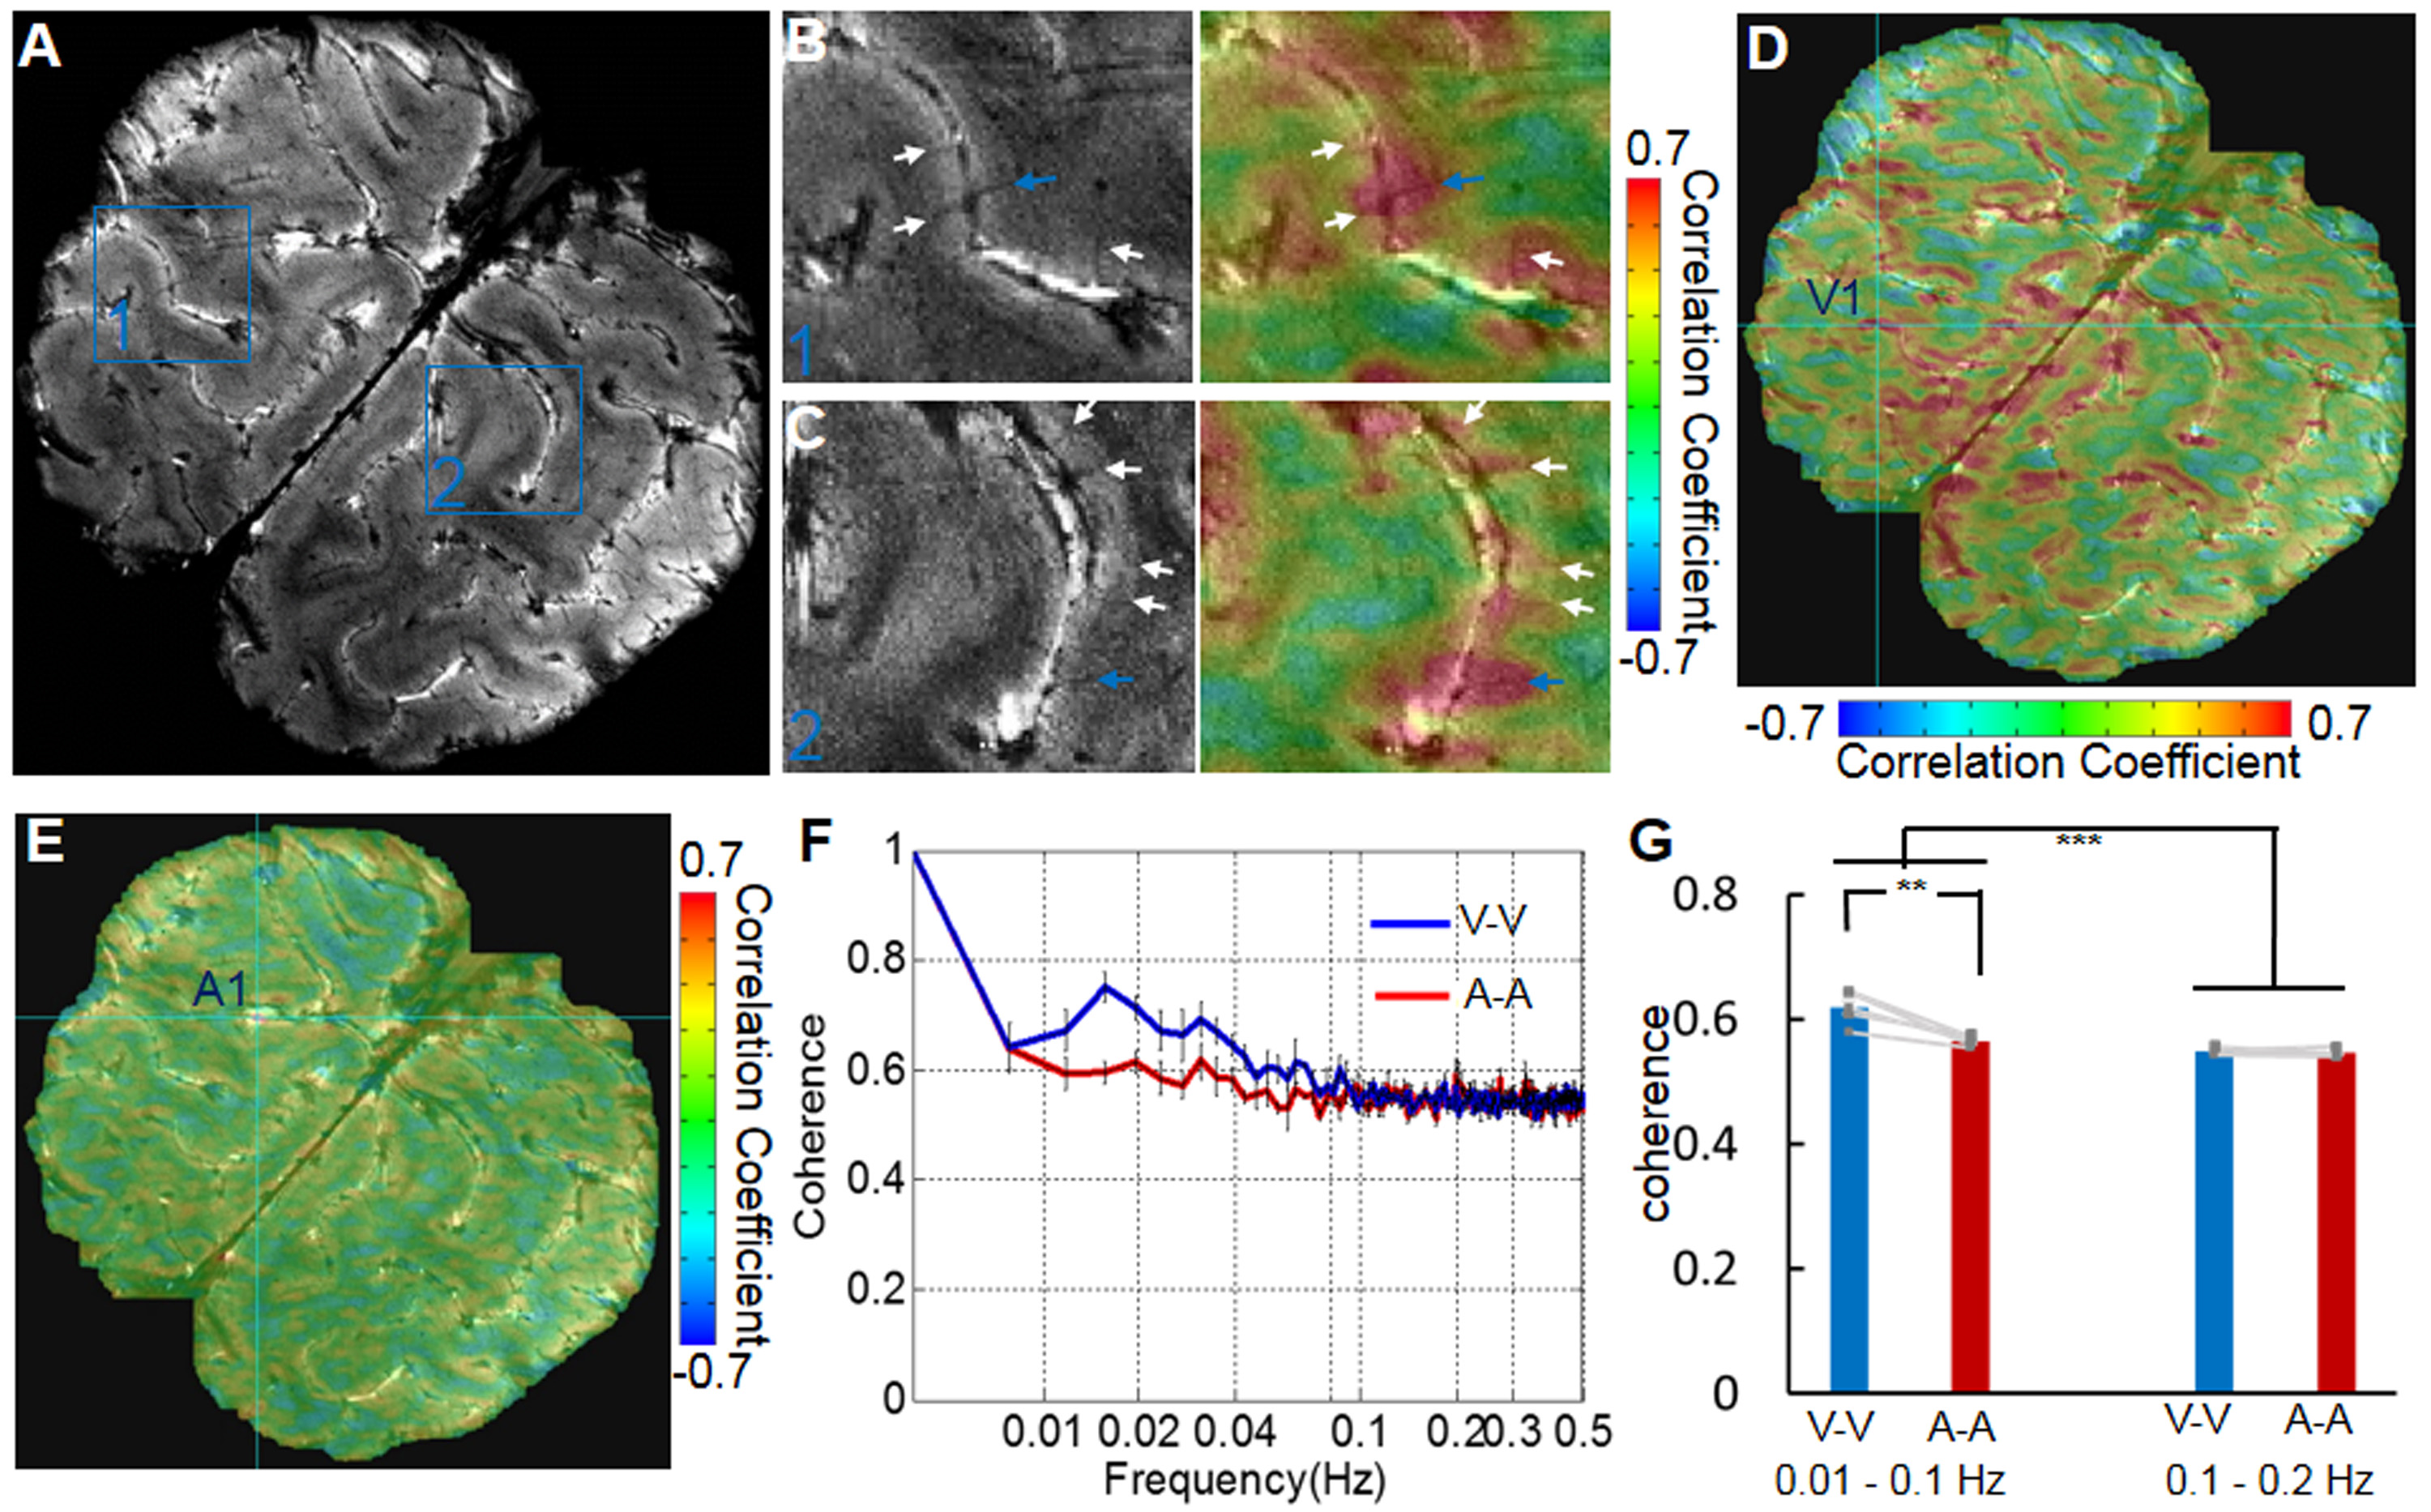
The single-vessel fMRI mapping scheme could also be implemented to characterize the vascular dynamic network connectivity in the awake human subjects. The coherence analysis of the time course from paired vein voxels exhibited coherent slow-frequency oscillation up to 0.1Hz (Fig. 3G). Using ICA analysis, the vein-specific correlation maps could be identified through the multiple slices, showing a 3D vascular dynamic correlation through the main branches of cerebrovasculature (Fig. 4G-J). To characterize the hemodynamic fluctuation in smaller vessels, we mapped the single vessel-based rs-fMRI under 9.4T with EPI-fMRI. Similarly, the seed-voxels from veins were highly correlated to the other veins, but the artery seed-voxels showed little correlation to other arteries (Fig. 5D-E). In the enlarged correlation maps, a few intracortical veins penetrating the gray matter showed strong correlations to each other along the sulcus (Fig. 5B-C). This result provides a good example to illustrate the vascular dynamic connectivity through the intracortical veins of the human cortex under 9.4T.
Conclusion
The vascular specific fMRI signal showed high coherence at slow oscillation frequency range (0.01-0.04 Hz) in anesthetic rats and in the awake human brain with broader coherence frequency range (0.01-0.1 Hz), which is consistent with the frequency oscillation range reported by the conventional resting state fMRI methods. These results, in concert with other work demonstrating that vascular dynamic connectivity is associated with neural activity(abstract ID: 3137), suggest an emerging model linking neural to hemodynamic maps of resting state connectivity through low frequency oscillations under vasomotor control.Acknowledgements
This research was supported by the internal funding from Max Planck Society.References
1. Yu, X., He, Y., Wang, M.S., Merkle, H., Dodd, S.J., Silva, A.C., Koretsky, A.P. Sensory and optogenetically driven single-vessel fMRI. Nat Methods. 2016; 13: 337-340.Figures