0458
Mapping and characterization of positive and negative BOLD responses to visual stimulation in multiple regions across the brain at 7T1Laboratory for Functional and Metabolic Imaging, École Polytechnique Fédérale de Lausanne, Lausanne, Switzerland, 2ISR-Lisboa/LARSyS and Department of Bioengineering, Instituto Superior Técnico, Universidade de Lisboa, Lisbon, Portugal, 3Spinoza Centre for Neuroimaging, Amsterdam, Netherlands, 4Department of Radiology, University of Lausanne and University of Geneva, Lausanne, Switzerland
Synopsis
Negative BOLD responses (NBRs) have been associated with changes in neuronal activity, but are challenging to detect due to a lower contrast-to-noise ratio compared to positive BOLD responses (PBRs). In this work, the high sensitivity available at 7T was explored with accelerated fMRI acquisition, vein segmentation and ICA denoising techniques, to map PBRs and NBRs to visual stimulation in various brain regions beyond the visual cortex. Multiple regions with significant PBRs and NBRs could be detected, and their dependence on stimulus duration was found to differ significantly across regions, suggesting the presence of dynamic, stimulus-dependent interactions across the brain.
Purpose
Growing evidence supports that negative BOLD responses (NBRs) are associated to relevant changes in neuronal activity,1 but their detection can be particularly challenging due to a lower contrast-to-noise ratio compared to positive BOLD responses (PBRs). Under visual stimulation, large single-subject datasets have revealed sustained NBRs in more than 50% of grey matter,2 but required acquisitions of several hours per subject. In this work, the high sensitivity available at 7T was explored with accelerated fMRI acquisition, vein segmentation and ICA denoising techniques, to map PBRs and NBRs to visual stimulation in various brain regions beyond the visual cortex, with acquisitions of only a few minutes per subject. These responses were further characterized regarding their dependence on stimulus duration, covering durations of 4 to 40s.Methods
Data acquisition: Ten healthy volunteers were scanned on a 7T MRI system (Siemens) with a 32-channel head coil (Nova Medical). Functional data were acquired using a simultaneous multi-slice (SMS) GE-EPI sequence, with TR/TE=2000/25ms, α=71°, 1.5mm isotropic resolution, 74 axial slices (2× SMS acceleration, ½ field-of-view CAIPI shift3), 2× GRAPPA acceleration and 7/8 partial Fourier. The imaging slab covered the whole brain excluding part of the cerebellum. An additional EPI volume was acquired with reversed PE direction, for subsequent EPI-distortion correction. T1-weighted anatomical data were acquired with an MP2RAGE sequence (TR/TI1/TI2/TE=5500/750/2350/1.87ms, 1mm isotropic resolution).
Paradigm: Paradigm blocks consisted of a visual stimulation period (8Hz-reversing checkerboards) followed by a fixation period. Subjects focused on a red cross shown at the center of the field-of-view at all times, and reported changes in its color via a button press. Each subject underwent a functional localizer paradigm (FLoc), for visual response mapping, and a duration-varying paradigm (FDur), for response characterization. FLoc comprised 10 blocks of 10s stimulation and 30s fixation. FDur used stimulus durations of 4,10,16,22,30 or 40s, followed by 30s fixation; each duration was employed 5 times, in randomized order.
Data analysis: Functional data underwent motion correction, brain extraction, slice-timing adjustment, spatial smoothing (2mm FWHM) and general linear model (GLM) analysis. The GLM analyses included visual paradigm regressors (boxcars convolved with HRF and temporal derivative), slow drift, motion, and additional confounds obtained with ICA (ex: physiological noise, additional motion sources). Cortical visual response mapping was performed on an average cortical surface space created with Freesurfer. First, the anatomical images were used for cortical segmentation. The FLoc β-maps were then B0-unwarped with FSL-TOPUP, coregistered to the respective anatomical space, and sampled along the cortical surface. The aligned surface β-maps of all subjects were jointly analyzed using cluster-wise inference (|Z|>1.6, cluster p<0.01, FWE-corrected with Monte Carlo simulations4), and the identified clusters were projected back to subject space. Sub-cortical ROIs were also identified, by visual inspection of cluster-thresholded FWE-corrected individual T-maps, selecting clusters that were found consistently across subjects. Finally, both cortical and sub-cortical clusters were co-registered to FDur and used as ROIs for response averaging. Venous contributions were reduced by segmenting5 and excluding vein voxels from the ROIs.
Results
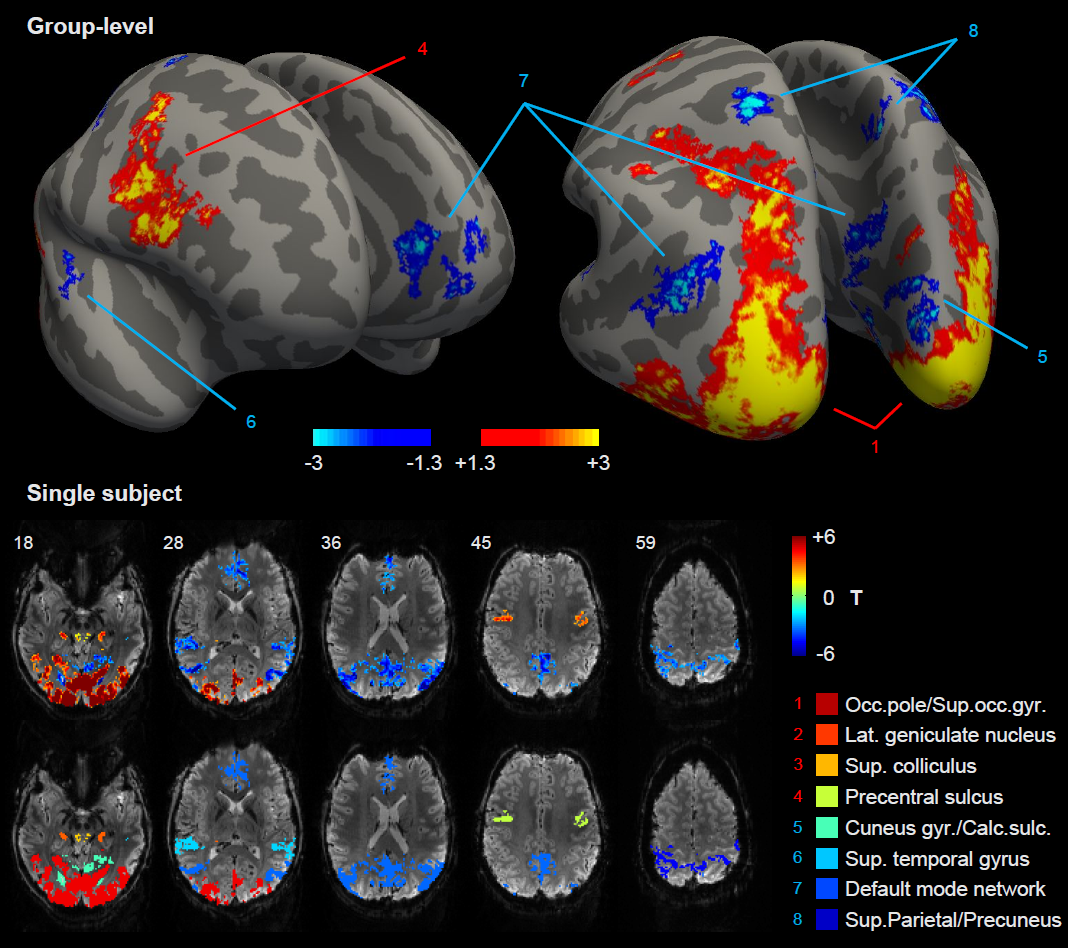
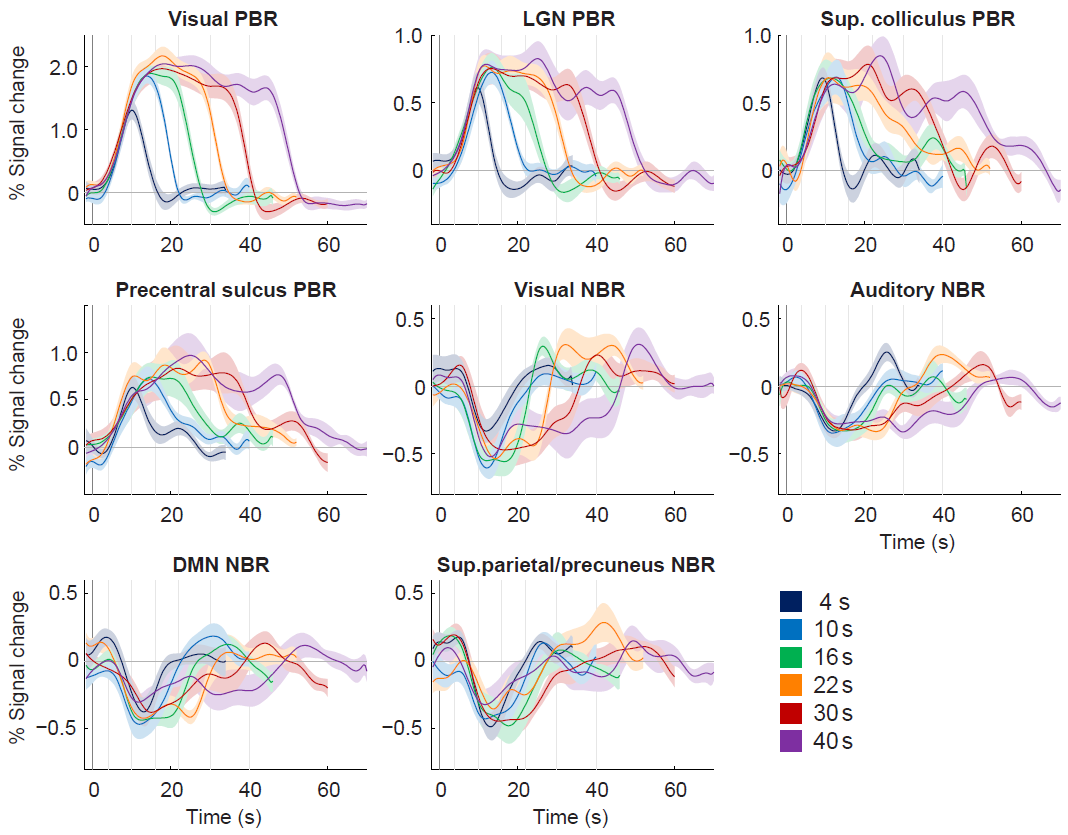
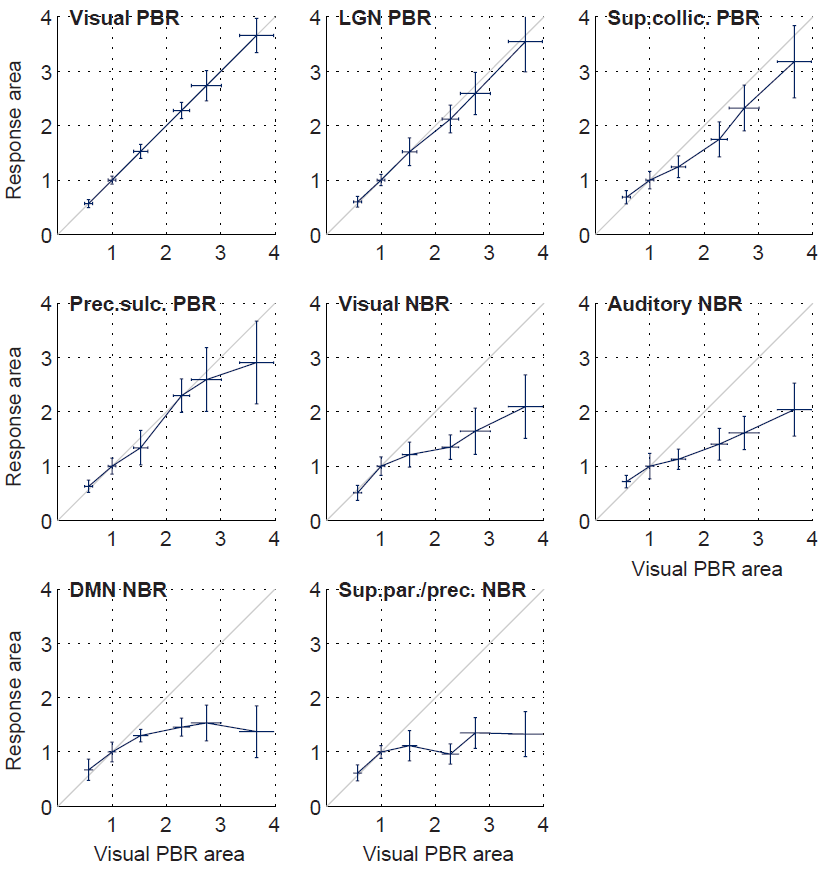
The group-level analysis revealed multiple regions with significant PBRs or NBRs to visual stimulation (Fig. 1). Positively-responding regions included the visual cortex, lateral geniculate nucleus, superior colliculus and pre-motor cortex. Negatively-responding regions included parts of the primary visual cortex, auditory cortex, regions attributed to the default mode network (DMN), and somatosensory association cortex (superior parietal/precuneus gyrus). Under varying stimulus duration (FDur), the group-average BOLD responses exhibited clear duration dependence in all ROIs (Fig. 2). Some ROIs were visibly less affected by stimulus duration than others; in particular, the DMN and sup.parietal/precuneus NBRs evinced an earlier decay to baseline than the visual PBR, especially evident for longer stimulation levels. Response duration was quantified by normalizing the response amplitude and estimating the area under the response curve for each stimulus level. Stimulus duration dependence was found statistically significant for all PBR regions and the visual and auditory NBRs (p<0.05), but not for the DMN and sup.parietal/precuneus NBRs. The response durations for each ROI were further compared to those of the visual PBR, after normalization to the value for 10s stimulation (Fig. 3). For stimuli up to 16s, no significant differences in duration were found between any ROI and the visual PBR; however, for longer stimuli, the response durations from all NBRs were found significantly lower than for the visual PBR (p<0.05).Conclusion
Ultra-high field fMRI, explored with accelerated acquisition, ICA denoising and vein segmentation techniques, can reveal multiple brain regions responding positively and negatively to visual stimulation, beyond the visual cortex. The different stimulus-dependence of different regions suggests the presence of highly dynamic interactions across the brain.Acknowledgements
This work was supported by Centre d'Imagerie BioMédicale (CIBM) of the UNIL, UNIGE, HUG, CHUV, EPFL and the Leenaards and Jeantet Foundations, the Portuguese Science Foundation (FCT) through grant PEst-OE/EEI/LA0009/2013, and ISR/LARSyS through grant UID/EEA/50009/2013.References
1. Shmuel, Augath, Oeltermann, Logothetis. Negative functional MRI response correlates with decreases in neuronal activity in monkey visual area V1. Nat Neurosc. 2006;9:569-577.
2. Gonzalez-Castillo, Hoy, Handwerker, Roopchansingh, Inati, Saad, Cox, Bandettini. Task dependence, tissue specificity, and spatial distribution of widespread activations in large single-subject functional MRI datasets at 7T. Cereb Cortex. 2015;25(12):4667-77.
3. Setsompop, Gagoski, Polimeni, Witzel, Wedeen, Wald. Blipped-controlled aliasing in parallel imaging for simultaneous multislice echo planar imaging with reduced g-factor penalty. Magn Res Med. 2012;67(5):1210-1224.
4. Hagler,
Saygin, Sereno. Smoothing and cluster thresholding for cortical surface-based
group analysis of fMRI data. Neuroimage. 2006;33(4):1093-103.
5. Frangi, Niessen, Vincken, Viergever. Multiscale vessel enhancement filtering. Medical Image Computing and Computer-Assisted Intervention. 1998;1496:130-137.
Figures