0457
Primary neurotransmitter variations upon forepaw stimulation revealed by functional Magnetic Resonance Spectroscopy in the rat1Champalimaud Neuroscience Programme, Champalimaud Centre for the Unknown, Lisbon, Portugal
Synopsis
Functional Magnetic Resonance Spectroscopy (fMRS) could potentially provide much information on neurotransmitters, and hence, could shed light into excitation / inhibition imbalances. However, it was scarcely used, in particular in rodents, presumably due to low SNR. Here, we used a cryoprobe at 9.4T to record fMRS spectra in the rat in just a few minutes. SNR>50 was documented for the N-acetylaspartate resonance. We show statistically significant increases in Glutamate and decrease in GABA upon forepaw stimulation. Our results are suggestive of differential relaxation between vesicular and synaptic neurotransmitter pools, and are promising for more detailed investigations, e.g., using optogenetics.
Purpose
Magnetic Resonance Spectroscopy (MRS) provides a wealth of information on metabolites related with bioenergetics, neurotransmission and osmolytes1. The two primary excitatory and inhibitory neurotransmitters, Glutamate (Glu) and Gamma-aminobutyric acid (GABA), respectively, can be quantified using MRS. Their dynamic detection in a task-based paradigm could potentially shed much light into excitatory-inhibitory balances in active regions2,3. However, only very few studies have performed functional-MRS (fMRS) in rodents, where powerful techniques can be used to assess ground truth or to perturb the system4,5. Previous fMRS studies mainly focused on bioenergetics-related metabolites2-12, rather than on neurotransmitters. Here, we studied variations in primary neurotransmitter signals upon a forepaw stimulation paradigm via fMRS.Methods
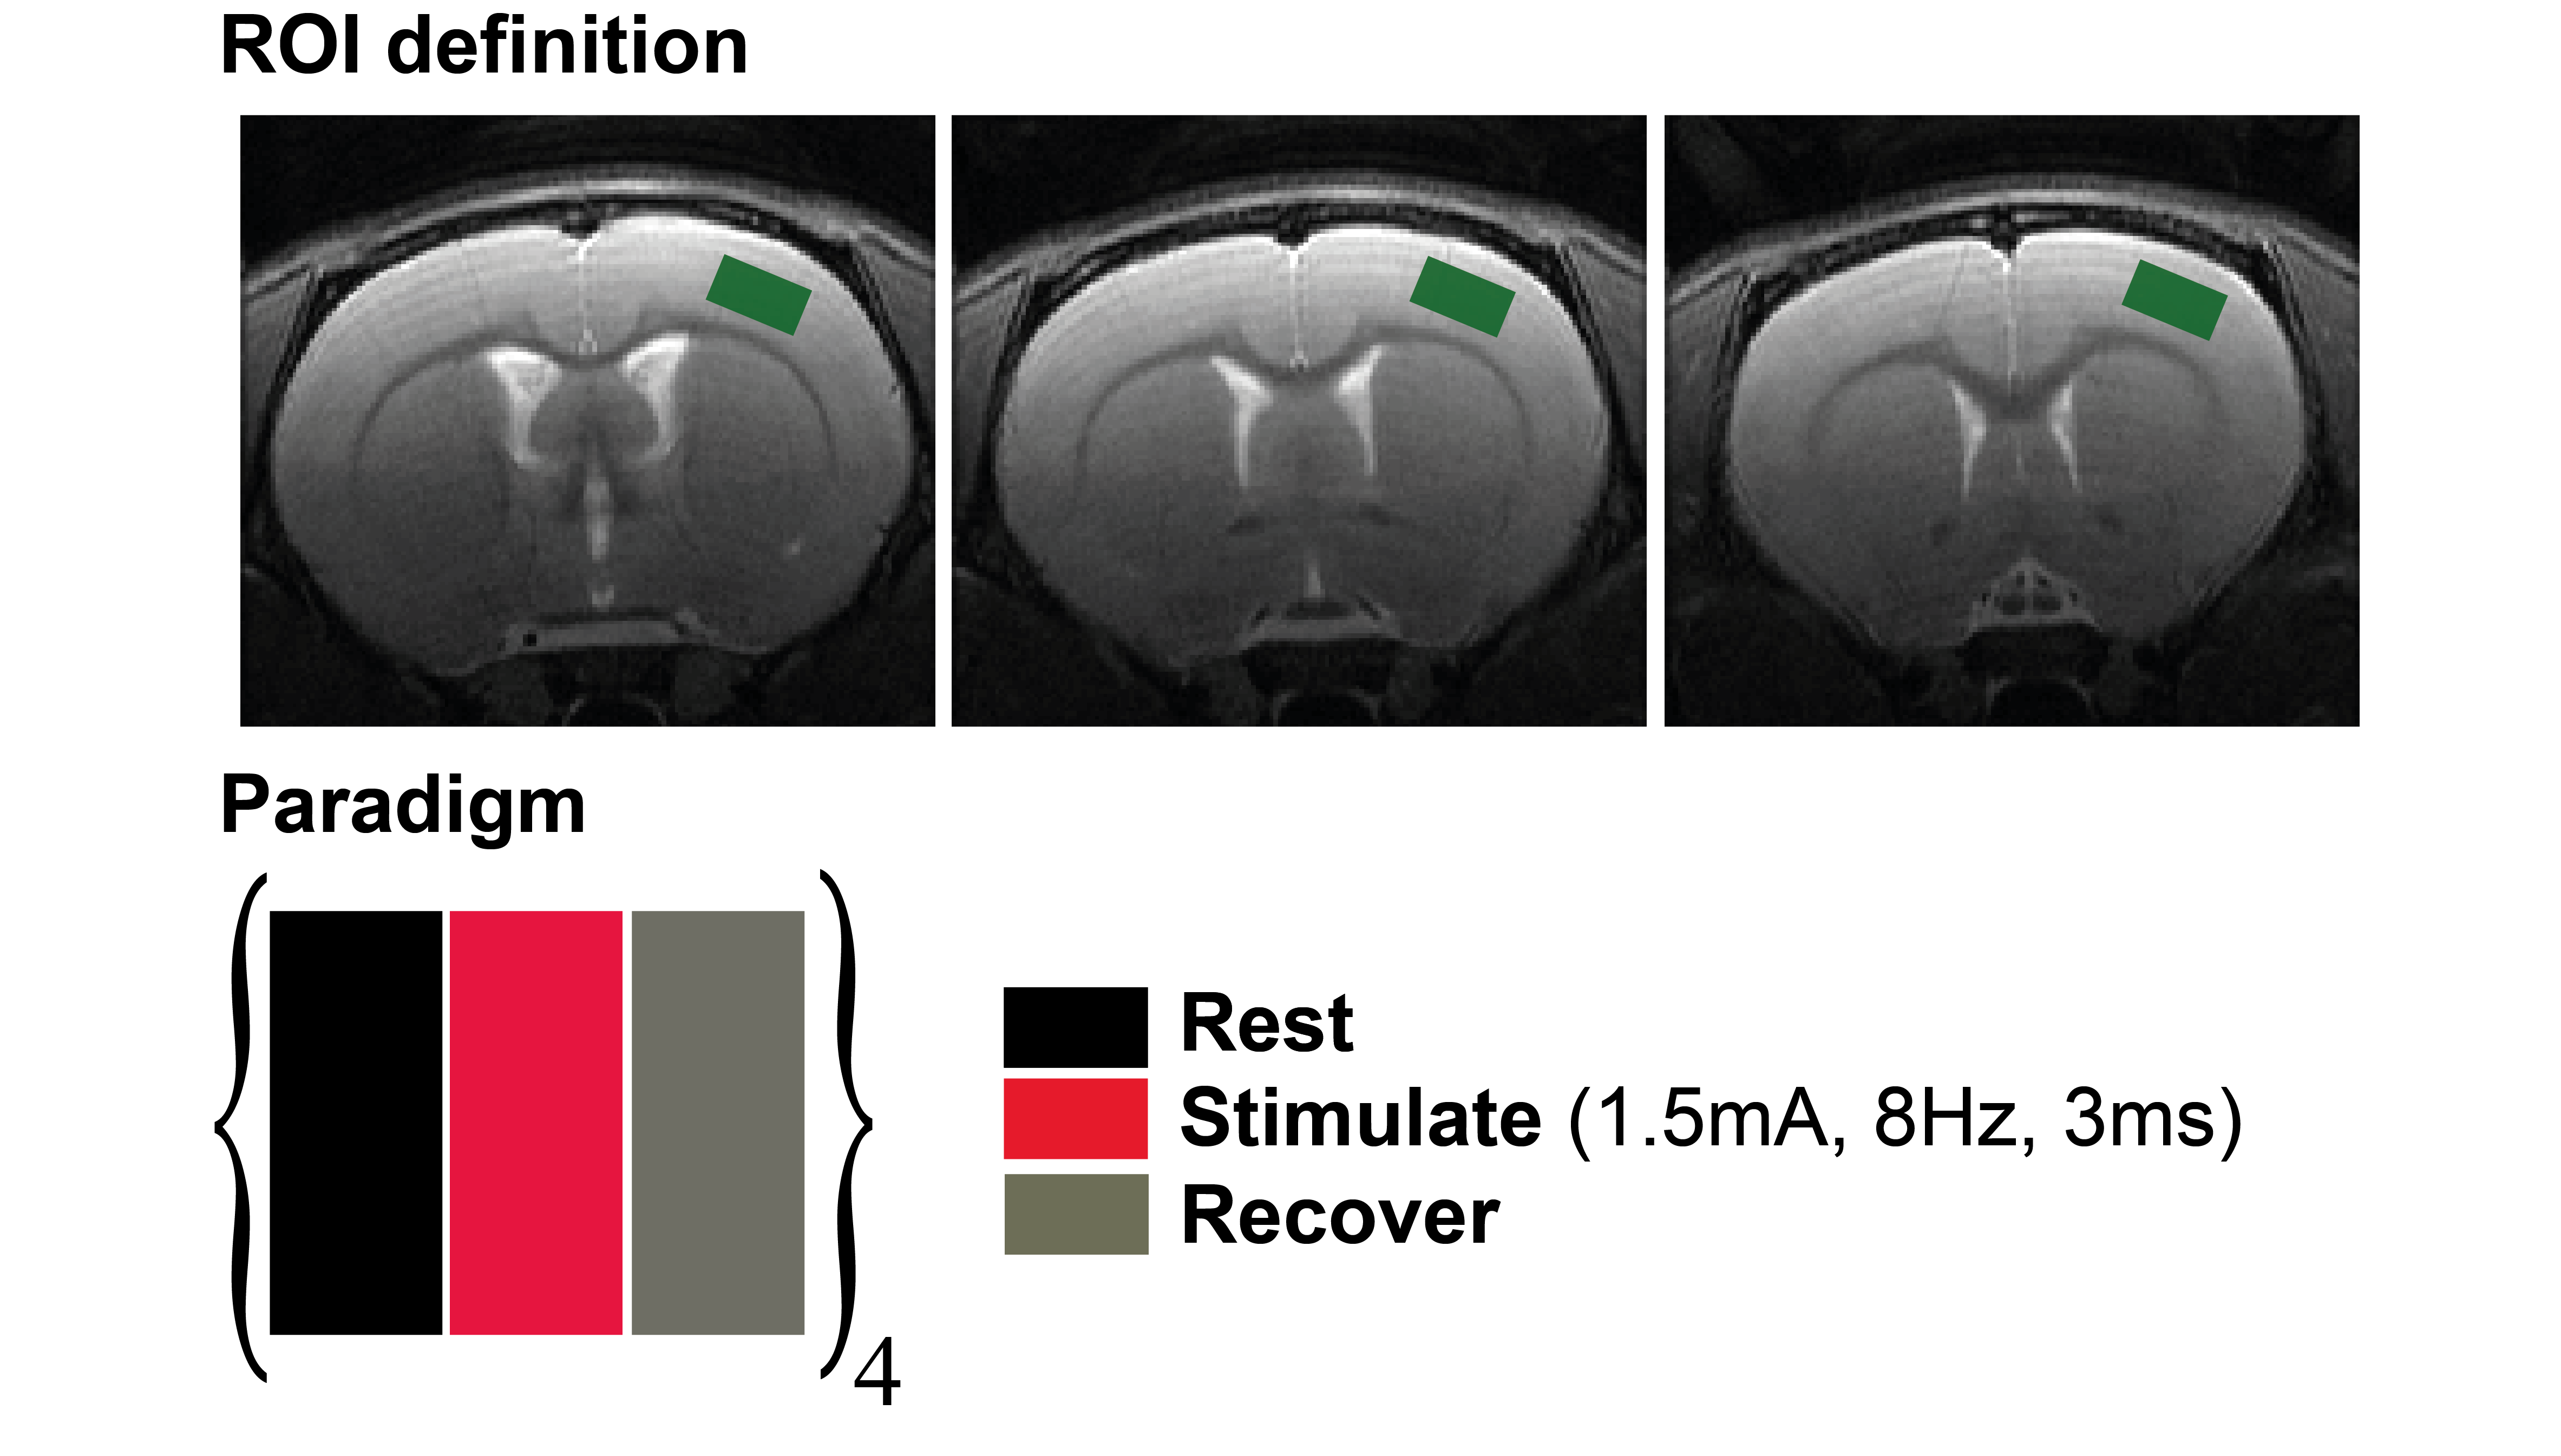
All experimental aspects were preapproved by the Institute’s Committee for Animal Ethics. A Bruker Biospec 9.4T scanner, equipped with gradients capable of producing up to 66 G/cm in every direction, was used. An 86 mm volume resonator was used for transmittance, and a 4-channel array cryoprobe was used for reception. Long-Evans rats (N=6) were anesthetized briefly with isoflurane, and two electrodes were inserted between digits 1-2 and 4-5. Isoflurane administration was discontinued following a 50 μg/kg bolus of medetomidine13 (Domitor, Pfizer). A continuous infusion of 100 μg/kg/hr medetomidine was delivered for sedation throughout the rest of the experiment. fMRS experiments were conducted using an optimized PRESS sequence with CHESS water suppression, with TR/TE=2000/35ms on a voxel spanning 2.0x1.1x3.0 (mm)3 located well within the rat’s S1/M1 region (Figure 1, upper panel). Shimming was performed automatically, resulting in FWHM<~15Hz in the voxel. The stimulation block (Figure 1, lower panel) was designed simply as a rest-stimulate-recover paradigm, each epoch lasting 5 minutes. Electrical stimulation was delivered using square pulses current with an isolated bipolar pulse stimulator (custom made in-house), delivering 1.5A for 3ms, with a 8Hz frequency. Rats were allowed to rest for an additional ~3 minutes between paradigms; the paradigm was repeated 4 times per rat. Stable animal physiology was maintained by monitoring transcutaneous CO2 levels, respiration rate, and rectal temperature throughout the experiments. Spectral analysis was performed using Tarquin software14, employed with a full basis set for the brain’s metabolites, macromolecules and lipid signals. Statistical tests for neurotransmitter levels included paired t-tests and Wilcoxon Signed Rank tests, which were performed using OriginPro 8 software (OriginLab corporation).Results
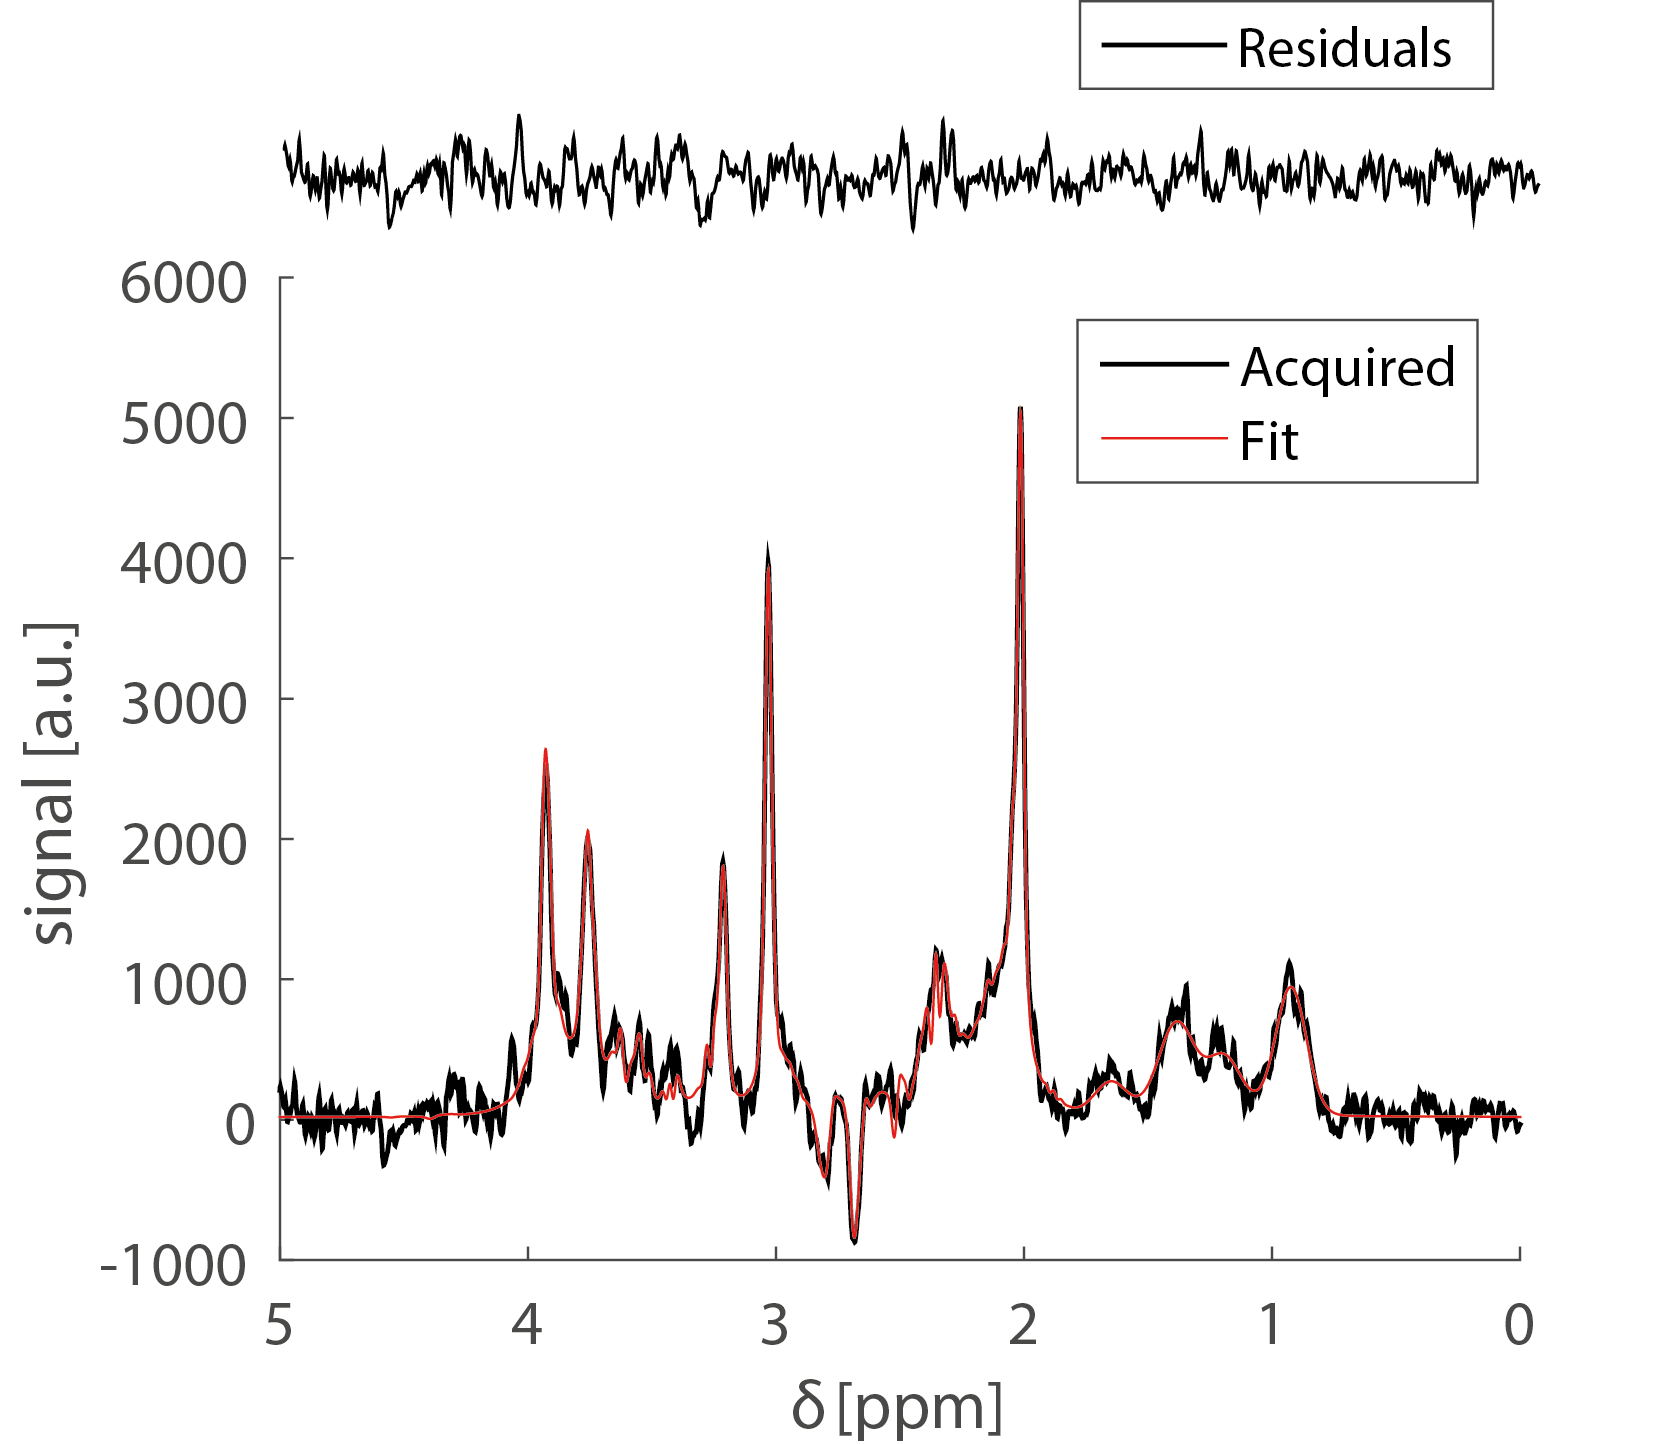
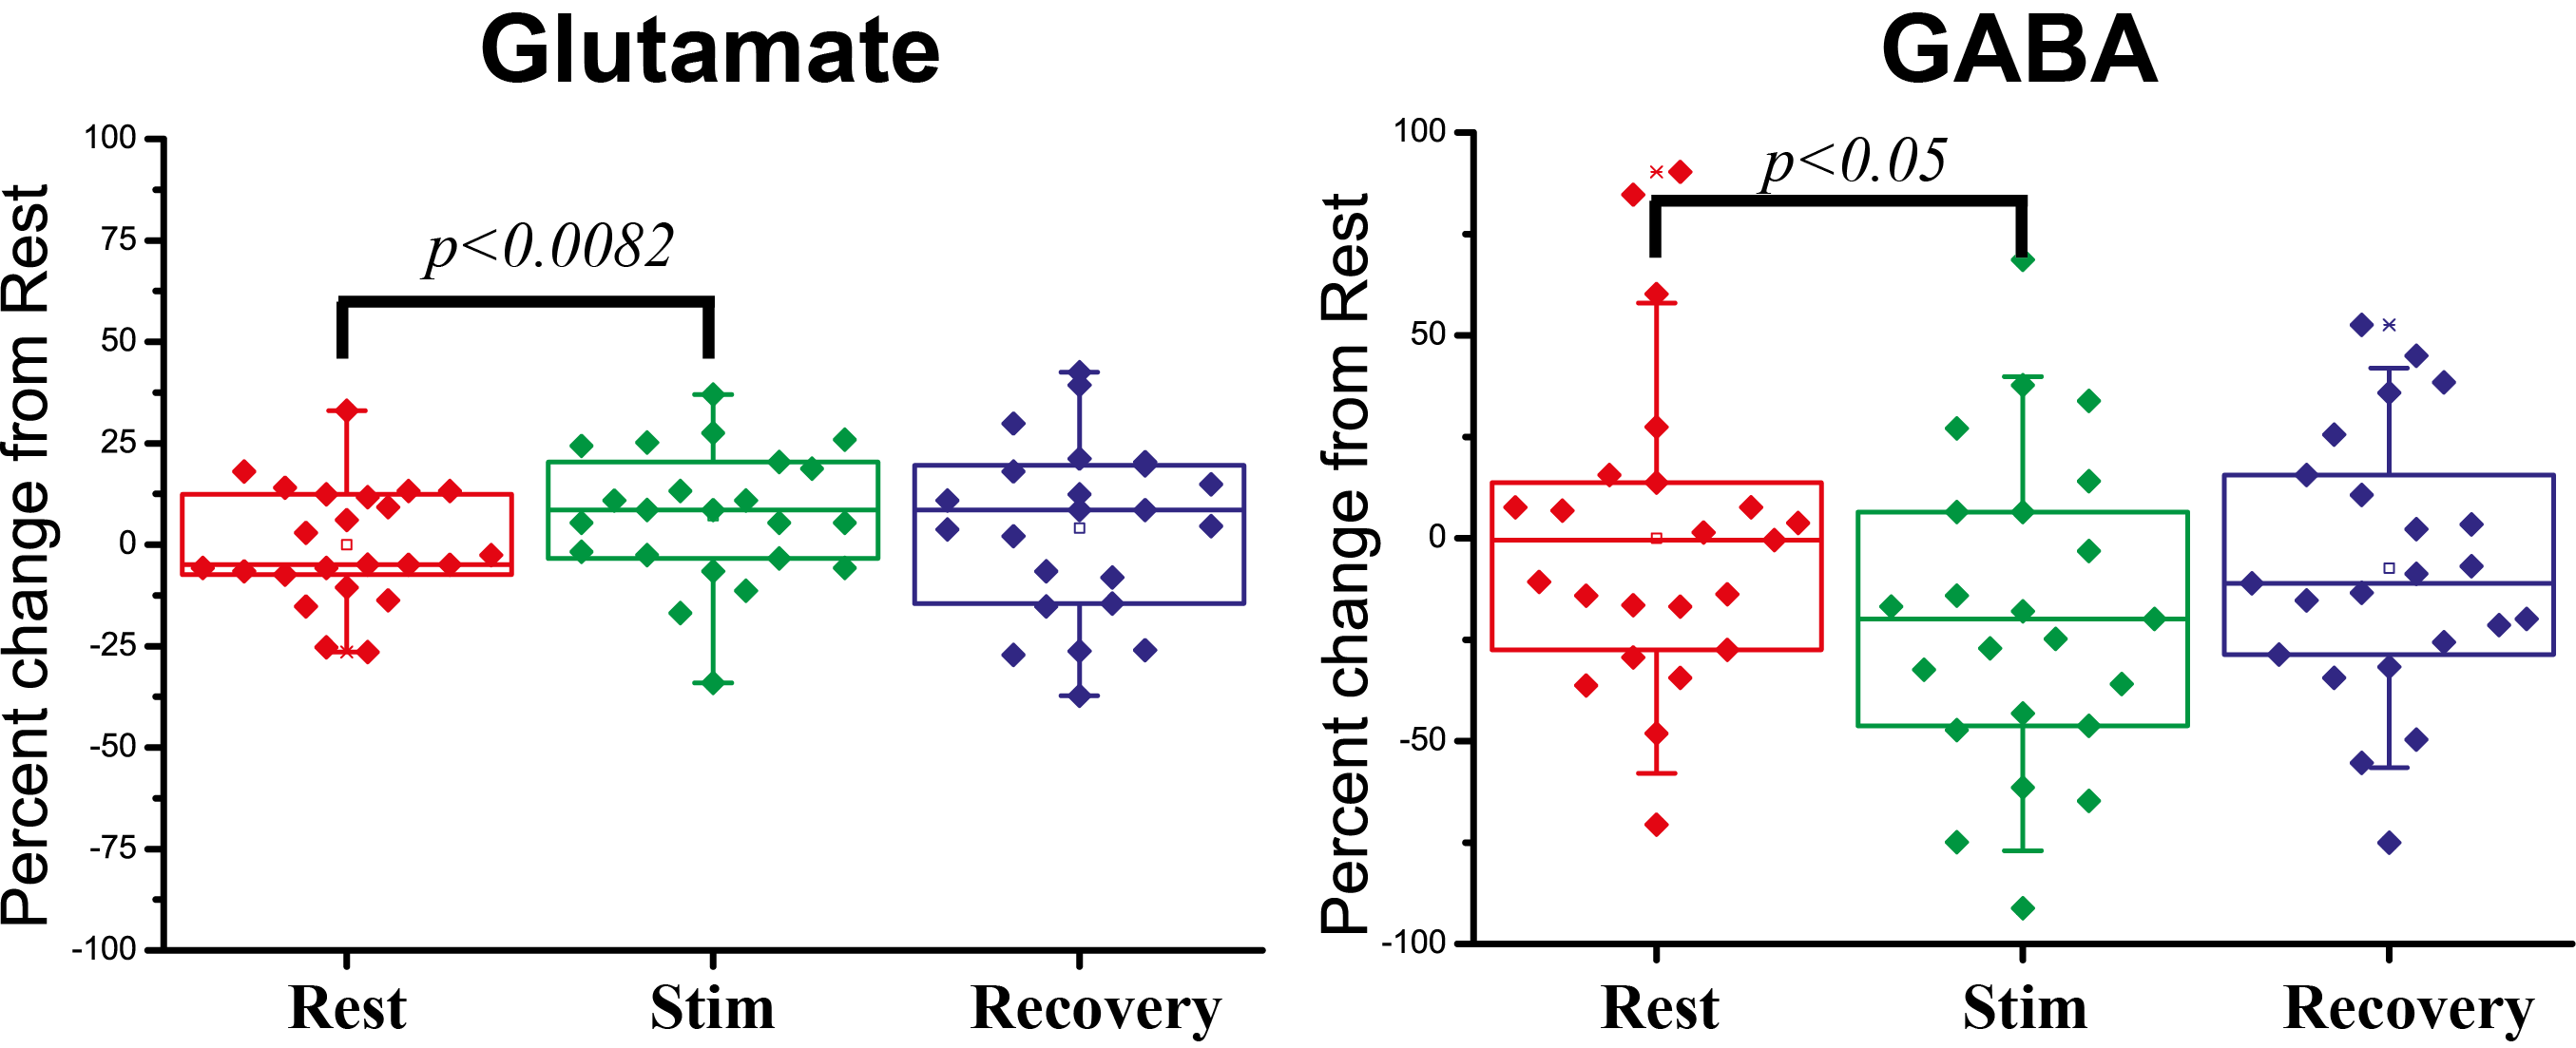
Preliminary BOLD fMRI experiments conducted in these rats showed highly significant activation in primary somatosensory cortex (not shown). Figure 2 shows a prototypical fMRS spectrum obtained from a voxel placed in the active region after 5 minutes of acquisition (black trace). Notably, the SNR of the NAA peak was higher than 50 for most experiments. The red trace shows the fitted spectra; residuals are shown above the spectrum, adumbrating the goodness of fit. Percentage changes in Glu and GABA levels from the resting condition for all n=6 rats are shown in Figure 3. When electrical stimulation was applied to the forepaw, Glutamate levels increased by 7.2±3.4 % (p<0.0082) while GABA levels decreased by 18±8 % (p<0.05). In the recovery period, Glu and GABA levels tended to renormalize, and the differences between recovery levels and rest/stimulation periods were statistically insignificant. N-Acetylaspartate, Creatine, Cholines, and Glutamine levels did not vary in a statistically significant manner.Discussion
We here demonstrated the first fMRS results in a rat forepaw stimulation paradigm – one of the most prominent activation paradigms used for fMRI. The high spectral quality at 9.4T likely stems from our use of a 4-element array cryoprobe, which provides SNR enhancements of >2 (data not shown). The relatively short (5 min) stimulation period mitigates adaptation effects while allowing for excellent SNR. Afferent thalamic inputs to the somatosensory cortex – where our voxel was placed – contact both Glutamatergic and GABAergic neurons15,16, leading to extensive release of both Glutamate and GABA from vesicles to synapses, which in turn establishes the excitatory-inhibitory balance. We have observed that upon stimulation, Glutamate levels increased by ~7%, while GABA decreased by ~18%. Though GABA and Glu partake in some bioenergetics cycles, both are eventually converted to Gln; our study did not document Gln changes (not shown), and hence it is more likely that compartment shifts between vesicular and synaptic neurotransmitter pools play key roles in the above-mentioned signal variations. The sign difference may reflect different spiking rates associated with different types of neurons; more studies, in particular using optogenetics to target specific cell populations, are required to elucidate the mechanisms underlying our observations. Nevertheless, this study provides important first clues to MRS’s potential to study excitation/inhibition in-vivo.Acknowledgements
The authors acknowledge funding from the European Research Council (ERC) under the European Union’s Horizon 2020 research and innovation programme (Starting Grant, agreement No. 679058). We thank Dr. Daniel Nunes for technical assistance.References
1. Duarte JMN et al. The neurochemical profile quantified by in vivo 1H NMR spectroscopy. Neuroimage 2012; 61: 342–362.
2. Gussew A et al. Time-resolved functional 1H MR spectroscopic detection of glutamate concentration changes in the brain during acute heat pain stimulation. Neuroimage 2010; 49: 1895–1902.
3. Lin Y et al. Investigating the metabolic changes due to visual stimulation using functional proton magnetic resonance spectroscopy at 7T. J. Cereb. Blood Flow Metab. 2012; 32: 1484–1495.
4. Just N et al. Characterization of sustained BOLD activation in the rat barrel cortex and neurochemical consequences. NeuroImage 2013; 74:343–351.
5. Schaller B et al. Are glutamate and lactate increases ubiquitous to physiological activation? A 1H functional MR spectroscopy study during motor activation in human brain at 7 Tesla. Neuroimage 2014; 93: 138–145
6. Mangia S et al. Dynamics of Lactate concentration and blood oxygen level-dependent effect in the human visual cortex during repeated identical stimuli. Neurosci. Res. 2001; 85: 3340–3346.
7. Mangia S et al. Sustained neuronal activation raises oxidative metabolism to a new steady-state level: evidence from 1H NMR spectroscopy in the human visual cortex. J. Cereb. Blood Flow Metab. 2007; 27: 1055–1063.
8. Jahng GH et al. Glutamine and glutamate complex, as measured by functional magnetic resonance spectroscopy, alters during face-name association task in patients with Mild Cognitive Impairment and Alzheimer’s disease. J. Alzheimer’s Disease 2016; 52: 145–159
9. Landim RCG et al. Investigation of NAA and NAAG dynamics underlying visual stimulation using MEGA-PRESS in a functional MRS experiment. Magn. Reson. Imaging 2016; 34: 239–245.
10. Huang Z et al. Increase in Glutamate/Glutamine concentration in the medial prefrontal cortex during mental imagery: A combined functional MRS and fMRI study. Human Brain Mapping 2015; 36: 3204–3212.
11. Branzoli F et al. Functional diffusion-weighted magnetic resonance spectroscopy of the human primary visual cortex at 7T. M.R.M 2013; 69: 303–309.
12. Ronen I, Valette J. Diffusion-weighted magnetic resonance spectroscopy. Mag. Res. 2015; 4: 733–750.
13. Pawela CP et al. A protocol for use of medetomidine anesthesia in rats for extended studies using task-induced BOLD contrast and resting-state functional connectivity. Neuroimage. 2009; 46: 1137–1147.
14. Wilson M et al. A constrained least-squares approach to the automated quantitation of In Vivo 1H magnetic resonance spectroscopy data. M.R.M. 2011; 65: 1-12.
15. Hooks BM et al. Organization of cortical and thalamic input to pyramidal neurons in mouse motor cortex. J. Neurosci. 2013; 33: 748 –760.
16. Petrof I et al. Properties of the primary somatosensory cortex projection to the primary motor cortex in the mouse. J. Neurophysiol. 2015; 113: 2400 –2407.
Figures