0456
Comparable intrinsic spatial profiles of BOLD signals and local field potentials after stimulation and in resting-state within primary somatosensory cortexZhaoyue Shi1, Ruiqi Wu1, Pai-Feng Yang1, Feng Wang1, Tung-Lin Wu 1, Arabinda Mishra1, Li Min Chen1, and John Gore1
1Vanderbilt University Institute of Imaging Science, Nashville, TN, United States
Synopsis
We directly compared the spatial extents of stimulated activations and the profiles of inter-voxel resting-state correlations between high resolution BOLD data at 9.4T and local field potentials (LFPs) using 98-channel microelectrode arrays, in functionally distinct somatosensory areas 3b and 1 in monkeys. We found the point spread functions of BOLD and LFP responses were comparable (~1mm) in the stimulus condition, and were more spatially constrained than correlations at rest. Our results showed spatial agreement of resting-state functional connectivity between BOLD and LFP and demonstrated that BOLD responses were as focal as underlying electrical activity.
INTRODUCTION
BOLD signals reflect hemodynamic changes, and so are considered indirect indicators of neuronal activity. The measured extent of BOLD activations depends on the integrated contributions from the intrinsic spatial distribution of the neural activity involved, the effects of converting neural electrical activity to a spatial distribution of metabolic and hemodynamic changes that then affect MRI signals, and the effects of image acquisitions and reconstruction with limited resolution, and previous work has not adequately demonstrated what the relative contributions of these effects are in practice. Proper interpretations of fMRI studies rely on understanding the precise relationships between BOLD signal changes and their corresponding electrophysiological signatures. It is unknown to what extent BOLD signals correlate spatially with underlying neuronal activity, and the spatial relationships between stimulus-evoked BOLD signal changes and intrinsic resting-state functional connectivity of BOLD. To address these questions, we directly compared the spatial extents of stimulated activations and the profiles of inter-voxel resting-state correlations, between high resolution BOLD at 9.4T and local field potentials (LFPs) using two 49-channel microelectrode arrays, in functionally distinct somatosensory areas 3b and 1 in monkeys. We found the spatial profiles of BOLD and LFP were comparable, and the resting-state functional connectivity of BOLD was in agreement with that of LFP. Moreover, the BOLD responses at 9.4T were as focal as the measured underlying LFPs.METHODS
FMRI: Stimulus-evoked (8 Hz vibrotactile stimulation of single digits) and resting state BOLD fMRI data (with 0.274 x 0.274 x 2mm3 resolution) were obtained from primary somatosensory areas 3b and 1 using a 9.4T MRI system and multi-shot echo-planar acquisitions. We estimated the spatial profiles of single digit BOLD response fields by computing the full width at half maximum (FWHM) of the fitted Gaussian point spread function (PSF). We also investigated the spatial extents of inter-areal (between areas 3b and 1) functional connectivity of resting-state fMRI signals. Electrophysiology: Two 7x7 multi-channel microelectrode arrays (98 channels in total, 400μm electrode spacing), were used to map spontaneous signal fluctuations in LFPs at rest and in response to 8 Hz vibrotactile stimulation of single digits in somatosensory areas 3b and 1 in anesthetized squirrel monkeys. We examined the spatial profiles of single digit LFP response fields by quantifying the signal power change and computing FWHMs. We estimated the spatial extents of inter-areal (between area 3b and area 1) functional connectivity by analyzing coherence characteristics of the spontaneous LFP signals at rest.RESULTS
The variation in activation centers for repeated measurements by BOLD was less than 0.25 mm and was smaller for LFPs (~0.10mm), which were close to the BOLD in-plane resolution and smaller than the electrodes spacing, respectively. Activation maps of both modalities were co-registered within 0.10 mm accuracy. Figure 1 showed that in both modalities, the PSF of area 3b was more restricted along the medial-lateral direction, and stimulus responses in area 1 were less focal than those in area 3b. Figure 2 illustrated that in both modalities, the spatial extents of inter-voxel resting-state functional connectivity profiles were slightly wider than those of stimulated responses. There were no significant differences in PSF between LFP and very high resolution BOLD fMRI at 9.4T in both stimulus-evoked and resting-state conditions, and the resting-state functional connectivity of BOLD was in agreement with that of LFP.DISCUSSION
Our results showed that the variation in activation centers for repeated measurements by BOLD and LFP was smaller than one voxel within each modality, and the separation of activation centers between modalities was very similar, indicating the stability and reproducibility of stimulus activation locations within and across two modalities. The PSFs of BOLD and LFP responses under stimulus conditions were around 1 mm, in which stimulus responses in area 3b were more focal in the medial-lateral direction than those in area 1. The PSFs of both BOLD and LFP correlation profiles in a resting-state condition were slightly wider than those of stimulus activations. Finally, we found the spatial agreement of resting-state functional connectivity between BOLD and LFP, and there were no significant differences in the dimensions of PSFs between two modalities. The strong similarities of spatial extents between BOLD and LFP are consistent with findings regarding the contribution of LFP activity to the fMRI signal1, suggesting that BOLD fMRI at high resolution and high field faithfully reflects the underlying neuronal activity.CONCLUSION
BOLD fMRI at high resolution and high field spatially faithfully reflects the underlying neuronal activity, which provides a viable tool for the investigation of cortical micro-organization at the meso-scopic modular level.Acknowledgements
This work was supported by NIH grants NS078680 (JCG) and NS069909 (LMC). The authors gratefully acknowledge Fuxue Xin and George Wilson 3rd for the assistance with data collection and Chaohui Tang for the animal preparation.References
1. Logothetis N.K., Pauls J., Augath M., Trinath T., Oeltermann A. Neurophysiological investigation of the basis of the fMRI signal. Nature 2001; 412: 150–157.Figures
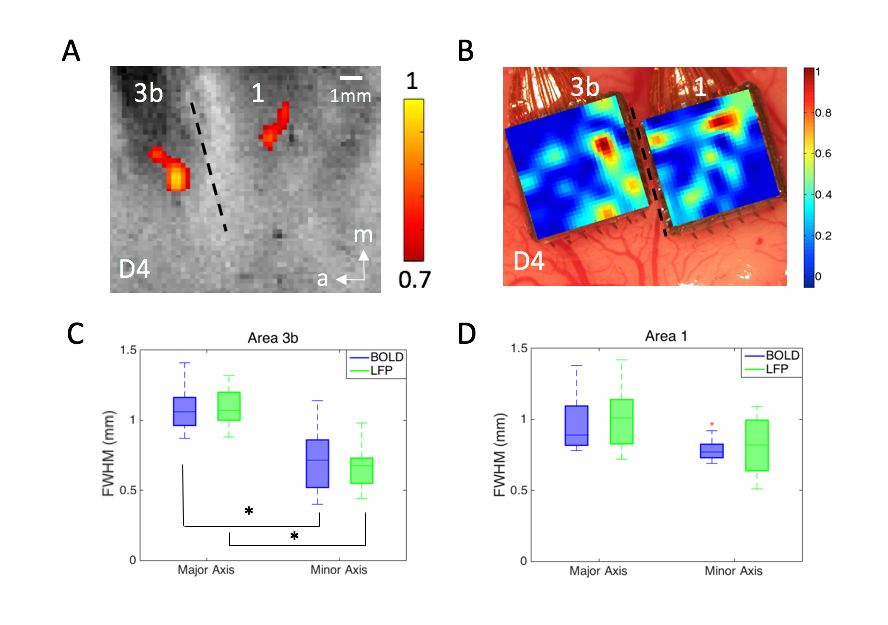
Figure 1. (A) BOLD activations in
response to vibrotactile stimulation of digit 4 in areas 3b and 1. Dotted line
represents estimated inter-areal border between areas 3b and 1. (B)
Corresponding LFP activation map in response to identical stimulation used in
fMRI experiment shown in A. (C-D) Boxplots of measures (C: FWHM of area 3b; D:
FWHM of area 1) for quantifying the PSFs of BOLD and LFP signals at the group
level in areas 3b and 1, respectively. * p<0.001 (Wilcoxon signed-rank
test).
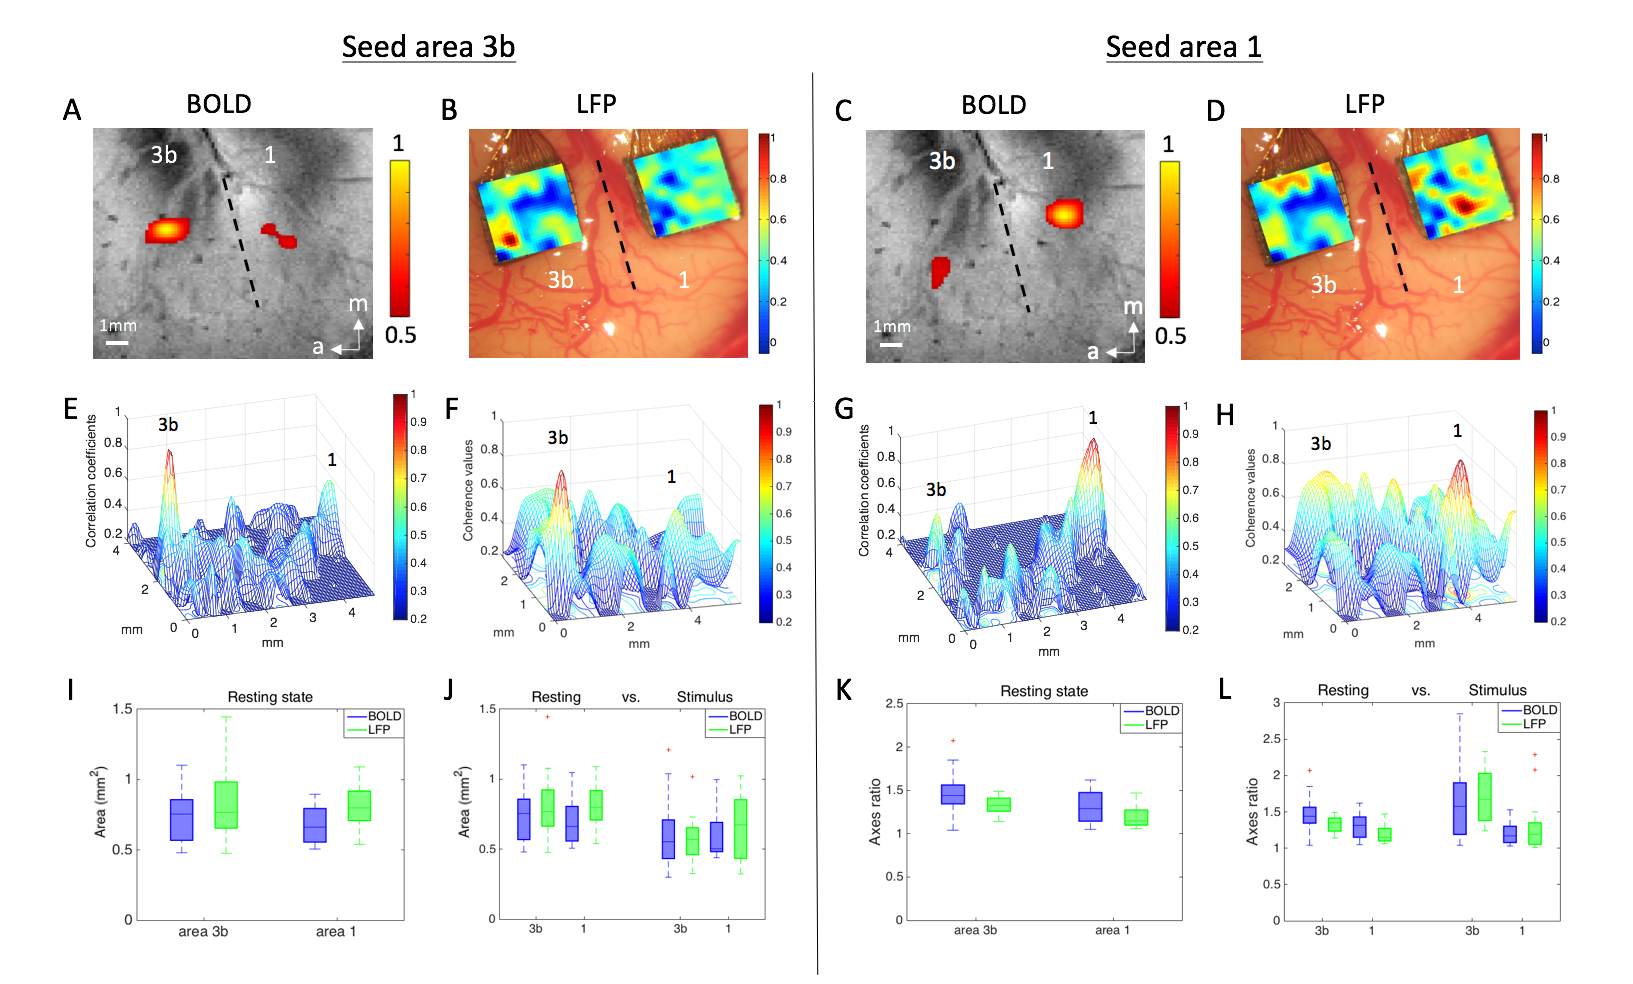
Figure 2. (A) BOLD resting-state functional connectivity map. Seed
voxel was placed in area 3b for voxel-wise correlation analysis. (B) LFP resting-state
correlation map of area 3b seed. (C) BOLD correlation map of area 1 seed. (D)
LFP correlation map of area 1 seed. (E-H) 3D plots of functional connectivity
shown is (A-D). (I) The area values of 3b and 1 at rest. (J) The area values of
3b and 1 in both conditions. (K) The major and minor axes ratio of 3b and 1 at
rest. (L) The axes ratio of 3b and 1 in both conditions.