0452
Simultaneous T1/T2 measurements in combination with PCA-SENSE reconstruction (T1* shuffling) and multicomponent analysis1Magnetic Resonance and X-ray Imaging, Fraunhofer Development Center X-ray Technology (EZRT), Würzburg, Germany, 2Experimental Physics 5, University of Würzburg, Würzburg, Germany
Synopsis
An inversion recovery TrueFISP sequence with a golden angle based radial readout in combination with a view sharing KWIC filter reconstruction is able to produce quantitative M0, T1 and T2 maps within a single shot. However the KWIC filter leads to temporal blurring especially at high spatial frequencies. Here, we propose an alternative reconstruction method based on the principle component analysis (PCA) for providing an improved temporal fidelity. Furthermore this approach is extended for a multicomponent analysis by an inverse Laplace transform. Results from brain measurements demonstrate that this technique can identify different tissue types within a single voxel.
Purpose
A bssfp-sequence (a.k.a. TrueFISP) is a fast acquisition technique with high SNR that allows quantitative parameter mapping of M0, T1 and T2 simultaneously.1 An inversion recovery (IR) TrueFISP sequence with a golden-angle-based radial readout in combination with a view sharing KWIC filter reconstruction is able to produce these maps within a single shot.2 However the KWIC filter leads to temporal blurring especially at high spatial frequencies. Here we propose an alternative reconstruction method analogous to the T2 shuffling approach3 for providing an improved temporal fidelity. Furthermore this approach is extended for a multicomponent analysis of single voxel-elements by an inverse Laplace transform.Methods
In vivo experiments were performed on healthy volunteers using a 3.0-T MRI system (Magnetom Skyra, Siemens Healthcare, Erlangen, Germany) with a 20-channel phased array head coil system. IR TrueFISP measurements were performed with the following parameters: TR = 4.6 ms, flip angle = 40°, number of readouts = 256, field-of-view = 230 x 230 mm2, slice thickness = 5 mm, total number of projections = 1500, projection angle increment: 68.75°, total experiment time = 6.9 s.
The signal course starts at the negative equilibrium magnetization M0 and exponentially approaches the steady state magnetization M0* with the relaxation time T1* = f(T1, T2, flip angle). Because of this smooth behaviour, a wide range of possible signal curves can be represented with only 5 temporal basis functions (see Fig. 1). Therefore, a PCA based reconstruction as described by Tamir et al. is appropriate in this case. To reduce computational complexity the radial data is first gridded onto a Cartesian grid using GROG4 and the coil maps are calculated from the final 377 projections. For each reconstructed time frame 5 projections were combined yielding in total 300 images per measurement. The reconstruction then is done with an operator based method as proposed in 3:
Forward model: $$$ out = P(T(FH(S(in)))); $$$
Backward model: $$$ out = SH(F(TH(P(in)))); $$$
where F/FH are the Fourier transform operators, S/SH the coil sensitivity operators, P the pattern masking operator and T/TH the temporal projection operators respectively in the considered direction (forward/backward).
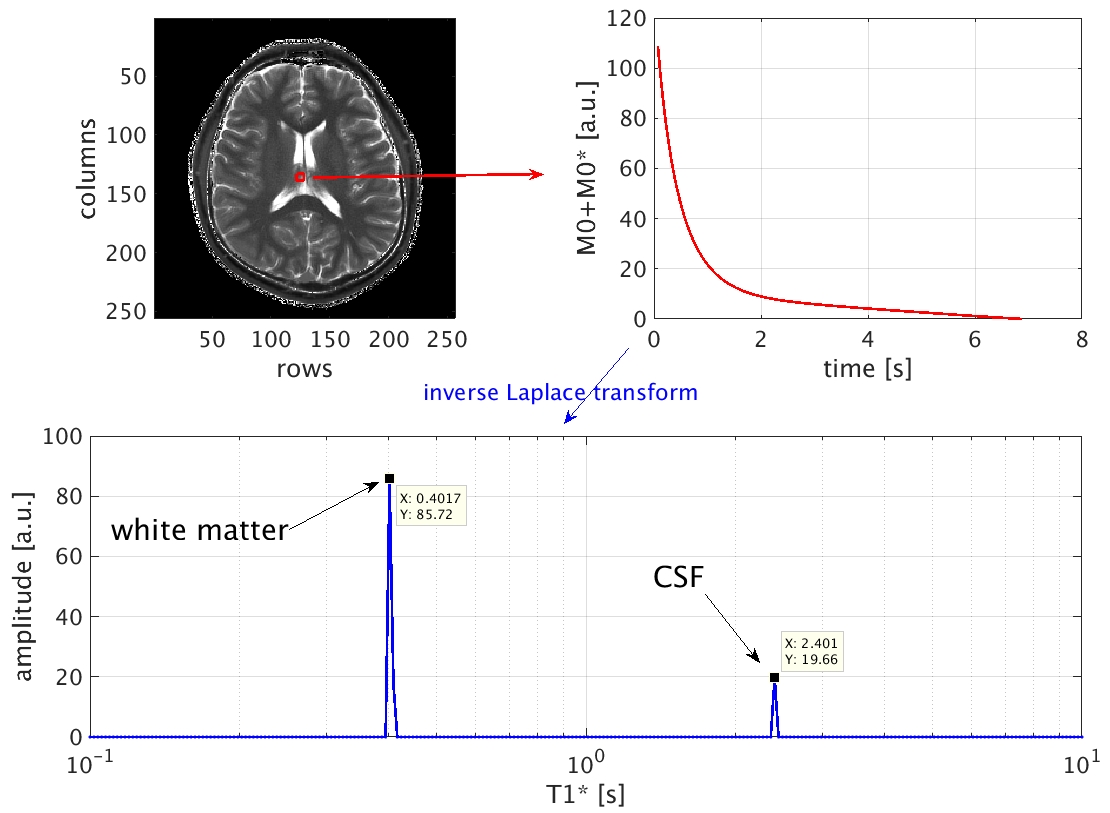
In contrast to the use of an alternating direction method of multipliers (ADMM) as in the original T2 shuffling, the conjugate gradient solver „lsqr“ from MATLAB (R2016b, The Mathworks, Natick, MA) was applied without the locally low rank regularization functional. The number of iterations of the algorithm was limited to 15. After reconstruction of the 300 time frames, T1 and T2 maps were generated according to Schmitt et al. Additionally, multicomponent analysis was performed using the inverse Laplace transform.5,6 To that end, the signal course is rearranged (i.e. a subtraction of M0* and a flip along the time-axis) to obtain a multi-exponential signal decay that converges to zero. The final result represents the T1* distribution (T1* spectrum).
Results
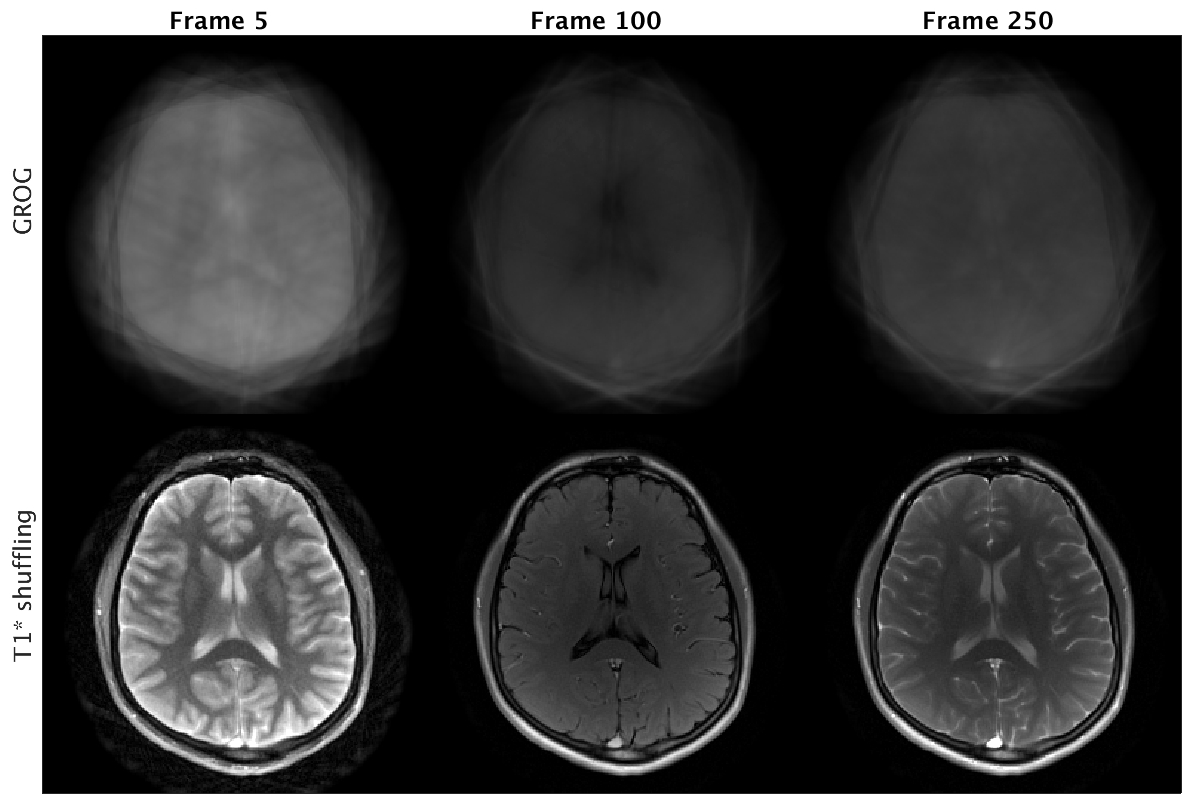
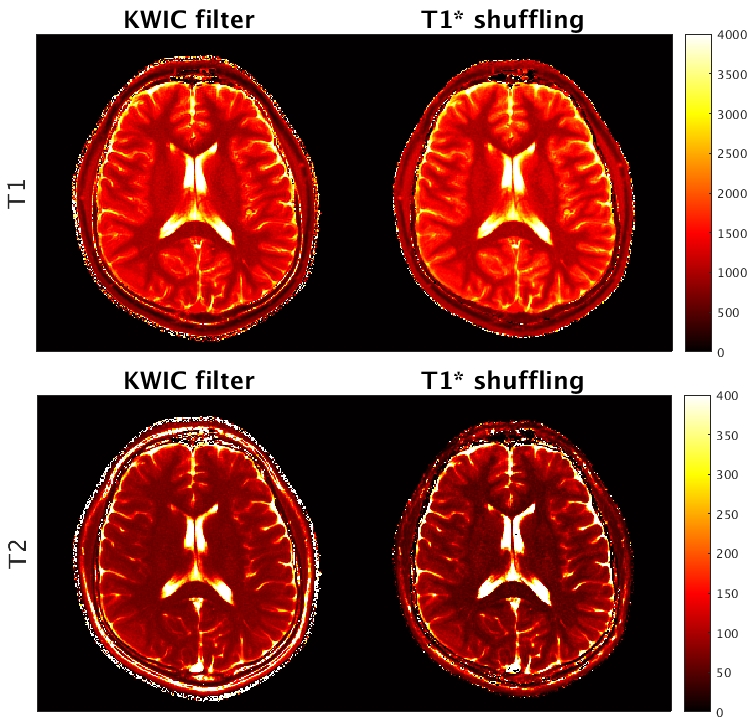
Exemplary reconstructed time frames are presented in Fig. 2 and compared with the corresponding undersampled (GROGged) images. The T1 and T2 maps obtained with T1* shuffling reveal a sharper distinction between gray and white matter in contrast to the standard KWIC filter approach (see Fig. 3). This is especially visible in the T2 maps and can be attributed to the improved temporal fidelity of the reconstruction. The inverse Laplace transform of the signal course within a voxel of interest allows the identification of multiple species. For example, the T1* spectrum in Fig. 4 shows two distinct peaks originating from white matter (T1* = 401.7 ms) and cerebrospinal fluid (CSF) (T1* = 2401 ms).Conclusion
The proposed PCA based reconstruction method shows an improved temporal fidelity of the reconstructed time frames of IR TrueFISP measurements. Compared to the standard KWIC filter approach, the blurring of fine details is strongly reduced in the quantitative T1 and T2 maps. In contrast to MR fingerprinting7, the smooth signal course can be used for a multicomponent analysis in a straight forward manner by the established inverse Laplace transform.Acknowledgements
We would like to thank Jonathan I. Tamir for providing the MATLAB-Code and all the examples from his T2 shuffling experiments.References
1. Schmitt P. et al.: Inversion Recovery TrueFISP: Quantification of T1, T2, and Spin Density. Magn Reson Med. 2004; 51:661–667.
2. Ehses P. et al.: IR TrueFISP With a Golden-Ratio-Based Radial Readout: Fast Quantification of T1, T2, and Proton Density. Magn Reson Med. 2013; 69:71-81.
3. Tamir J.I. et al.: T2 Shuffling: Sharp, Multicontrast, Volumetric Fast Spin-Echo Imaging. Magn Reson Med. 2016 (early view).
4. Seiberlich N. et al.: Non-Cartesian Data Reconstruction Using GRAPPA Operator Gridding (GROG). Magn Reson Med. 2007; 58:1257-1265.
5. Hargreaves B.A. and Nishimura D.G.: Relaxometry using Transient Steady-State Free Precession Imaging. Proc. ISMRM 2003.
6. Kroeker M. and Henkelmann R.: Analysis of Biological NMR Relaxation Data with Continuous Distributions of Relaxation Times. J Magn Reson Imaging. 1986; 69,2 18-235.
7. Dan Ma et al.: Magnetic resonance fingerprinting. Nature 2013; 61(7):1025-1029.
Figures
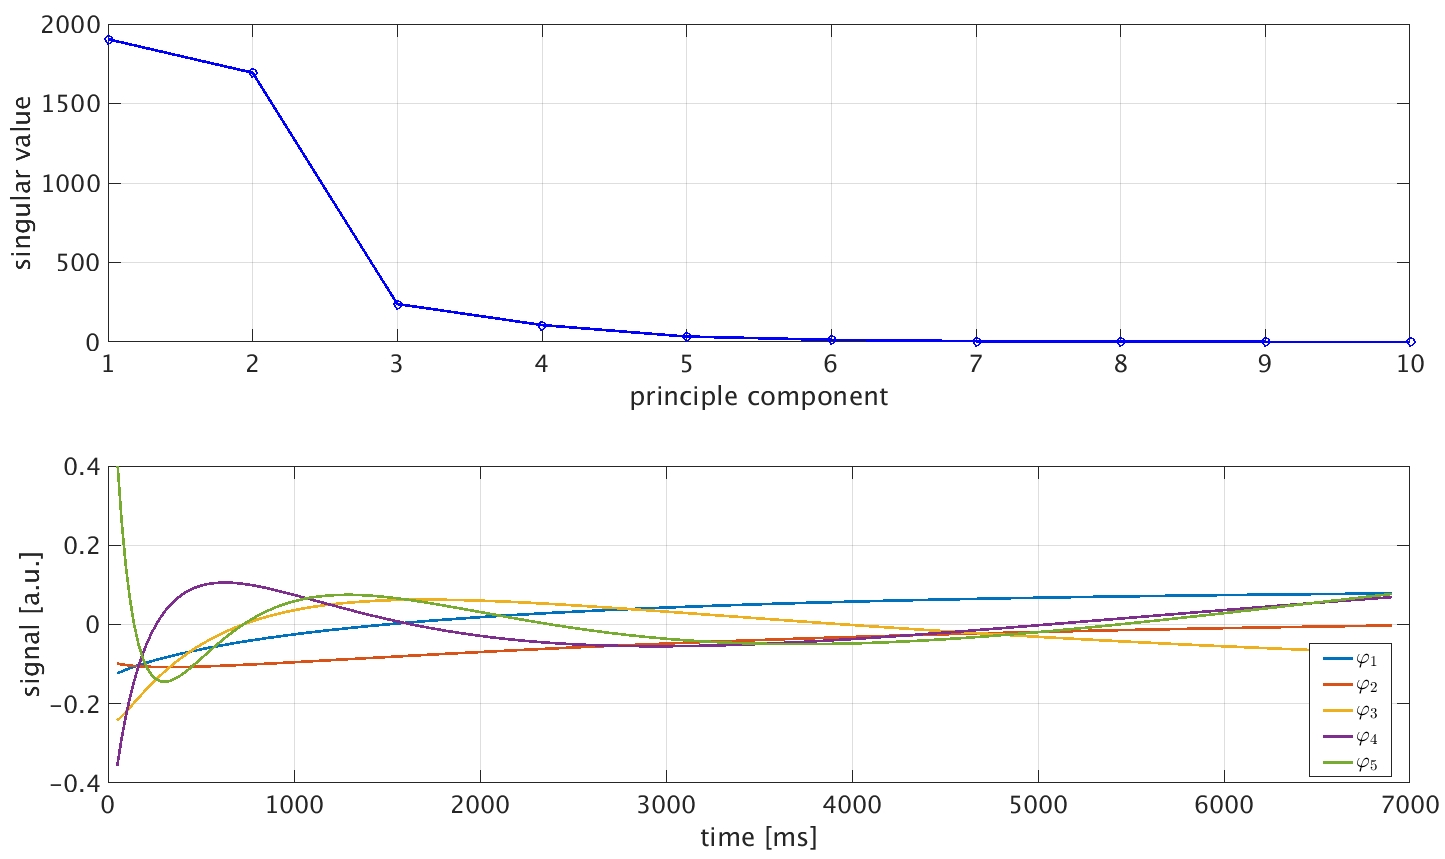
Fig. 1: First 10 singular values (top) and 5 temporal basis functions obtained from 100000 simulated IR TrueFISP signal curves (bottom).