0446
Highly Accelerated Magnetic Resonance Elastography via Bayesian Modeling1Electrical and Computer Engineering, The Ohio State University, Columbus, OH, United States, 2Radiology, The Ohio State University Wexner Medical Center, Columbus, OH, United States
Synopsis
While magnetic resonance elastography (MRE) provides a non-invasive method of estimating tissue stiffness, which is indicative of a variety of diseases, MRE scans typically require lengthy breath-holds which are prohibitive for many patients. We have extended a recently proposed Bayesian imaging method, called ReVEAL, for MRE. This method is capable of reconstructing images from highly undersampled data by leveraging both sparsity and the near equal magnitude across multiple offsets, inherent to MRE acquisition, as reconstruction constraints. This reconstruction method is validated against SENSE using a retrospectively downsampled phantom dataset and three retrospectively downsampled in vivo liver datasets.
Purpose
Alterations in tissue stiffness can serve as an indicator of various types of disease, including hepatic fibrosis.1 Magnetic resonance elastography (MRE) is a non-invasive technique which provides a quantitative estimate of soft-tissue stiffness. However, prohibitively long scan times reduce the feasibility of MRE in clinical applications. We adapt a recently proposed Bayesian imaging method for MRE to significantly reduce acquisition time.Methods
Traditional compressed sensing (CS) based reconstruction techniques leverage the sparsity of MR images under certain linear transformations, such as Wavelet transforms, to recover MR data which has been corrupted by incoherent aliasing. As a phase contrast technique, MRE images additionally possess nearly constant magnitude across different phase offsets between the applied mechanical waves and the motion encoding gradient. In this work, we utilize both sparsity and this additional structure across the offsets by extending a Bayesian approach, called ReVEAL, recently proposed for PC-MRI.2 Adaptation of ReVEAL to MRE involves first expanding the Bayesian model of two dimensional flow imaging, as originally proposed, to support an arbitrary number of MRE acquisitions with differing phase offsets. This model can be represented as a factor graph, as seen in Figure 1 for the case of eight offsets. Generalized approximate message passing (GAMP) is utilized as a computationally efficient method of estimating the marginal likelihood distributions of each offset,3 where the reconstructed offset image is related to raw MR data by a Fourier operator. Additionally, a Laplace prior is applied on the undecimated wavelet transform of reconstructed images to encourage sparsity. Having defined conditional distributions to relate the offset reconstructions, iterative belief propagation is used to determine the posterior marginal distributions of each offset.4
While necessary to infer the stiffness of the tissue of interest, the introduction of mechanical waves to the subject reduces the validity of the constant magnitude assumption, especially in close proximity to the placement of the driver. This limitation was addressed by modeling the conditional distribution of one offset conditioned on a second offset as a mixture density consisting of two Rician distributions with different variances. Thus, the belief propagation algorithm will automatically segment the image into regions of strong and weak magnitude consistency across offsets, and the corresponding constraint will be applied. This allows an appropriately strong regularizing constraint to be applied in each region of the image without introduction of model mismatch artifacts.
Experiment
A phantom with known stiffness (5.1 kPa) was imaged on a 3 Tesla clinical MRI scanner (Tim Trio, Siemens Healthcare, Erlangen, Germany), using a GRE MRE sequence. Fully sampled data were collected on a 256x256 matrix, which was later reduced to 128x64 to simulate a quick low resolution scan. Other imaging parameters included: FOV 280x280 mm, slice thickness 5 mm, TR/TE 50/21.9 ms, mechanical frequency 60 Hz, number of offsets 8 (4 with positive MEG and 4 with negative MEG). The central 48 k-space lines from one offset were used to produce coil sensitivity maps for SENSE and ReVEAL reconstruction. The data were retrospectively downsampled using a pseudorandom VISTA pattern5 for ReVEAL reconstruction and a uniform pattern for SENSE reconstruction with R = 2, 3,…, 15. Both reconstructions were then used to create stiffness maps using multimodel direct inversion (MMDI) in MRELab (Mayo Clinic, Rochester, MN).
Three healthy volunteers were imaged with the same 3T scanner and GRE MRE sequence. Fully sampled data were collected on a 128x128, 128x102, and 128x64 matrix, respectively, before each dataset was reduced to 128x64. FOV was 320x320 mm, 380x380 mm, and 320x320 mm, respectively, with a 5 mm slice thickness. TR/TE was 25/21.37, 50/21, and 50/21.16, respectively. Each scan collected 8 offsets with a mechanical frequency of 60 Hz. The datasets were then downsampled, reconstructed, and used to produce stiffness maps as described for the phantom dataset.
Results
In Figure 2, the mean squared error of each reconstruction is plotted against acceleration rate in decibels. Figure 3 displays SENSE and ReVEAL reconstructions of the phantom at R = 1, 3, 6, 9, and 12 as magnitude images, phase images, and elastograms. Figures 4 and 5 compare stiffness values generated by SENSE and ReVEAL for the phantom and volunteer livers using MMDI.Discussion and Conclusions
Acknowledgements
No acknowledgement found.References
[1]. Dulai PS, Sirlin CB, Loomba R. MRI and MRE for non-invasive quantitative assessment of hepatic steatosis and fibrosis in NAFLD and NASH: Clinical trials to clinical practice. J. Hepatol. 2016;65:1006–1016. doi: 10.1016/j.jhep.2016.06.005
[2]. Rich A, Potter LC, Jin N, Ash J, Simonetti OP, Ahmad R. A Bayesian model for highly accelerated phase-contrast MRI. Magn. Reson. Med. 2016;76:689–701. doi: 10.1002/mrm.25904
[3]. S. Rangan. Generalized approximate message passing for estimation with random linear mixing. Inf. Theory Proc. (ISIT), 2011 IEEE Int. Symp. 2011:2168–2172. doi: 10.1109/ISIT.2011.6033942
[4]. F. R. Kschischang BJF and HAL. Factor graphs and the sum-product algorithm. IEEE Trans. Inf. Theory 2001;47:498–519. doi: 10.1109/18.910572
[5]. Ahmad R, Xue H, Giri S, Ding Y, Craft J, Simonetti OP. Variable density incoherent spatiotemporal acquisition (VISTA) for highly accelerated cardiac MRI. Magn. Reson. Med. 2015;74:1266–78. doi: 10.1002/mrm.25507
Figures
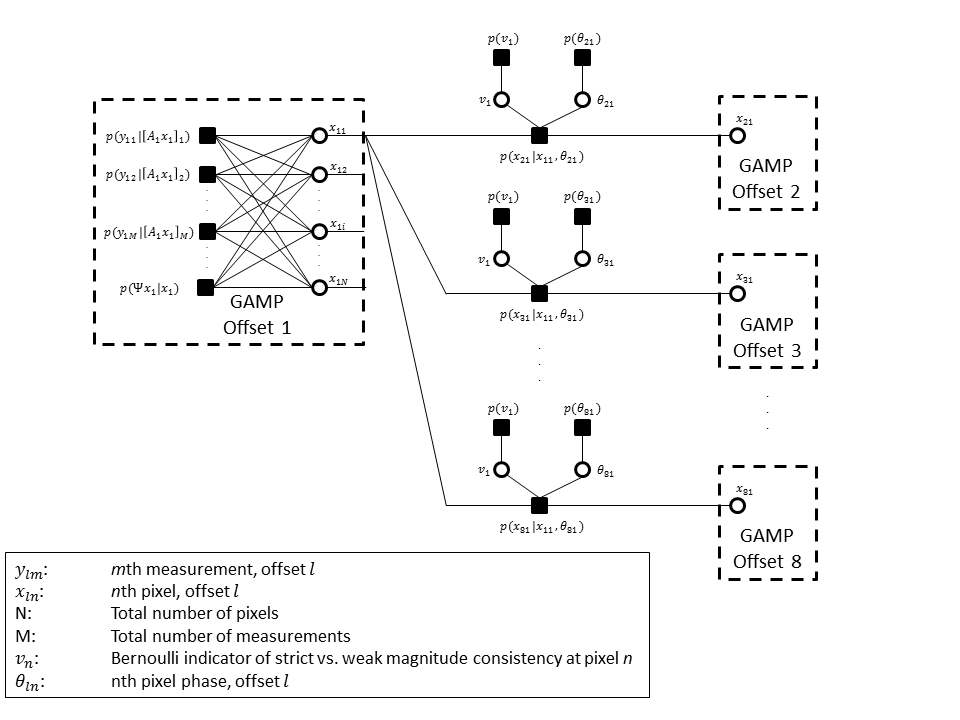
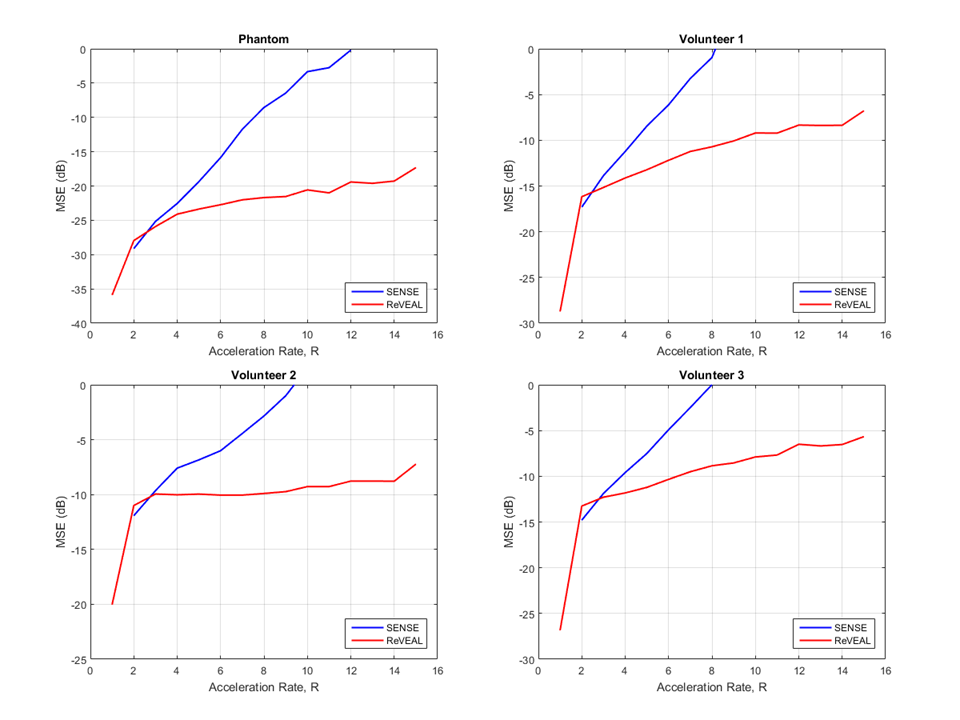
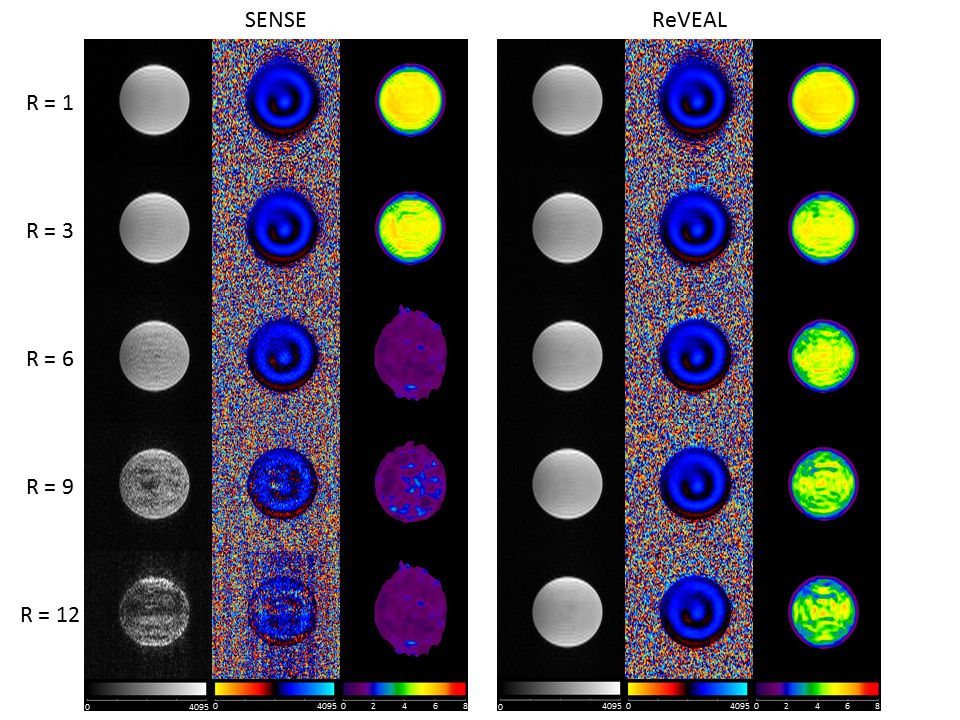
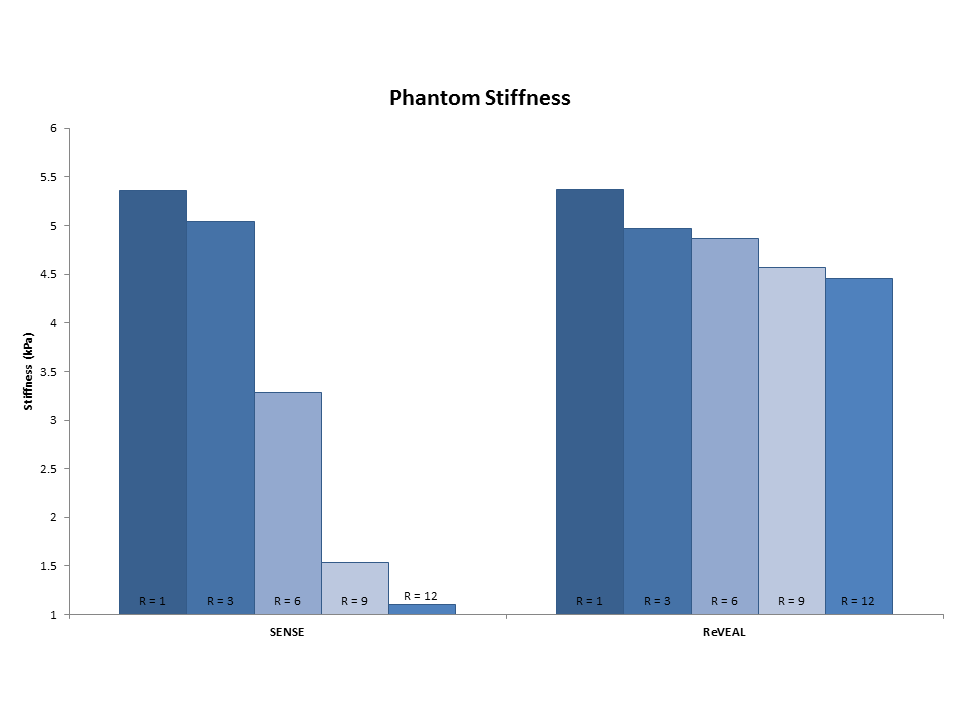
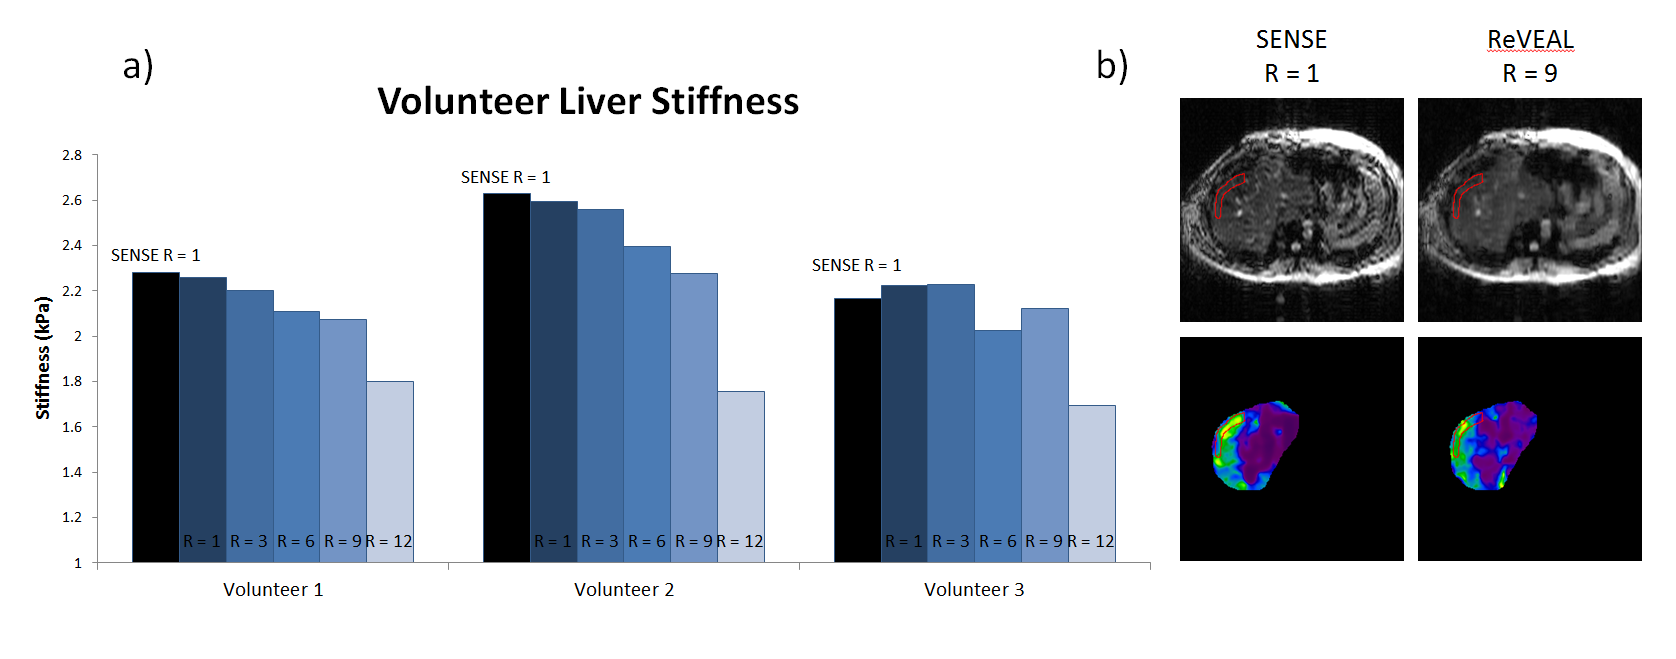
Figure 5: a) Stiffness values for in-vivo liver scans of three healthy volunteers, as calculated using MMDI. Stiffness values found using SENSE at R = 1 are shown as black bars as a baseline for comparison with values found using ReVEAL at R = 1, 3, 6, 9, and 12.
b) Magnitude and stiffness maps of a ReVEAL reconstruction at R = 9 are compared to a fully-sampled SENSE reconstruction.