0444
Comparison of 2D and 3D MR Liver Elastography in 600 Patients1Radiology, Mayo Clinic, Rochester, MN, United States
Synopsis
2D Magnetic Resonance Elastography (MRE) is a validated method for staging liver fibrosis via liver stiffness measurements produced by introducing and imaging acoustic waves. Newer 3D MRE additionally images waves propagating out-of-plane. This retrospective study compared 2D and 3D liver MRE stiffness measurements across 600 patient exams. The two methods had excellent agreement, with 3D MRE yielding 6% lower stiffness and having lower failure rate. 3D MRE, which has the same acquisition time, is a good alternative for liver imaging as it does not suffer from out-of-plane propagation bias and has the added potential to characterize smaller abdominal organs.
Introduction
Magnetic Resonance Elastography (MRE) is a noninvasive quantitative method for calculating organ stiffness.1 It is used clinically for staging hepatic fibrosis. The standard approach uses an acoustic speaker to introduce waves into the body and acquires 2D slices characterizing only in-plane wave propagation information. This has yielded accurate and reproducible results2 since the liver is large and homogeneous. However, the calculated stiffness may be biased if a significant amount of wave energy propagates obliquely to the imaging plane. 3D MRE has been developed for imaging smaller and more heterogeneous structures such as the pancreas,3,4 kidneys,5 and tumors,6 in which this occurrence would be common. This abstract summarizes initial findings from a large-scale comparison of 3D and 2D MRE in patients with clinical indications for liver MRE.Methods
3D MRE was performed in addition to the standard clinical 2D MRE protocol at our institution starting in 2013 to obtain validation data. Over 3000 exams containing both sets of data have been acquired since, and 600 of them were analyzed for this study. 2D MRE uses a GRE sequence to acquire, typically, four 10-mm slices during four 16-second breath holds. The 3D EPI-based sequence acquires 32 slices during three 21-second breath holds. As the 3D stiffness inversion uses 3D filters and processing kernels, the top and bottom 6 slices were discarded from the image analysis due to possible partial volume effects, leaving 20 valid slices.
All exams were processed using the automated elasticity calculation method7 to generate ROIs and calculate average liver stiffness. Exams were then reviewed by an experienced MRE reader to exclude technical failures which prevented the creation of an artifact-free ROI of at least 2000 voxels in the liver, and to adjust failed automated ROIs in otherwise useable exams. Stiffnesses and failure rates between 2D and 3D MRE were compared. Additionally, stiffnesses calculated from 20 3D MRE slices were compared to a quicker analysis which used 4 intermediate slices. The two processing methods were tested for equivalence using a margin of 5% (smallest practically important difference).
Results and Discussion
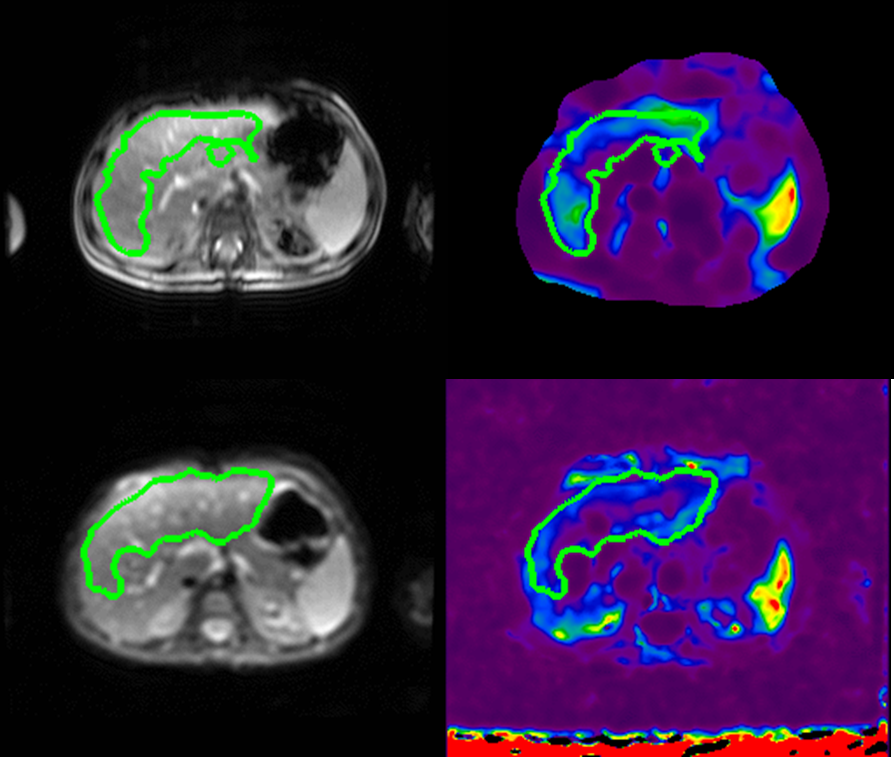
1) 2D and 3D MRE images from a representative exam are shown in Figure 1.
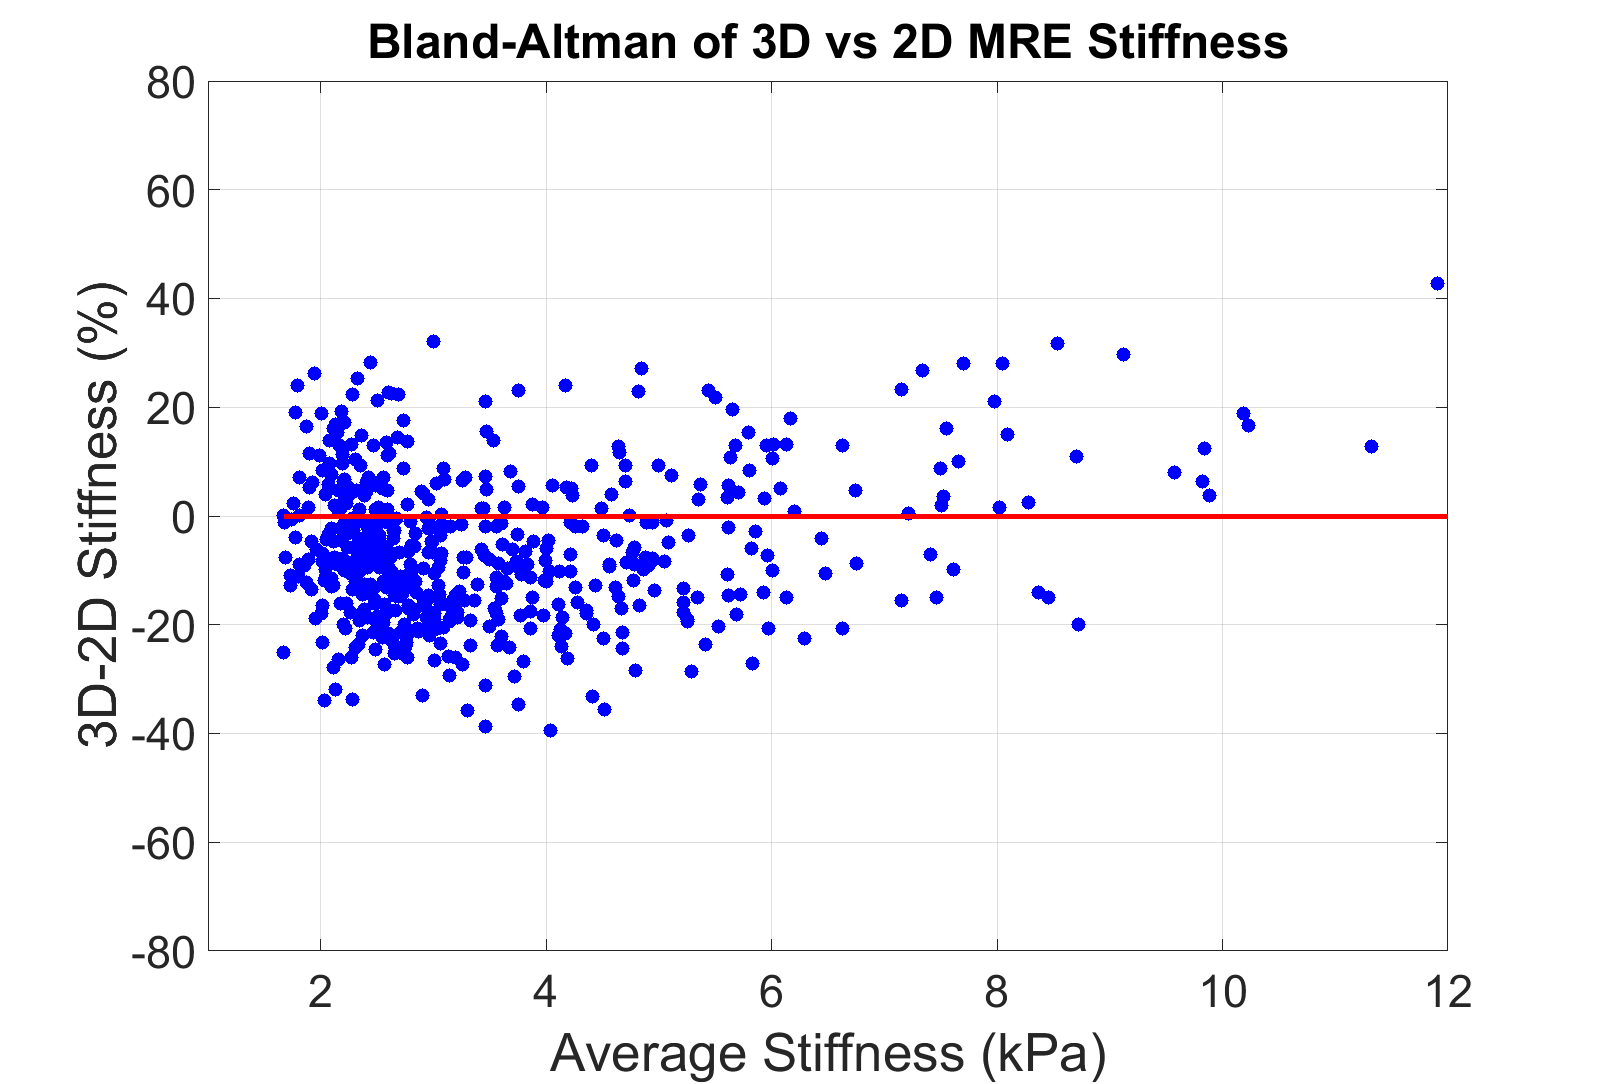
2) The stiffnesses yielded by 2D and 20-slice analysis of 3D MRE had excellent intra-class correlation of 0.968 (Figure 2) and were different by 6.05±13.50% (mean±std dev), with 3D MRE yielding lower mean stiffness (Figure 3).
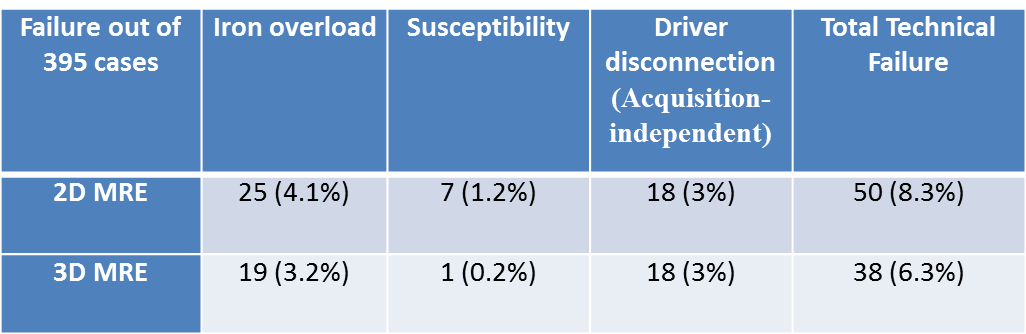
3) Technical failure occurred
in 8.3% of 2D MRE and 6.3% of 3D MRE exams. Failure due to iron overload and
magnetic susceptibility (air in bowels or implants) was lower for 3D MRE (Table 1).
4) Automated ROIs needed modification in 7 (1.5%) of 2D MRE and in 10 (2.67%) 3D MRE exams, mainly in patients with tumors or ascites.
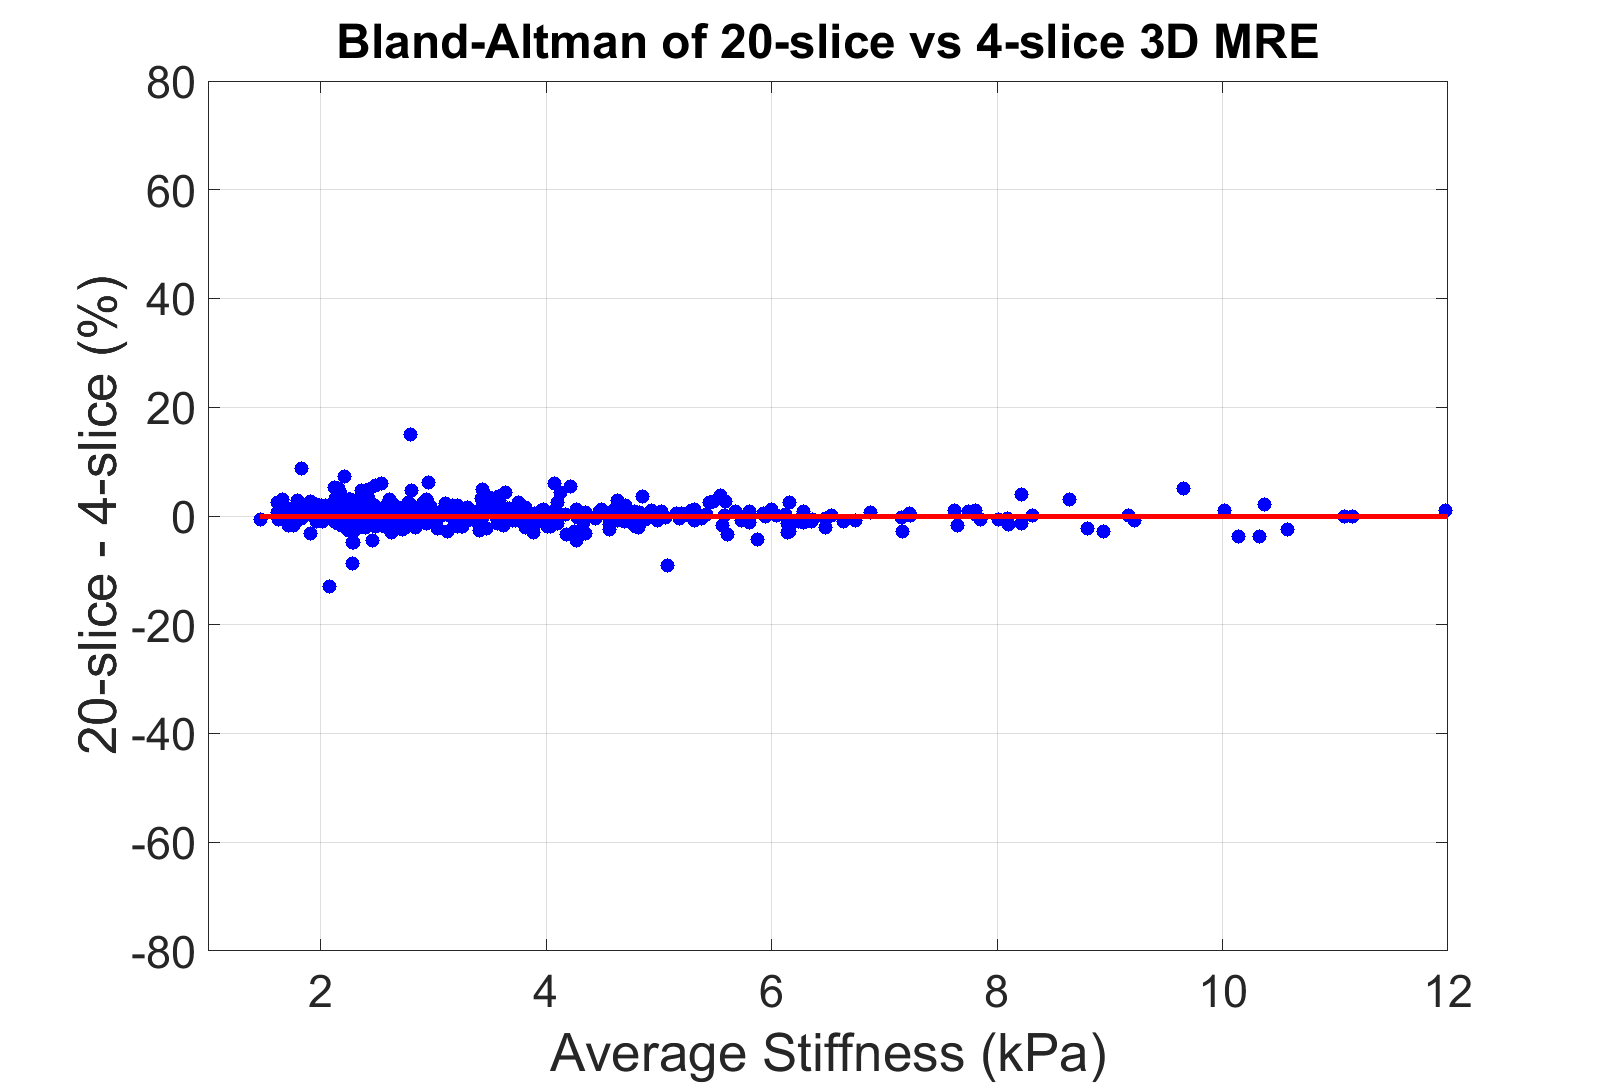
5) The difference between stiffnesses calculated from 20-slices of 3D MRE and from 4-slices of 3D MRE was 0.32% ± 1.99%. The results were statistically equivalent (p<0.001) at the 5% margin (Figure 4).
The findings from this data confirm a relatively small bias between 3D and 2D liver MRE results, with 3D MRE yielding lower stiffness values, and a lower failure rate for 3D MRE which has been observed in previous smaller studies.8-10 The EPI-based acquisition of 3D MRE is less T2*-sensitive than the standard GRE-based 2D acquisition, allowing it to work in a larger fraction of patients with iron overload, a condition which co-occurs with fibrosis. Spin-echo-based sequences able to deal with iron overload but having lower motion-sensitivity are also available in 2D.11 The 3D MRE images have lower image quality than GRE MRE (e.g., inter-tissue contrast, edge contrast, intensity homogeneity) but are adequate for automated processing.
Conclusions
3D EPI MRE can be acquired and analyzed with similar efficiency to 2D MRE and has a lower technical failure rate. There is a small systematic difference in measured stiffness values of approximately 6% between 2D and 3D MRE. Accounting for this modest difference would have little impact, if any, on current tables of diagnostic cutoff values for various stages of fibrosis. The results confirm that 2D remains a reliable approach for liver elastography, with excellent agreement with the more complex 3D MRE approach.Future Work
1) Analyze additional data from the available 3000 exams with 2D and 3D MRE.
2) Review individual cases with large differences in stiffness and determine whether these are caused by processing differences or out-of-plane bias which should be present only in 2D MRE.
3) Compare 3D MRE stiffness with biopsy in approximately 400 patients where the latter is available, and calculate optimal 3D MRE cutoffs.
Acknowledgements
This work was supported by NIH EB07593, NIH EB001981References
(1) Muthupillai R; Lomas, DJ; Rossman, PJ; Greenleaf, JF; Manduca, A; Ehman, RL (1995). "Magnetic resonance elastography by direct visualization of propagating acoustic strain waves". Science. 269 (5232): 1854–1857.
(2) Singh S, Venkatesh SK, Wang Z, Miller FH, Motosugi U, Low RN, Hassanein T, Asbach P, Godfrey EM, Yin M, Chen J, Keaveny AP, Bridges M, Bohte A, Murad MH, Lomas DJ, Talwalkar JA, Ehman RL. Diagnostic performance of magnetic resonance elastography in staging liver fibrosis: a systematic review and meta-analysis of individual participant data. Clin Gastroenterol Hepatol. 2015 Mar;13(3):440-451.e6.
(3) Shi Y, Glaser KJ, Venkatesh SK, Ben-Abraham EI, Ehman RL. Feasibility of using 3D MR elastography to determine pancreatic stiffness in healthy volunteers. J Magn Reson Imaging. 2015 Feb;41(2):369-75.
(4) An H, Shi Y, Guo Q, Liu Y. Test-retest reliability of 3D EPI MR elastography of the pancreas. Clin Radiol. 2016 Oct;71(10):1068.e7-1068.e12
(5) Warner L. Yin M, Glaser KJ, Woollard JA, Carrascal CA, Korsmo MJ, Crane JA, Ehman RL, Lerman LO. Noninvasive in vivo assessment of renal tissue elasticity during graded renal ischemia using MR Elastography. Invest Radiol. 2011 Aug; 46(8): 509–514.
(6) Pepin KM, Ehman RL, McGee KP. Magnetic resonance elastography (MRE) in cancer: Technique, analysis, and applications. Prog Nucl Magn Reson Spectrosc. 2015 Nov;90-91:32-48.
(7) Dzyubak B, Venkatesh SK, Manduca A, Glaser K, Ehman RL. Automated Liver Elasticity Calculation for MR Elastography. Magn Reson Imaging. 2016 May;43(5):1055-63.
(8) Loomba R, Cui J, Wolfson T, Haufe W, Hooker J, Szeverenyi N, Ang B, Bhatt A, Wang K, Aryafar H, Behling C, Valasek MA, Lin GY, Gamst A, Brenner DA, Yin M, Glaser KJ, Ehman RL, Sirlin CB. Novel 3D Magnetic Resonance Elastography for the Noninvasive Diagnosis of Advanced Fibrosis in NAFLD: A Prospective Study. Am J Gastroenterol. 2016 Jul;111(7):986-94.
(9) Morisaka H, Motosugi U, Glaser KJ, Ichikawa S, Ehman RL, Sano K, Ichikawa T, Onishi H. Comparison of diagnostic accuracies of two- and three-dimensional MR elastography of the liver. J Magn Reson Imaging. 2016 Sep 23. [Epub ahead of print]
(10) Shi Y, Xia F, Li QJ, Li JH, Yu B, Li Y, An H, Glaser KJ, Tao S, Ehman RL, Guo QY. Magnetic Resonance Elastography for the Evaluation of Liver Fibrosis in Chronic Hepatitis B and C by Using Both Gradient-Recalled Echo and Spin-Echo Echo Planar Imaging: A Prospective Study. Am J Gastroenterol. 2016 Jun;111(6):823-33.
(11) Mariappan YK, Dzyubak B, Glaser KJ, Venkatesh SK, Sirlin CB, Hooker J, McGee KP, Ehman RL. Application of Modified Spin-Echo-based Sequences for Hepatic MR Elastography: Evaluation, Comparison with the Conventional Gradient-Echo Sequence, and Preliminary Clinical Experience. Radiology. 2016 Aug. [Epub ahead of print]
Figures