0443
Differential Domain Analysis for 3D Cartesian Sampling1Electrical Engineering, Stanford University, Stanford, CA, United States, 2Radiology, Stanford University, Stanford, CA, United States
Synopsis
Selection of arbitrary 3D Cartesian sampling patterns for support-contrained MRI, parallel MRI, and dynamic MRI can be heuristical, and g-factor calculations require a computationally expensive simulation. To provide theoretical guidance and a method to optimize 3D Cartesian sampling, a novel concept of a differential distribution is introduced to represent a distribution of pairwise differences between sample locations, and is related to point-spread-functions. Its relationship to noise amplification in a generalized sensitivity encoding model and linear reconstruction is then used to efficiently optimize multidimensional k-space sampling. Examples in support-constrained MRI, parallel MRI, and dynamic MRI demonstrate reduced noise amplification
Introduction
Arbitrary 3D Cartesian sampling is a black art. Even for linear reconstructions used in support-constrained or parallel MRI,1-3 determining sample distributions or anisotropic acceleration factors to minimize noise amplification is heuristical and is in general computationally infeasible to address with g-factor. In higher-dimensional (e.g. dynamic) imaging, knowledge of a basis allows further acceleration, but necessitates complex multidimensional sampling. Poisson-disc sampling is one solution that imposes minimal spacing between samples and allows finely-tuned subsampling “fit” to specific coil geometries.4 Despite some recent theoretical development,5 a better understanding of the relationship between sampling geometry, coil geometry, point-spread functions, and noise is required to optimize sampling patterns. This work considers a generalized sensitivity encoding model and explicitly relates its conditioning to a novel notion of sampling geometry: a differential distribution, which generalizes a related concept from computer graphics.6 This analytical relationship is leveraged to efficiently optimize k-space sampling patterns without reconstructing images.Methods
Consider a generalized sensitivity-encoding model, $$y_{t,c}(k) = s_t(k) \mathcal{F} \{ \sum_m S_{m,t,c}(r) x_m(r) \} + \epsilon_{c,t}(k), \hspace{10mm} (1)$$ where $$$x_m$$$ is an image, $$$S_{m,t,c}$$$ are sensitivity functions, $$$\mathcal{F}$$$ is an $$$N$$$-point discrete Fourier transform operator, $$$s_t$$$ are sampling functions (binary masks), and $$$\epsilon_{c,t}$$$ is Gaussian noise. (1) can represent sensitivity encoding with channels indexed by $$$c$$$ with multiple maps ($$$m$$$), and dimensions ($$$t$$$) (e.g. time, echoes), over which sampling can be varied and for which a basis (e.g. for signal-intensity-time curves) is known.
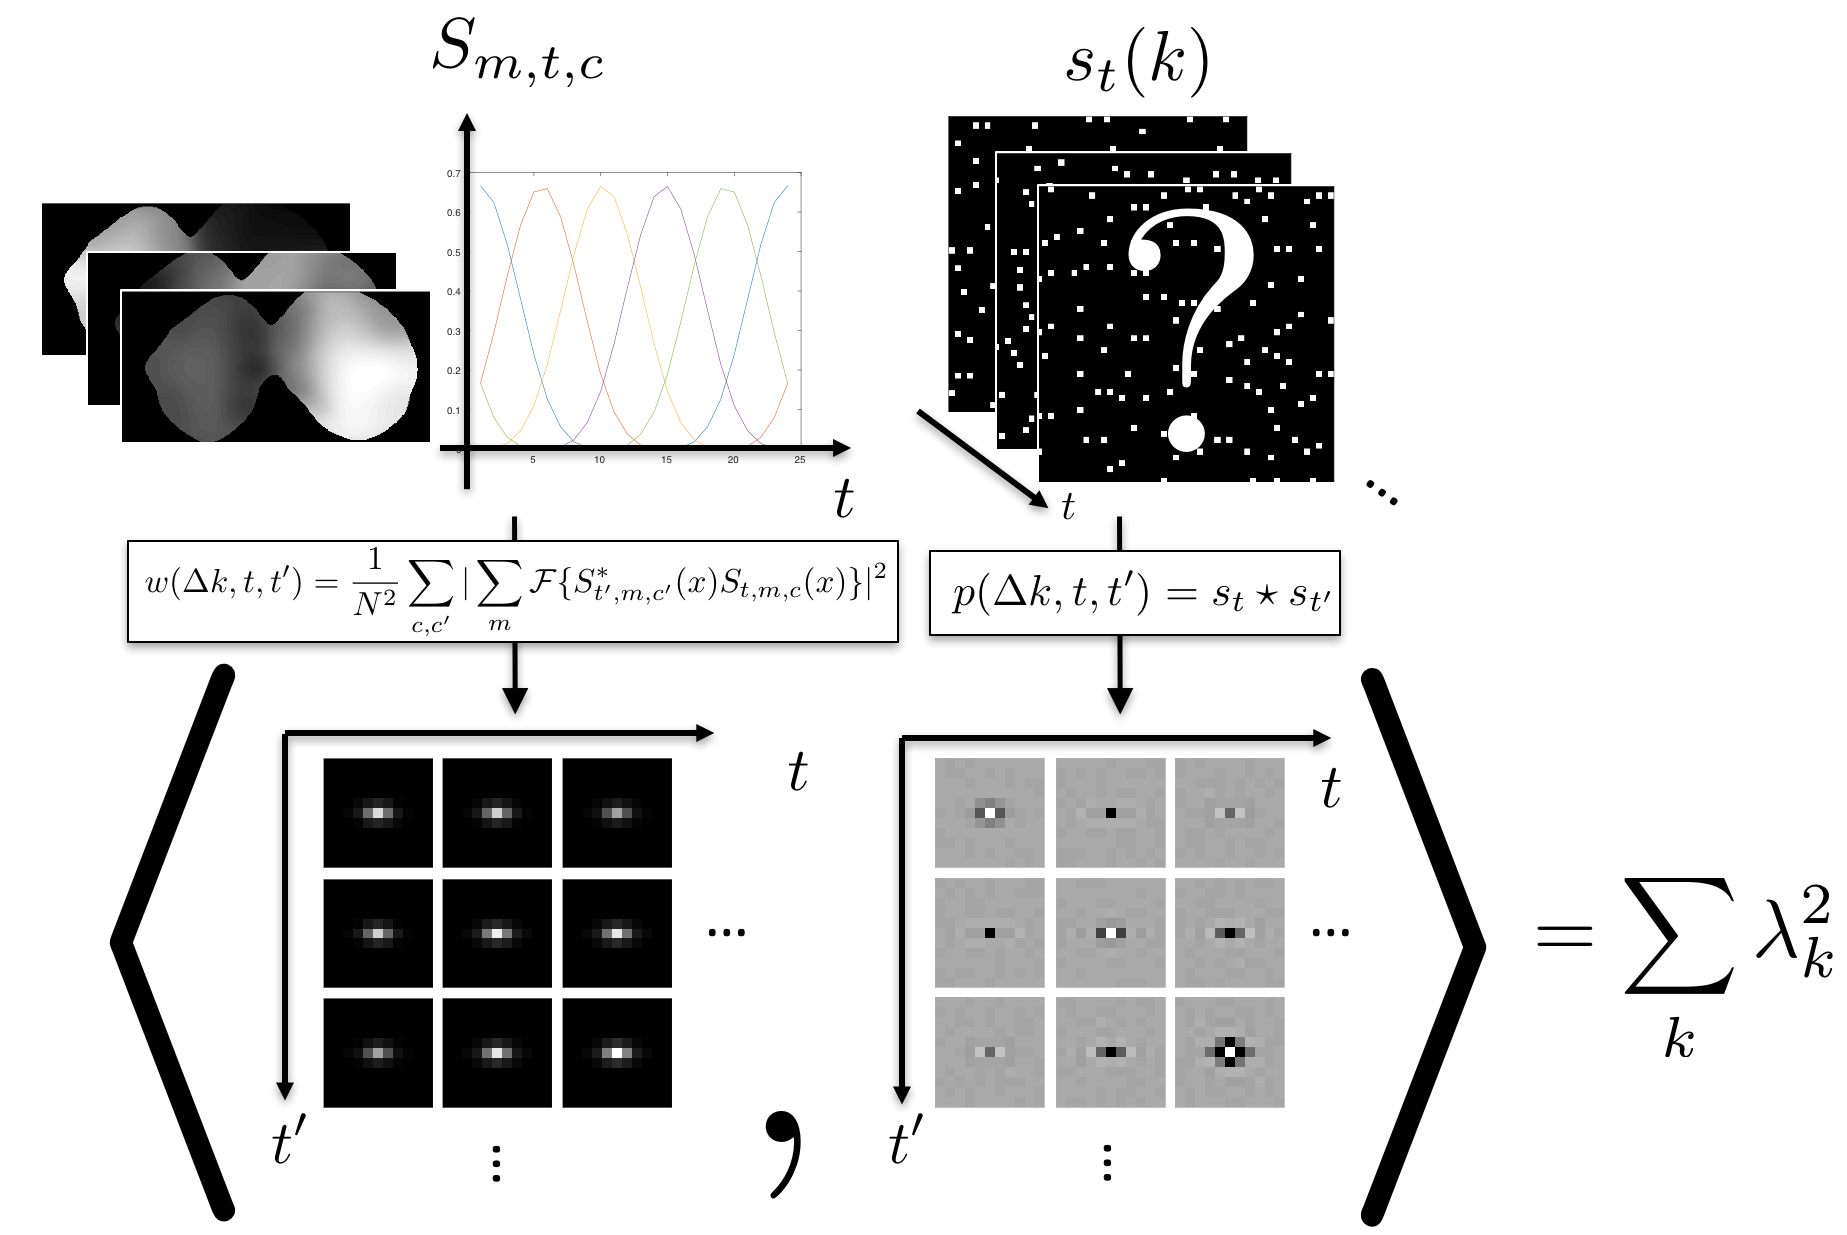
We introduce a novel definition of a differential distribution, which describes the distribution of pairwise differences between sample locations, or equivalently, a circular cross-correlation of sampling patterns: $$p(\Delta k, t, t^\prime) = (s_t \star s_t^\prime)(\Delta k)$$ The differential distribution describes the sampling geometry and is the Fourier transform of the product of PSFs, the squared magnitude of the PSF in the single-time-point case. Representing (1) as a single linear operator $$$E$$$, the eigenvalues of $$$E^HE$$$, $$$\lambda_k(E^HE)$$$, have two properties: 1) their sum is constant and 2) their sum-of-squares can be computed as the inner (dot) product: $$\sum_k\lambda_k(E^HE)^2 = \langle w,p \rangle,\hspace{10mm} (2)$$ where $$w=\frac{1}{N^2} \sum_{c,c^\prime}|\sum_{m}\mathcal{F}\{S_{m,t^\prime,c^\prime}^*(x)S_{m,t,c}(x)\} |^2$$ Together, these properties imply that minimizing (2) minimizes the spread in the eigenvalues, the minimum value corresponding to all eigenvalues equal (ideal conditioning). (2) analytically expresses a measure of noise enhancement in terms of sampling geometry, which is naturally linked with coil sensitivity variation by a Fourier transform relationship. Figure 1 shows an example of $$$w$$$ for coil sensitivities from a breast coil that prescribes an optimal spacing of samples in ky-kz space, and this is generalized to ky-kz-t sampling where signal-intensity-time curves have a temporal basis of B-splines (Figure 2). The relationship can be exploited as a computational shortcut in a sequential selection of samples chosen to minimize (2). Adding a sample only requires updating the cost associated with sampling locations within a local neighborhood determined by the extent of $$$p$$$.
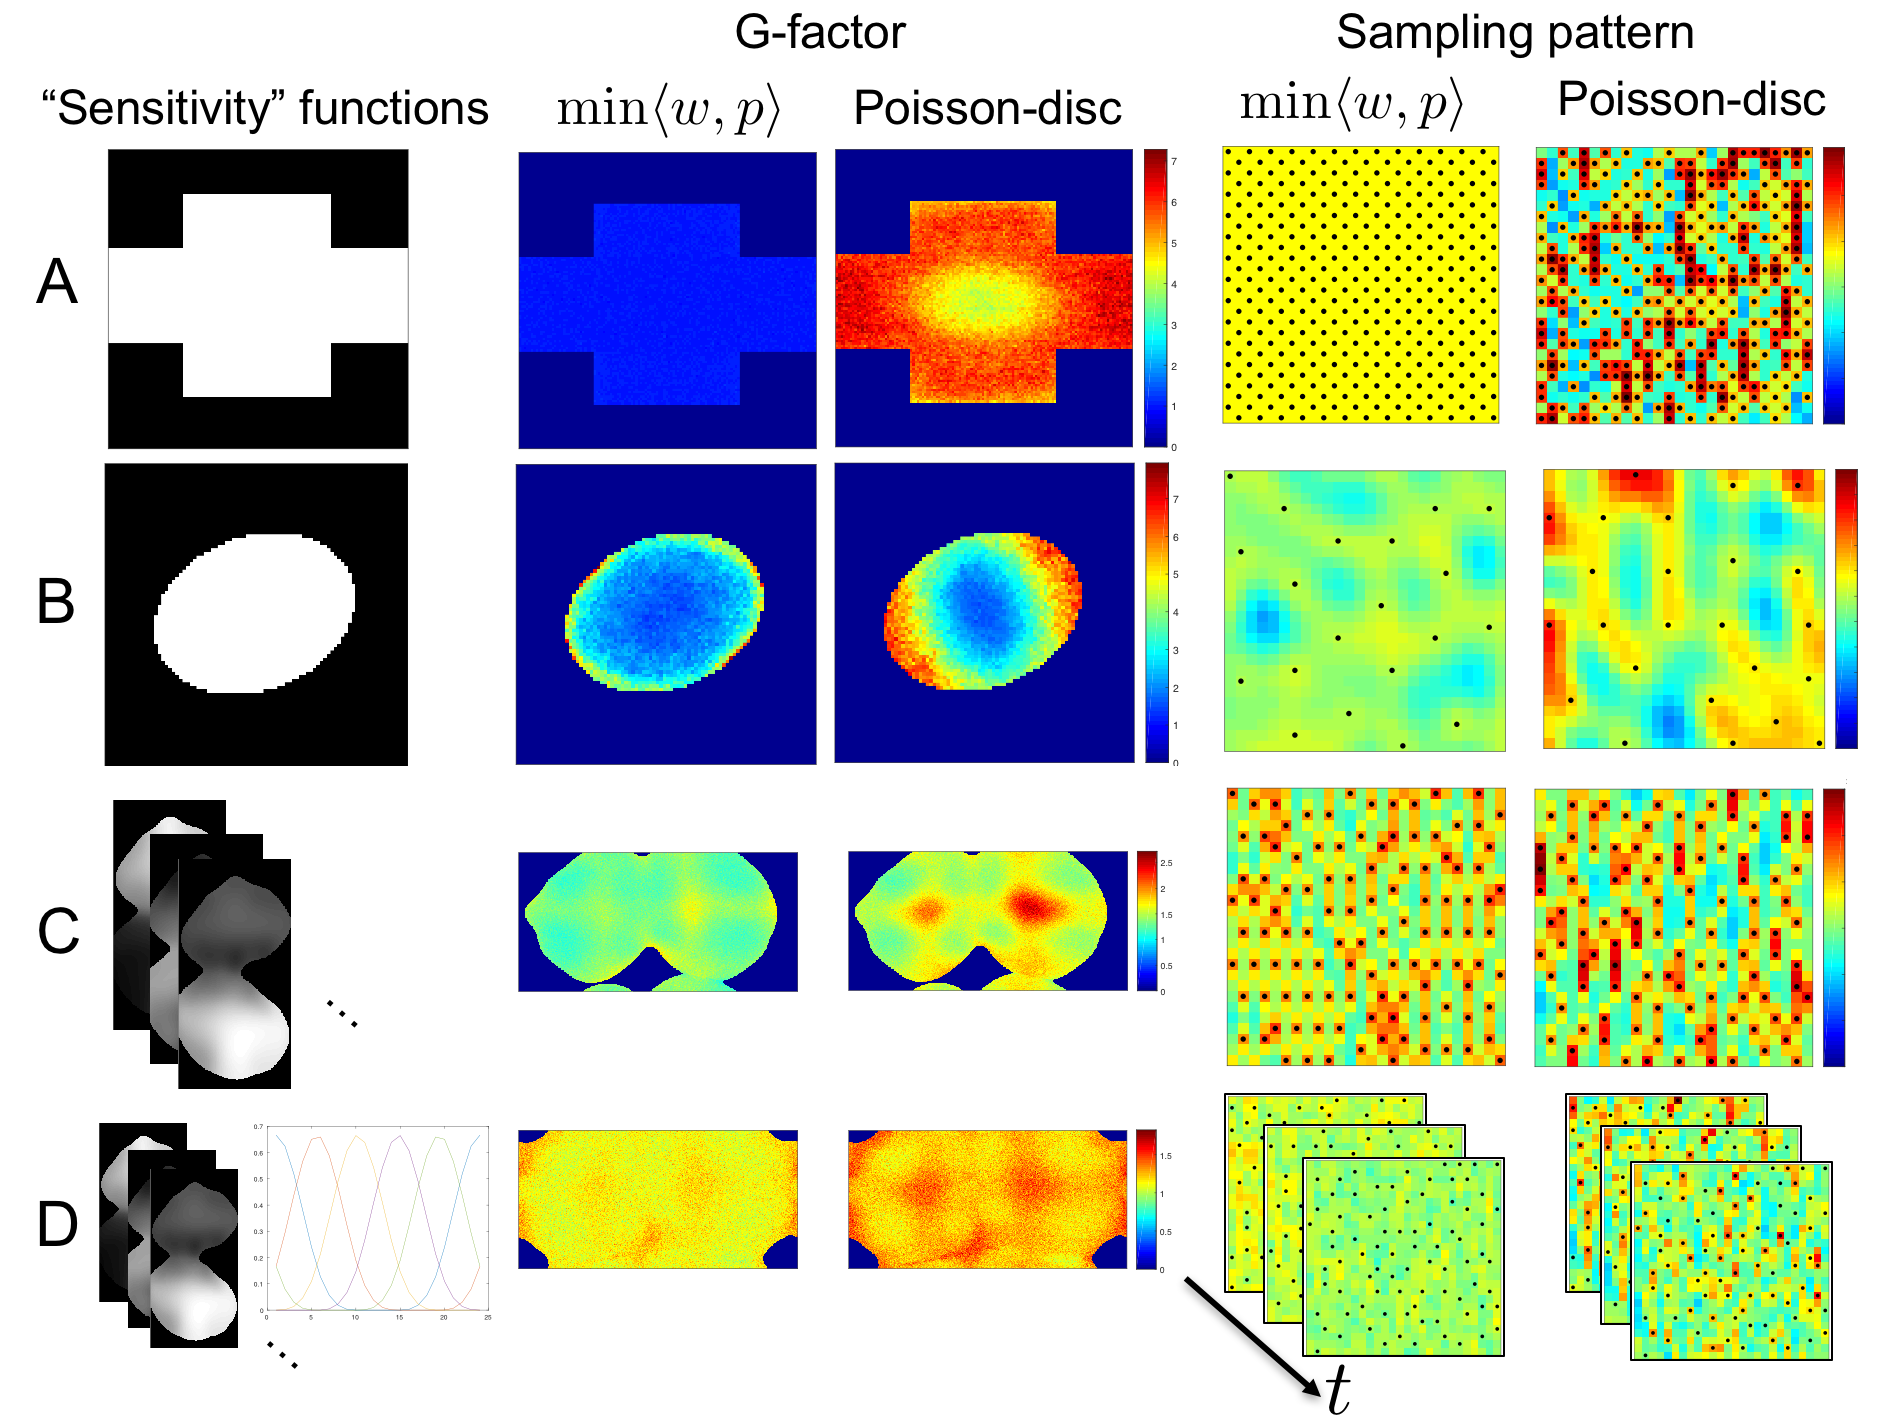
Three problems were considered: 1) support-constrained imaging, 2) single-time-point parallel imaging, 3) multi-time-point parallel imaging. Sampling patterns minimizing (2) and Poisson-disc sampling patterns were compared using g-factor maps and maps in k-space of the change in (2) associated with adding a sample. Cross-shaped7 and elliptical support regions were considered (Fig. 3A-B). Sensitivity maps from a 16-channel breast coil estimated using ESPIRiT8 were also considered (Fig. 3C), both for single-time-point imaging and multi-time-point imaging where a temporal basis of 5 third order B-splines spanning 20 time frames was assumed (Fig. 3D).
Results and Discussion
Figure 3 shows
sensitivity functions, sampling patterns overlaid with the change in (2)
associated with sampling k-space, and g-factor maps. The proposed sampling
patterns show lower g-factor than Poisson-disc sampling and, correspondingly, fewer
regions of k-space where the local sampling geometry does not match the weighting
$$$w$$$. The proposed method automatically selects the well-known optimal checkerboard
sampling pattern for the cross-shaped support profile, for which $$$w$$$ nulls
the side-band of the optimal $$$p$$$. For the elliptical support region, it
selects an optimal anisotropic subsampling scheme with a nearly uniform
g-factor. The proposed sampling can optimally balance correlations in ky-kz
space (Fig. 3C) or ky-kz-t space (Fig. 3D).Conclusion
A novel concept of a differential distribution describing sampling geometry was introduced. Its relationship to noise amplification in a generalized sensitivity-encoding-based linear reconstruction was described based on natural analytical expressions for the sum and sum-of-squares of the eigenvalues of the system matrix. The relationship gives insights into sampling and provides a convenient computational tool for the automatic design of sampling patterns.Acknowledgements
R01 EB017739, P41 EB015891, research support from GE HealthcareReferences
[1] Pruessmann et. al, MRM 42:952-962, 1999; [2] Griswold etl. al, MRM 47:1202-1210, 2002; [3] Lustig et. al, MRM 64:457-471 2010; [4] Vasanawala et. al, IEEE ISBI 2011; [5] Athalye et. al, Inverse Problems 31:045008 2015; [6] Wei et. al, ACM Graphics: 30: 50-64, 2011 [7] Madore et. al, MRM 42;813-828 1999 [8] Uecker et. al, MRM 71: 990-1001, 2014Figures
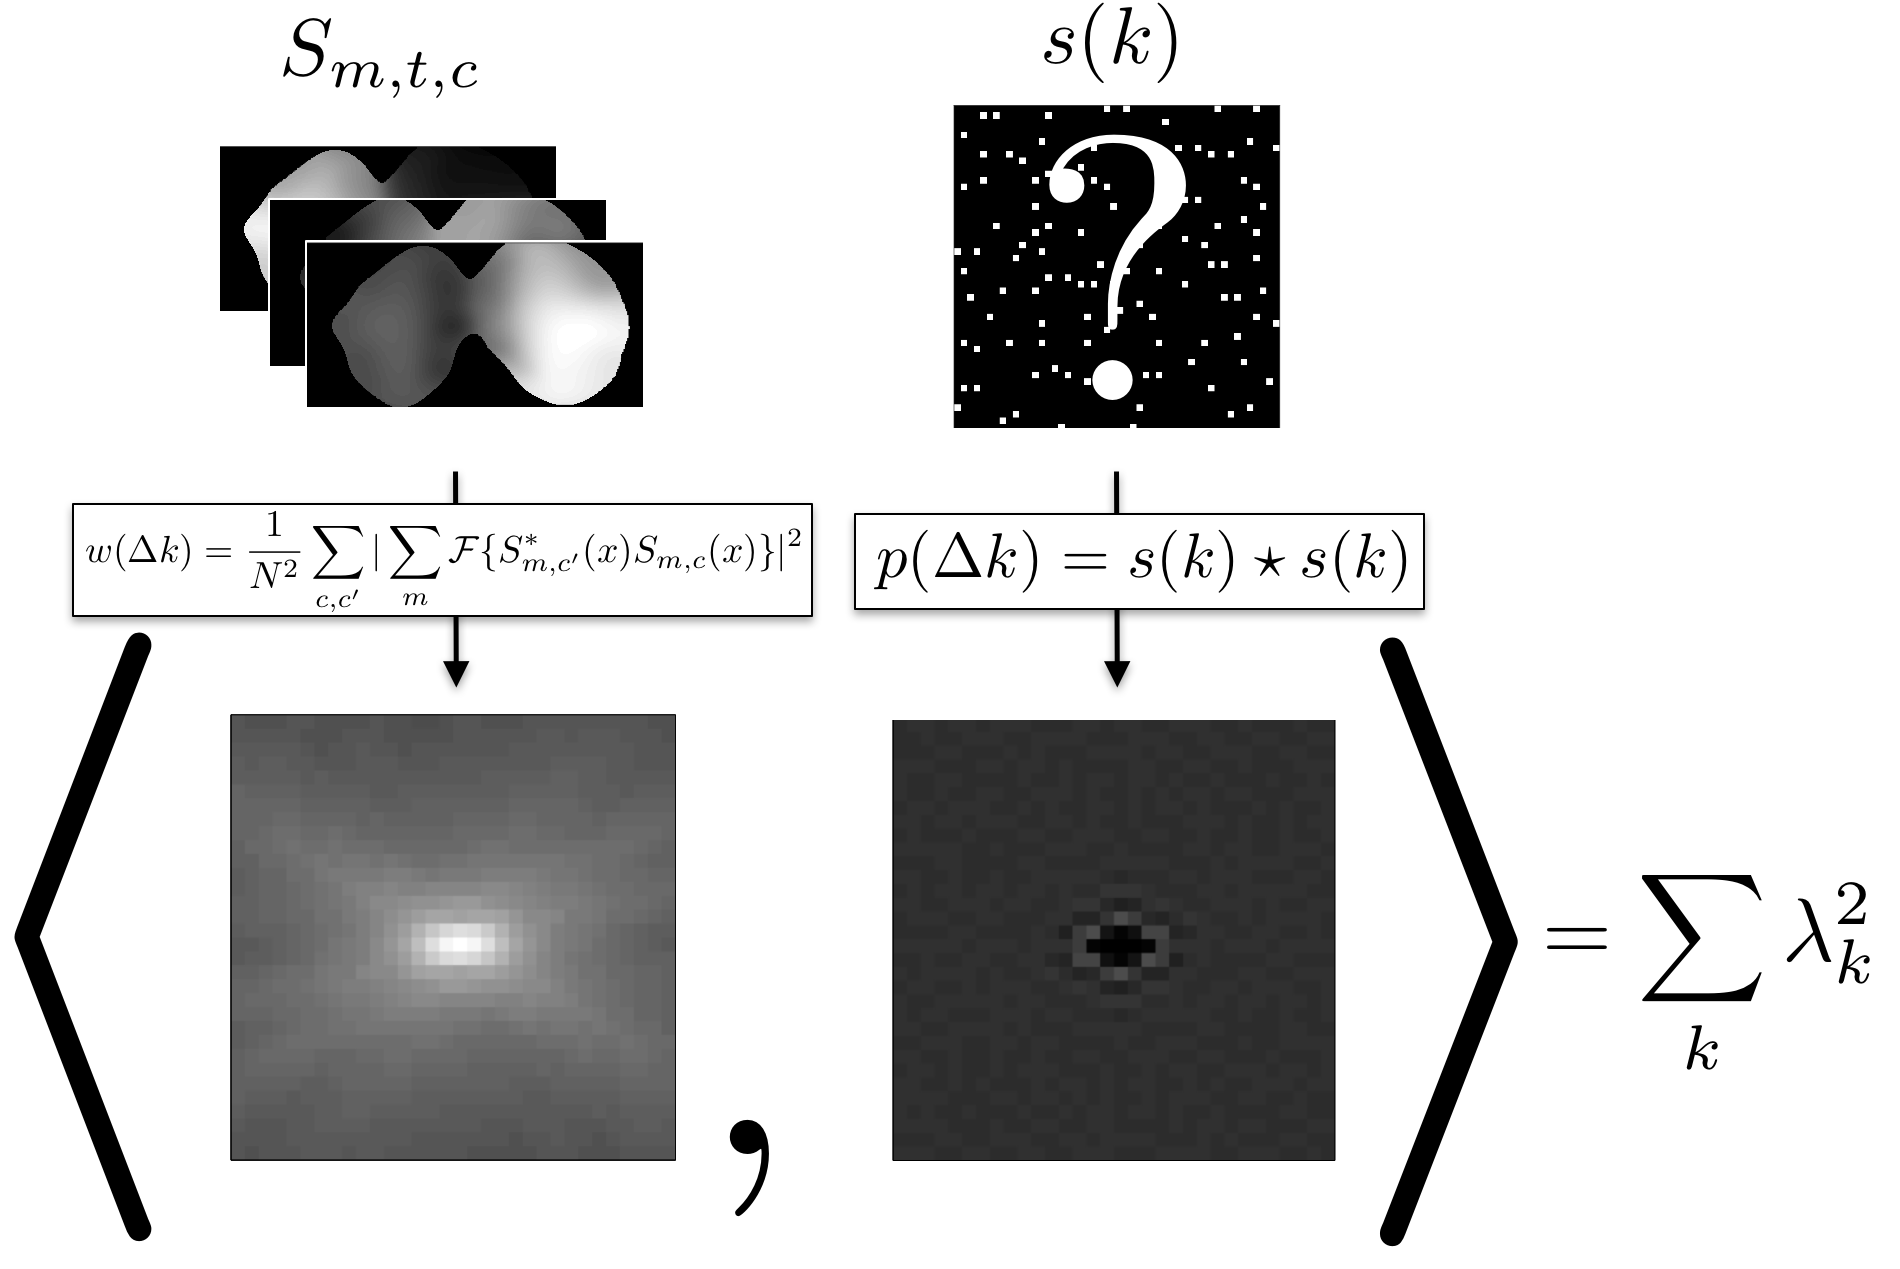
Figure 1: The differential distribution $$$p$$$ describes sampling geometry as a distribution of pairwise differences between sample locations. The weighting function $$$w$$$ represents coil sensitivity information in all directions. Optimal sampling geometry, or differences between sample locations $$$p$$$, matches $$$w$$$, as minimizing their inner product minimizes the spread in the eigenvalues.