0439
Epidemiology and spatial heterogeneity of hepatic fat and iron deposition: an MRI-based analysis1Mallinckrodt Institute of Radiology, Washington University School of Medicine, St Louis, MO, United States, 2Southern Illinois University School of Medicine
Synopsis
MRI has emerged as a reliable, noninvasive means of liver fat and iron quantification. We retrospectively studied 1006 patients that underwent standard-of-care liver MRI at a single tertiary care center. Multivariate analysis was used to identify factors predictive of the severity and spatial heterogeneity of hepatic fat deposition (HFD) and hepatic iron deposition (HID). Greater spatial heterogeneity of HFD and HID generally occurred as the severity of HFD and HID increased, suggesting
Purpose
Methods
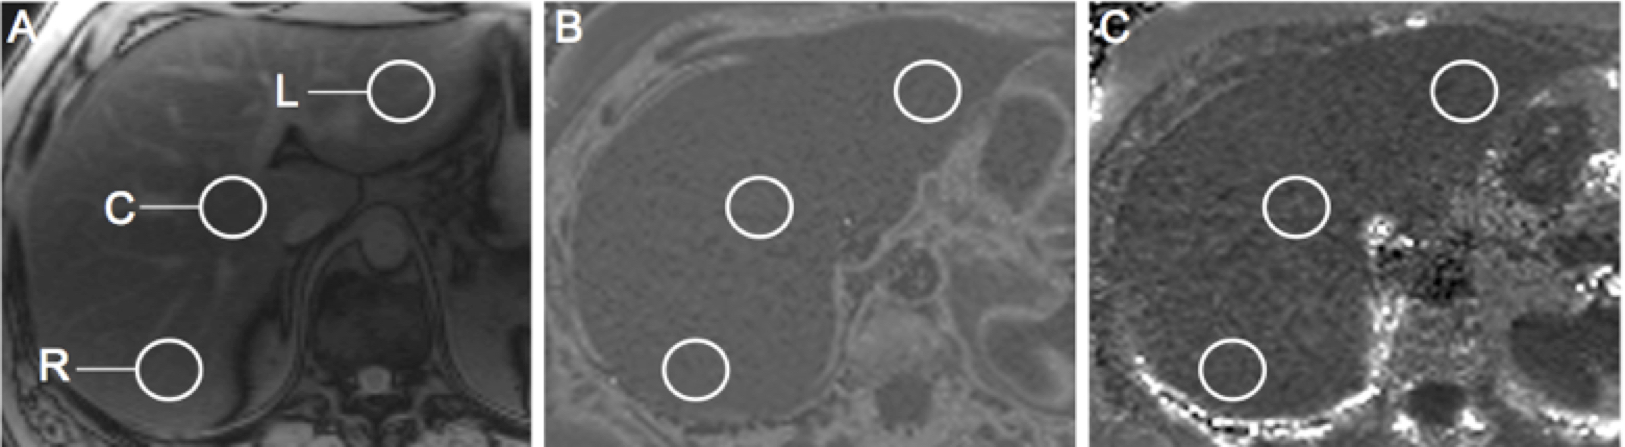
This retrospective study included 1006 patients that underwent standard-of-care liver MRI at a single tertiary care center. Low flip-angle multiecho gradient-recalled echo images were processed to derive proton density fat fraction (PDFF) maps for liver fat quantification and R2* maps for determination of liver iron concentration (LIC). For each patient, regions of interest were selected to include the right hemiliver, central liver, and left hemiliver (Figure 1). For each subject, HFD grades were assigned on the basis of PDFF values as follows: grade 0 – mean PDFF of < 5.5%; grade 1 – mean PDFF of 5.5-16.2%; grade 2-3 – mean PDFF of 16.3-21.6%; grade 4 – mean PDFF of 21.7% or greater.7 Similarly, HID grades were assigned on the basis of R2* values as follows: none – mean LIC of < 2 mg/g; mild – mean LIC of 2-7 mg/g; moderate – mean LIC of 8-15 mg/g; severe – mean LIC of > 15 mg/g.8 Demographic, clinical, and laboratory information was collected for each patient and included in a multivariate analysis to determine predictors of PDFF and R2* values and their spatial heterogeneity.Results
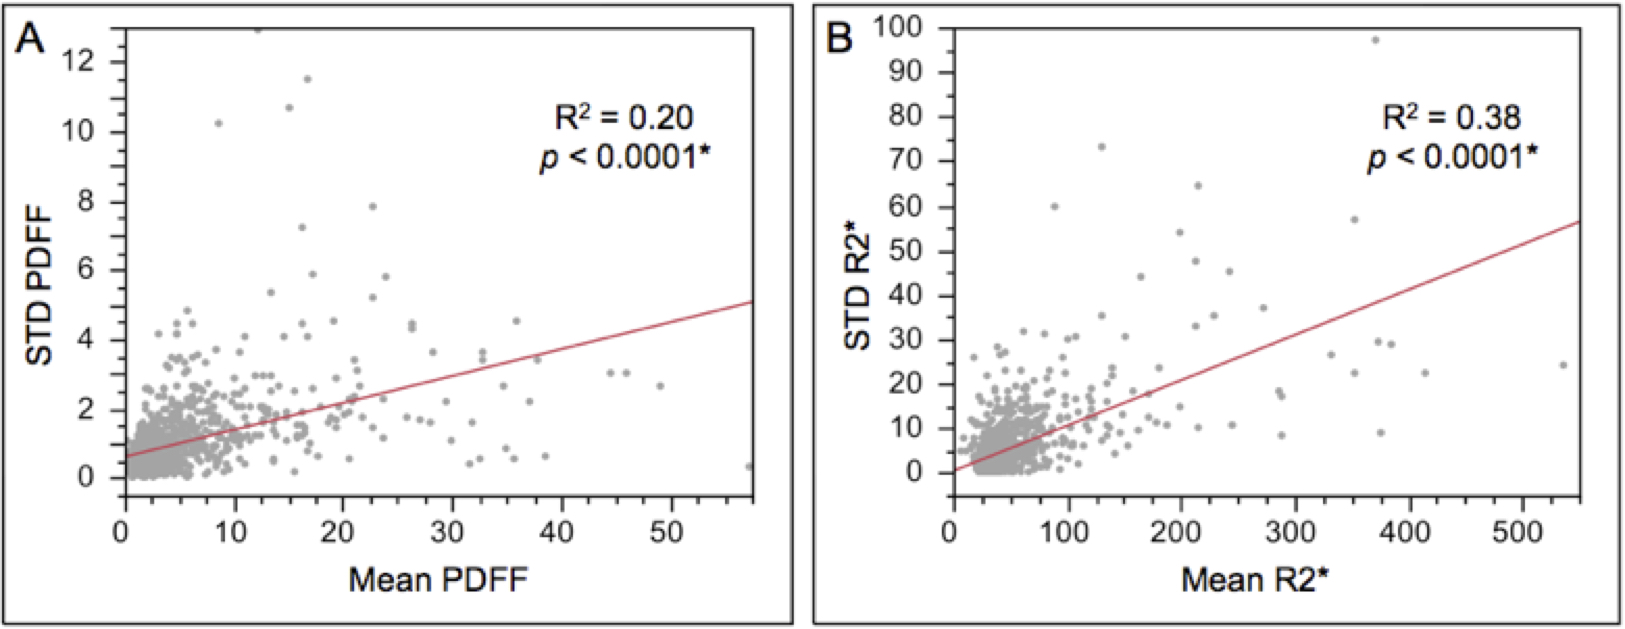
HFD was evident in 25% of patients (grade 1, 76%; grade 2-3, 12%; grade 4; 12%), whereas HID was evident in only 12% of patients (mild, 92%; moderate, 8%; severe 0%). Larger body-mass index (BMI) predicted higher grades of HFD (p < 0.001) but not HID. Age, race, and gender were not predictive of HFD or HID. Higher grades of HFD correlated with greater HID (p < 0.001). Risk factors for nonalcoholic fatty liver disease (NAFLD) predicted higher grades of FLD (p < 0.001) but not HID. Risk factors for chronic liver disease or cirrhosis predicted neither HFD nor HID. Chemotherapy within the previous 6 months was predictive of higher grades of HID (p = 0.01) but not HFD. With higher grades of HFD, PDFF values exhibited larger standard deviations and ranges (p < 0.001, Figure 2). Similarly, larger standard deviations and ranges were observed for R2* at higher levels of HID (p < 0.001, Figure 2). Using the mean PDFF from a single region of interest rather than the mean PDFF derived from all three regions of interest (i.e., simulating the sampling error of a random liver biopsy), patients would have been misclassified by HFD severity at a rate of 7%. In contrast, patients would have misclassified by HID severity at a rate of only 1%.Discussion
As expected, risk factors for NAFLD correlate with higher grades of HFD. Somewhat surprisingly, risk factors for chronic liver disease did not correlate with higher grades of either HID or HFD on MRI. Importantly, our study confirmed the histologic and imaging findings of other authors that lipid and iron deposition can exhibit significant spatial heterogeneity.9,10 We found that the severity of HFD and HID strongly correlated with the degree of heterogeneity. We estimate that a random biopsy in our population would have misclassified the grade of HFD in approximately 7% of patients, an undesirably high rate given the risks associated with this invasive procedure.11 Only 1% of all patients would have been misclassified with respect to the degree of HID, perhaps attributable to the comparatively low prevalence of hepatic siderosis in our population.Conclusion
Given the spatial heterogeneity of fat and iron deposition observed at higher grades of HFD and HID, respectively, the global evaluation of liver anatomy provided by MRI constitutes a robust tool for assessing hepatic steatosis and iron deposition. Furthermore, MRI is uniquely suited to the serial assessment of HFD and HID, serving as a means of detecting global improvements in hepatic steatosis and siderosis during interventions such as weight loss or chelation.Acknowledgements
No acknowledgement found.References
1. Scaglioni F, Ciccia S, Marino M, et al. ASH and NASH. Digestive Diseases. 2011 Jul 5;29(2):202-10.
2. Fargion S, Valenti L, Fracanzani AL. Beyond hereditary hemochromatosis: new insights into the relationship between iron overload and chronic liver diseases. Digestive and Liver Disease. 2011 Feb 28;43(2):89-95.
3. Brunt EM, Janney CG, Di Bisceglie AM, et al. Nonalcoholic steatohepatitis: a proposal for grading and staging the histological lesions. The American journal of gastroenterology. 1999 Sep 1;94(9):2467-74.
4. Rowe JW, Wands JR, Mezey E, et al. FAMILIAL Hemochromatosis: Characteristics of the pre-cirrhotic stage in a large kindred. Medicine. 1977 May 1;56(3):197-212.
5. Reeder SB, Sirlin CB. Quantification of liver fat with magnetic resonance imaging. Magnetic resonance imaging clinics of North America. 2010 Aug 31;18(3):337-57.
6. Sirlin CB, Reeder SB. Magnetic resonance imaging quantification of liver iron. Magnetic resonance imaging clinics of North America. 2010 Aug 31;18(3):359-81.
7. Middleton MS, Heba E, Hooker CA, et al. Cross-sectional and longitudinal agreement of magnetic resonance imaging proton density fat fraction with pathologist grading of hepatic steatosis in adults with nonalcoholic steatohepatitis in a multi-center trial. Hepatology. 2015 Oct 1; 62: 1255A.
8. Alustiza JM, Artetxe J,Castiella A, et al. MR Quantification of Hepatic Iron Concentration 1. Radiology. 2004 Feb;230(2):479-84.
9. Ratziu V, Charlotte F, Heurtier A, et al. Sampling variability of liver biopsy in nonalcoholic fatty liver disease. Gastroenterology. 2005 Jun 30;128(7):1898-906.
10. Wood JC, Zhang P, Rienhoff H, et al. Liver MRI is more precise than liver biopsy for assessing total body iron balance: A comparison of MRI relaxometry with simulated liver biopsy results. Magnetic resonance imaging. 2015 Jul 31;33(6):761-7.
11. Bravo AA, Sheth SG, Chopra S. Liver biopsy. New England Journal of Medicine. 2001 Feb 15;344(7):495-500.
Figures