0437
Estimating Liver Function in Chronic Liver Disease Patients Using DCE-MRI and Whole-Body Pharmacokinetic Modeling1Department of Health and Medicine, Linköping University, Linköping, Sweden, 2Center for Medical Image Science and Visualisation, Linköping University, Linköping, Sweden, 3Department of Biomedical Engineering, Linköping University, Linköping, Sweden
Synopsis
Dynamic contrast enhanced MRI with Gd-EOB-DTPA is a promising method for investigating liver function. However, many of the proposed procedures relies on such a high temporal resolution, and low spatial resolution, that the images are rendered unsuitable for radiographic reading. Here we have tested and validated a recently developed procedure using a whole-body pharmacokinetic model in a cohort of patients with chronic liver disease. Moreover we also show that the approach can separate advanced from mild fibrosis.
Purpose
Dynamic contrast enhanced MRI (DCE‑MRI) using the hepatocyte specific contrast agent Gd‑EOB‑DTPA (EOB) has been suggested as a method for investigating liver function in humans as well as in rats. Several different methods for analyzing the DCE‑MRI data have been proposed1-4. However, many of the proposed procedures relies on such a high temporal resolution, and low spatial resolution, that the images are rendered completely unsuitable for conventional radiographic reading. The procedures would therefore be inappropriate in existing EOB-enhanced MRI protocols.
A mechanistic whole-body pharmacokinetic model does not require such a high temporal resolution and might therefore be a useful alternative. Such a model, developed based on principles from systems biology, has recently been introduced4. This model based method was developed using images acquired using a standard EOB-enhanced MRI protocol, and the images were therefore suitable for radiographic reading.
The whole-body model has previously only been tested on data from healthy volunteers. Our intention was therefore to evaluate the suitability of the model on data from patients suffering from chronic liver disease (CLD).
Methods
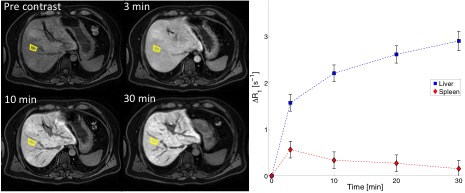
Ninety-one patients with suspected CLD underwent an MRI examination followed by two liver biopsies. The examination included a series of two-point-Dixon images (TR=6.5ms, TE=2.3/4.6ms, FA=13°, matrix=168x168, FOV=261x200x342mm3) acquired before and repeated up to 30 minutes after injection of EOB (Fig.1, Left). The images were reconstructed into separate water and fat images and regions of interest (ROIs) were then placed both in liver (n=7) and in spleen (n=3). The average signal intensities in the ROIs were converted into relative changes in R1‑relaxation time (ΔR1), which are proportional to EOB concentrations.5
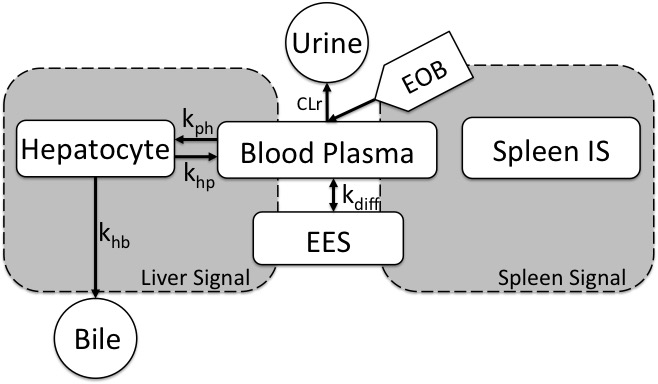
The resulting time series of ΔR1 (Fig.1, Right) were subsequently analyzed using the whole-body pharmacokinetic model (Fig.2). The model, based on ordinary differential equations, describes how EOB is taken up by the hepatocytes and excreted into the bile. The model was parametrized into the ΔR1-time series and four separate parameters were estimated per patient. The parameters were estimated using a non-linear mixed-effects (NLME) approach. NLME allows for an improved parameter estimation when data is sparse.6
The model and parameter combinations were subsequently validated. Blood samples, drawn from each patient 10-20 minutes after the MRI examination were used for validation purposes. The Gd3+ concentrations in the samples were analyzed using inductively coupled plasma-sector field mass spectrometry (ICP-SFMS). The Gd3+ concentration is equivalent to the EOB concentration, since EOB contains one Gd3+ per molecule. The measured Gd3+concentrations were compared with the concentrations predicted by model simulations, after correcting for differences in dose and estimated volume of the extracellular extravascular space (EES).
A second biopsy obtained from each patient was graded histologically for fibrosis etc.
Results
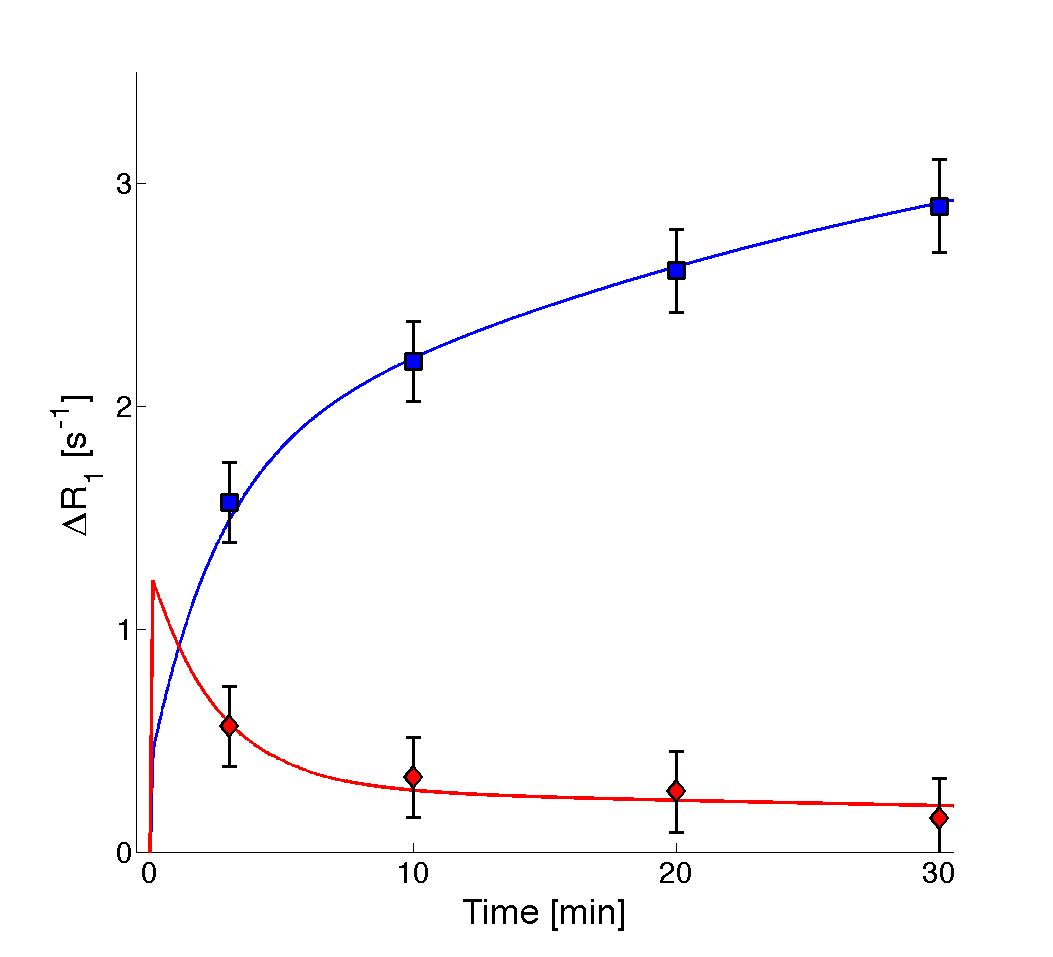
The model described the data from the patients well (Fig.3), and all but one patient passes a Chi-2-test (p<0.05).
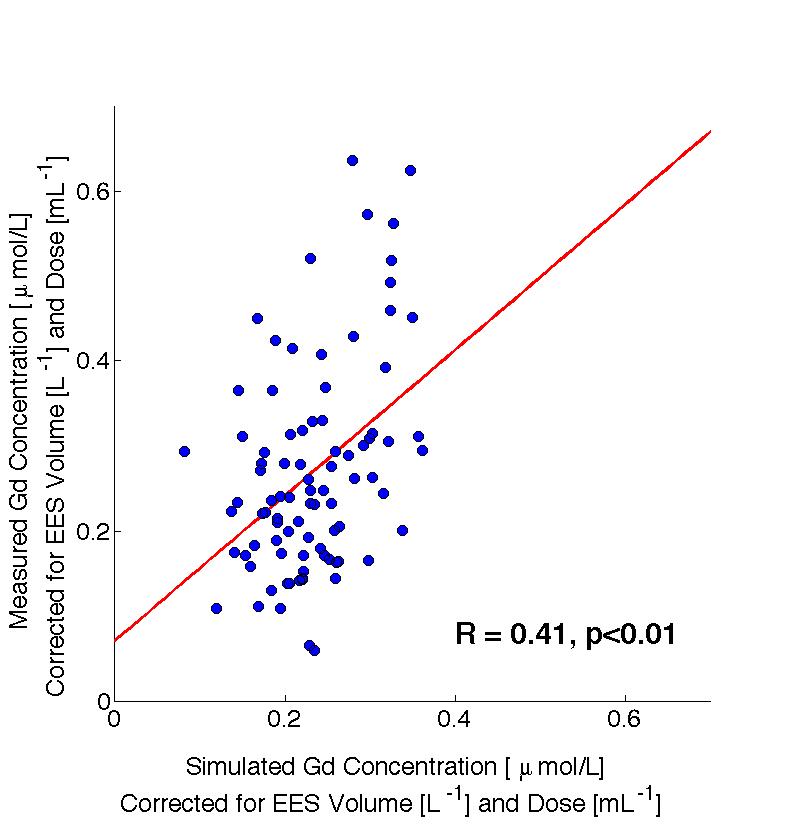
The predicted blood Gd3+concentrations showed a significant correlation (R=0.41, p<0.01) with the measured values (Fig.4). Moreover, a linear regression showed no significant offset (p=0.15).
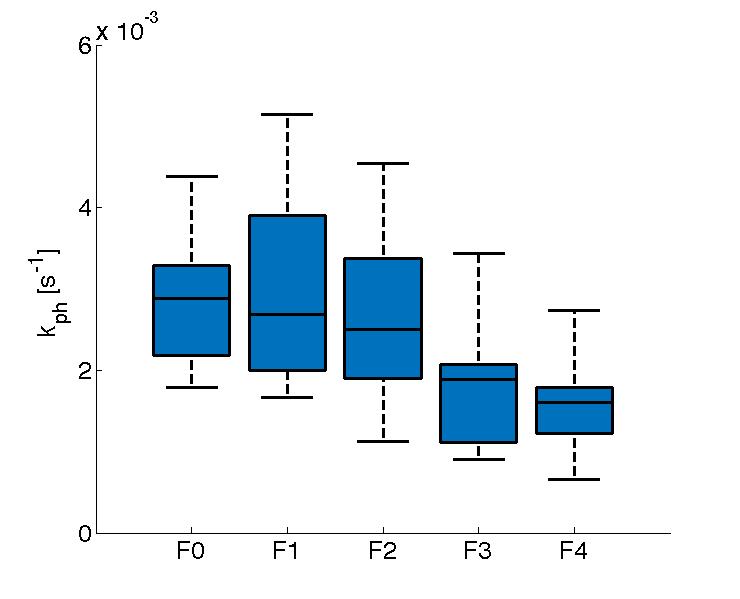
The hepatic uptake rate of EOB, kph, decreased with increasing fibrosis stage (severity) (Fig.5) and kph was significantly lower in patients with advanced fibrosis (F3‑F4; p<0.01).
Discussion
The whole-body pharmacokinetic model could be used to analyze EOB DCE-MRI from patients suffering from CLD. Furthermore, the whole-body model approach also has the possibility to reduce the need for high temporal resolution. The images can thus be used for conventional radiographic reading, and this will be investigated further in the future.
The model was physiologically realistic, and it was validated by the blood samples. The determined blood EOB concentrations showed that the model could predict data that were independent from the data used to estimate the parameters. Future work will also include validation using measured Gd3+ concentrations in biopsies.
The model has the potential of being useful as an important biomarker for hepatic function since the EOB uptake parameter kph will decrease for patients with advanced fibrosis.
The whole-body model is potentially also useful as a tool for measuring liver function in pre-clinical pharmaceutical studies, for evaluating drug induced liver injury (DILI). A similar approach for DILI, also using EOB-MRI has been proposed recently.3
Conclusion
Dynamic EOB-enhanced MRI of patients with chronic liver disease can be analyzed using a whole‑body pharmacokinetic model.Acknowledgements
No acknowledgement found.References
1Nilsson H, et al. Assessment of hepatic extraction fraction and input relative blood flow using dynamic hepatocyte-specific contrast-enhanced MRI. J Magn Reson Imaging. 2009;29(6):1323-1331.
2Surbron S, et al. Combined quantification of liver perfusion and function with dynamic gadoxetic acid-enhanced MR imaging. Radiology. 2012;263(3):874-883.
3Ulloa J, et al. Assessment of gadoxetate DCE-MRI as a biomarker of hepatobiliary transporter inhibition. NMR Biomed. 2013;23(10):1258-1270.
4Forsgren M.F., et al. Physiologically realistic and validated mathematical liver model revels hepatobiliary transfer rates for Gd-EOB-DTPA using human DCE-MRI data. PLoS ONE. 2014;9(4):e92700.
5 Dahlqvist-Leinhard O, et al. Quantifying differences in hepatic uptake of the liver specific contrast agents Gd-EOB-DTPA and Gd-BOPTA: a pilot study. Eur Radiol. 2012;22(3):642-653.
6Karlsson M, et al. Nonlinear mixed-effects modelling for single cell estimation: when, why, and how to use it. BMC Syst Bio. 2014;9(1):52.
Figures