0436
Region-of-interest size of hepatic 2D MR elastography decreases with increasing R2* for gradient-echo but not spin-echo techniques1Liver Imaging Group, Department of Radiology, University of California, San Diego, San Diego, CA, United States, 2Computational and Applied Statistics Laboratory, University of California, San Diego, San Diego, CA, United States, 3Departments of Radiology, Medical Physics, Biomedical Engineering, Medicine, and Emergency Medicine, University of Wisconsin, Madison, Madison, WI, United States, 4NAFLD Research Center, Division of Gastroenterology, Department of Medicine, University of California, San Diego, San Diego, CA, United States
Synopsis
MR elastography (MRE) is an emerging technique for the non-invasive assessment of hepatic stiffness and fibrosis, and can be based on gradient-echo (GRE) or spin-echo (SE) acquisition. This study demonstrates that 2D-SE provides significantly larger reliable-wave-quality regions-of-interest (ROIs) than 2D-GRE at 3T. Additionally, 2D-GRE ROI sizes are negatively correlated with hepatic R2*, while 2D-SE ROI sizes are not associated with R2*. This suggests that 2D-SE may be the preferred MRE sequence at 3T and in patients with known iron overload.
Introduction
MR elastography (MRE) is an emerging technique for the non-invasive assessment of hepatic stiffness and fibrosis 1–3, and can be based on an underlying gradient-echo (GRE) or spin-echo (SE) acquisition. The source phase images require post-processing to produce wave displacement images, which in turn are processed by inversion algorithms to generate elastograms depicting the spatial distribution of the magnitude of the complex shear modulus (“stiffness”). Confidence masks are computed to depict portions of the elastogram with reliable wave data. Regions-of-interest (ROIs) are drawn in the liver within these portions of reliable data and the mean stiffness values are recorded. We hypothesized that higher R2* values would reduce the size of the 2D-GRE ROIs but not the 2D-SE ROIs, while higher stiffness values would increase the size of both 2D-GRE and 2D-SE ROIs. The purpose of this study was to assess the effect of R2* and hepatic stiffness on 2D MRE ROI sizes.Methods
This is a retrospective study of patients referred from hepatology and obesity clinics at our institution who underwent clinical MRE. Patients underwent 3T 2D-GRE and 2D-SE MRE for hepatic stiffness quantification, and confounder-corrected chemical-shift-encoded magnitude-based imaging for proton density fat fraction (PDFF) and R2* quantification. Continuous 60 Hz vibrations were introduced into the liver and MRE data was acquired. The standard MRE inversion algorithm was used to calculate shear stiffness maps 4, and a threshold value of 0.95 for the R2 goodness-of-fit parameter during data fitting was used to classify reliable and unreliable data. The largest possible adequate-wave-quality ROIs were placed while excluding large blood vessels and liver edges. ROI sizes and stiffness values were computed and recorded 5. As the data was right-skewed, non-parametric tests were used for statistical comparisons, and medians and inter-quartile ranges (IQR) were reported. Hepatic stiffness estimates and ROI sizes were compared between the two sequences using the Wilcoxon signed-rank test. For both MRE sequences, the correlation between the ROI sizes and stiffness values as well as the correlation between ROI sizes and R2* values was assessed using the Spearman’s rank correlation coefficient. A significance level of 0.05 was used for all statistical hypothesis testing.Results
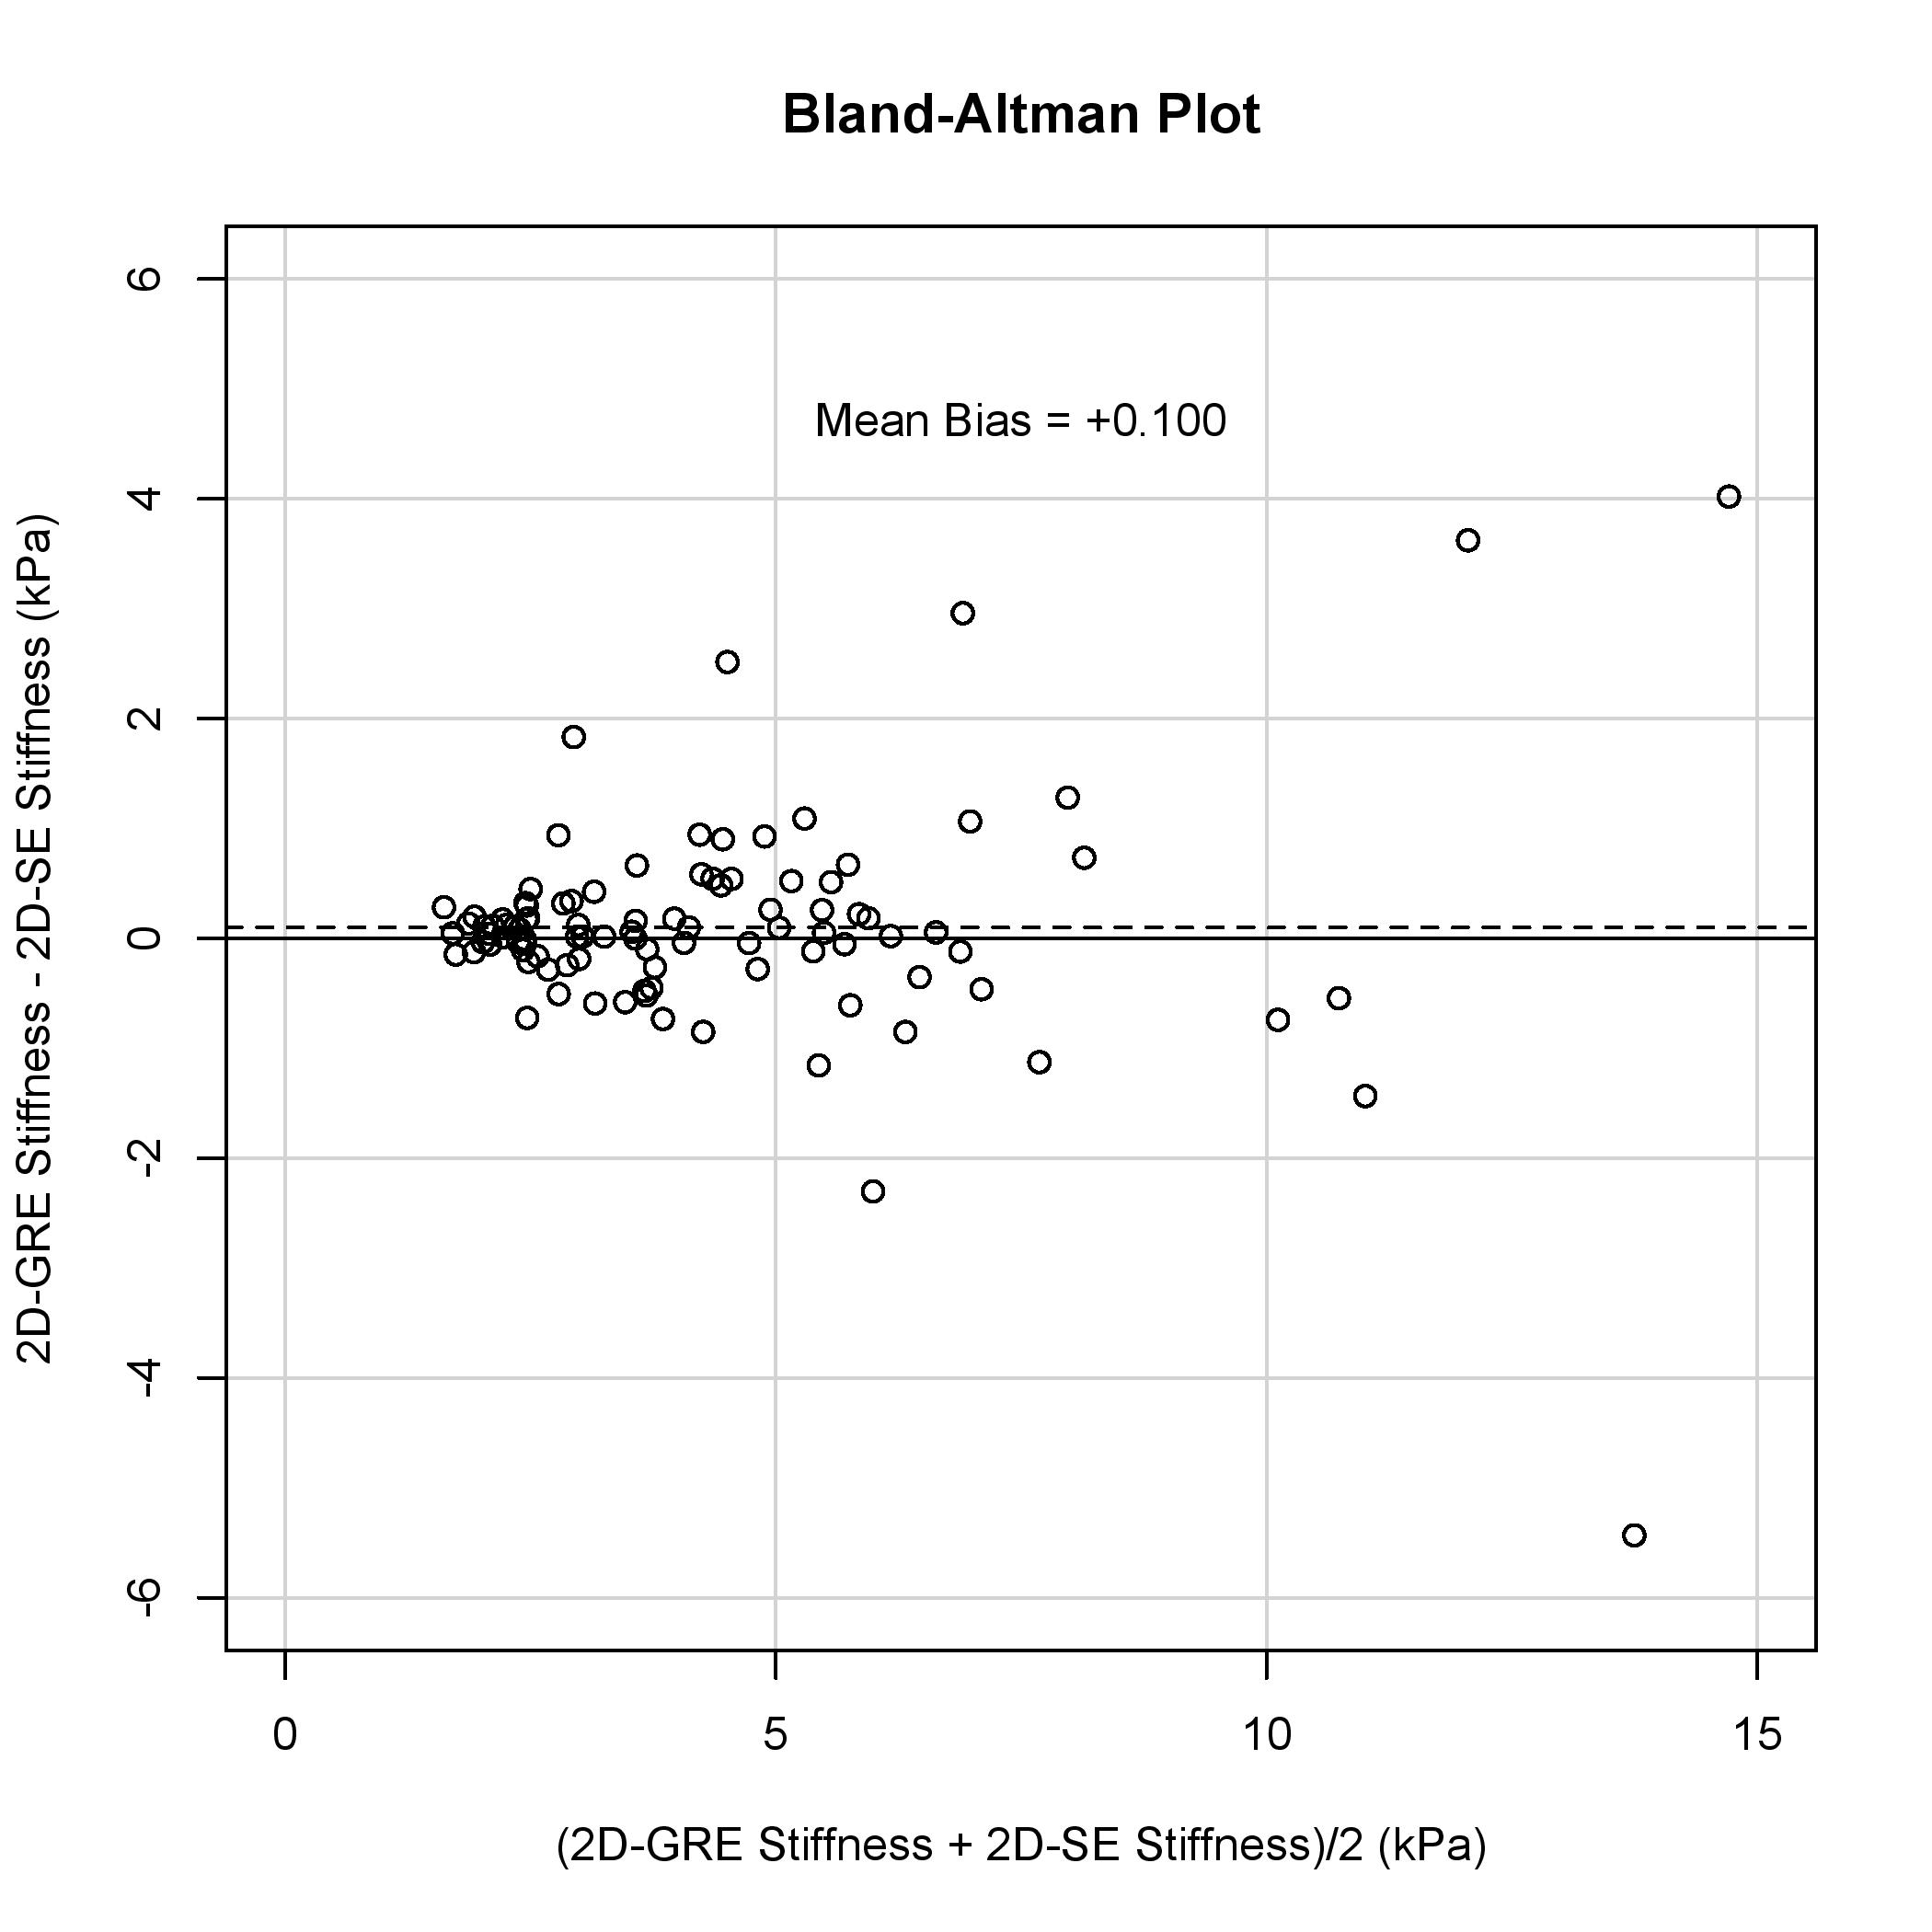
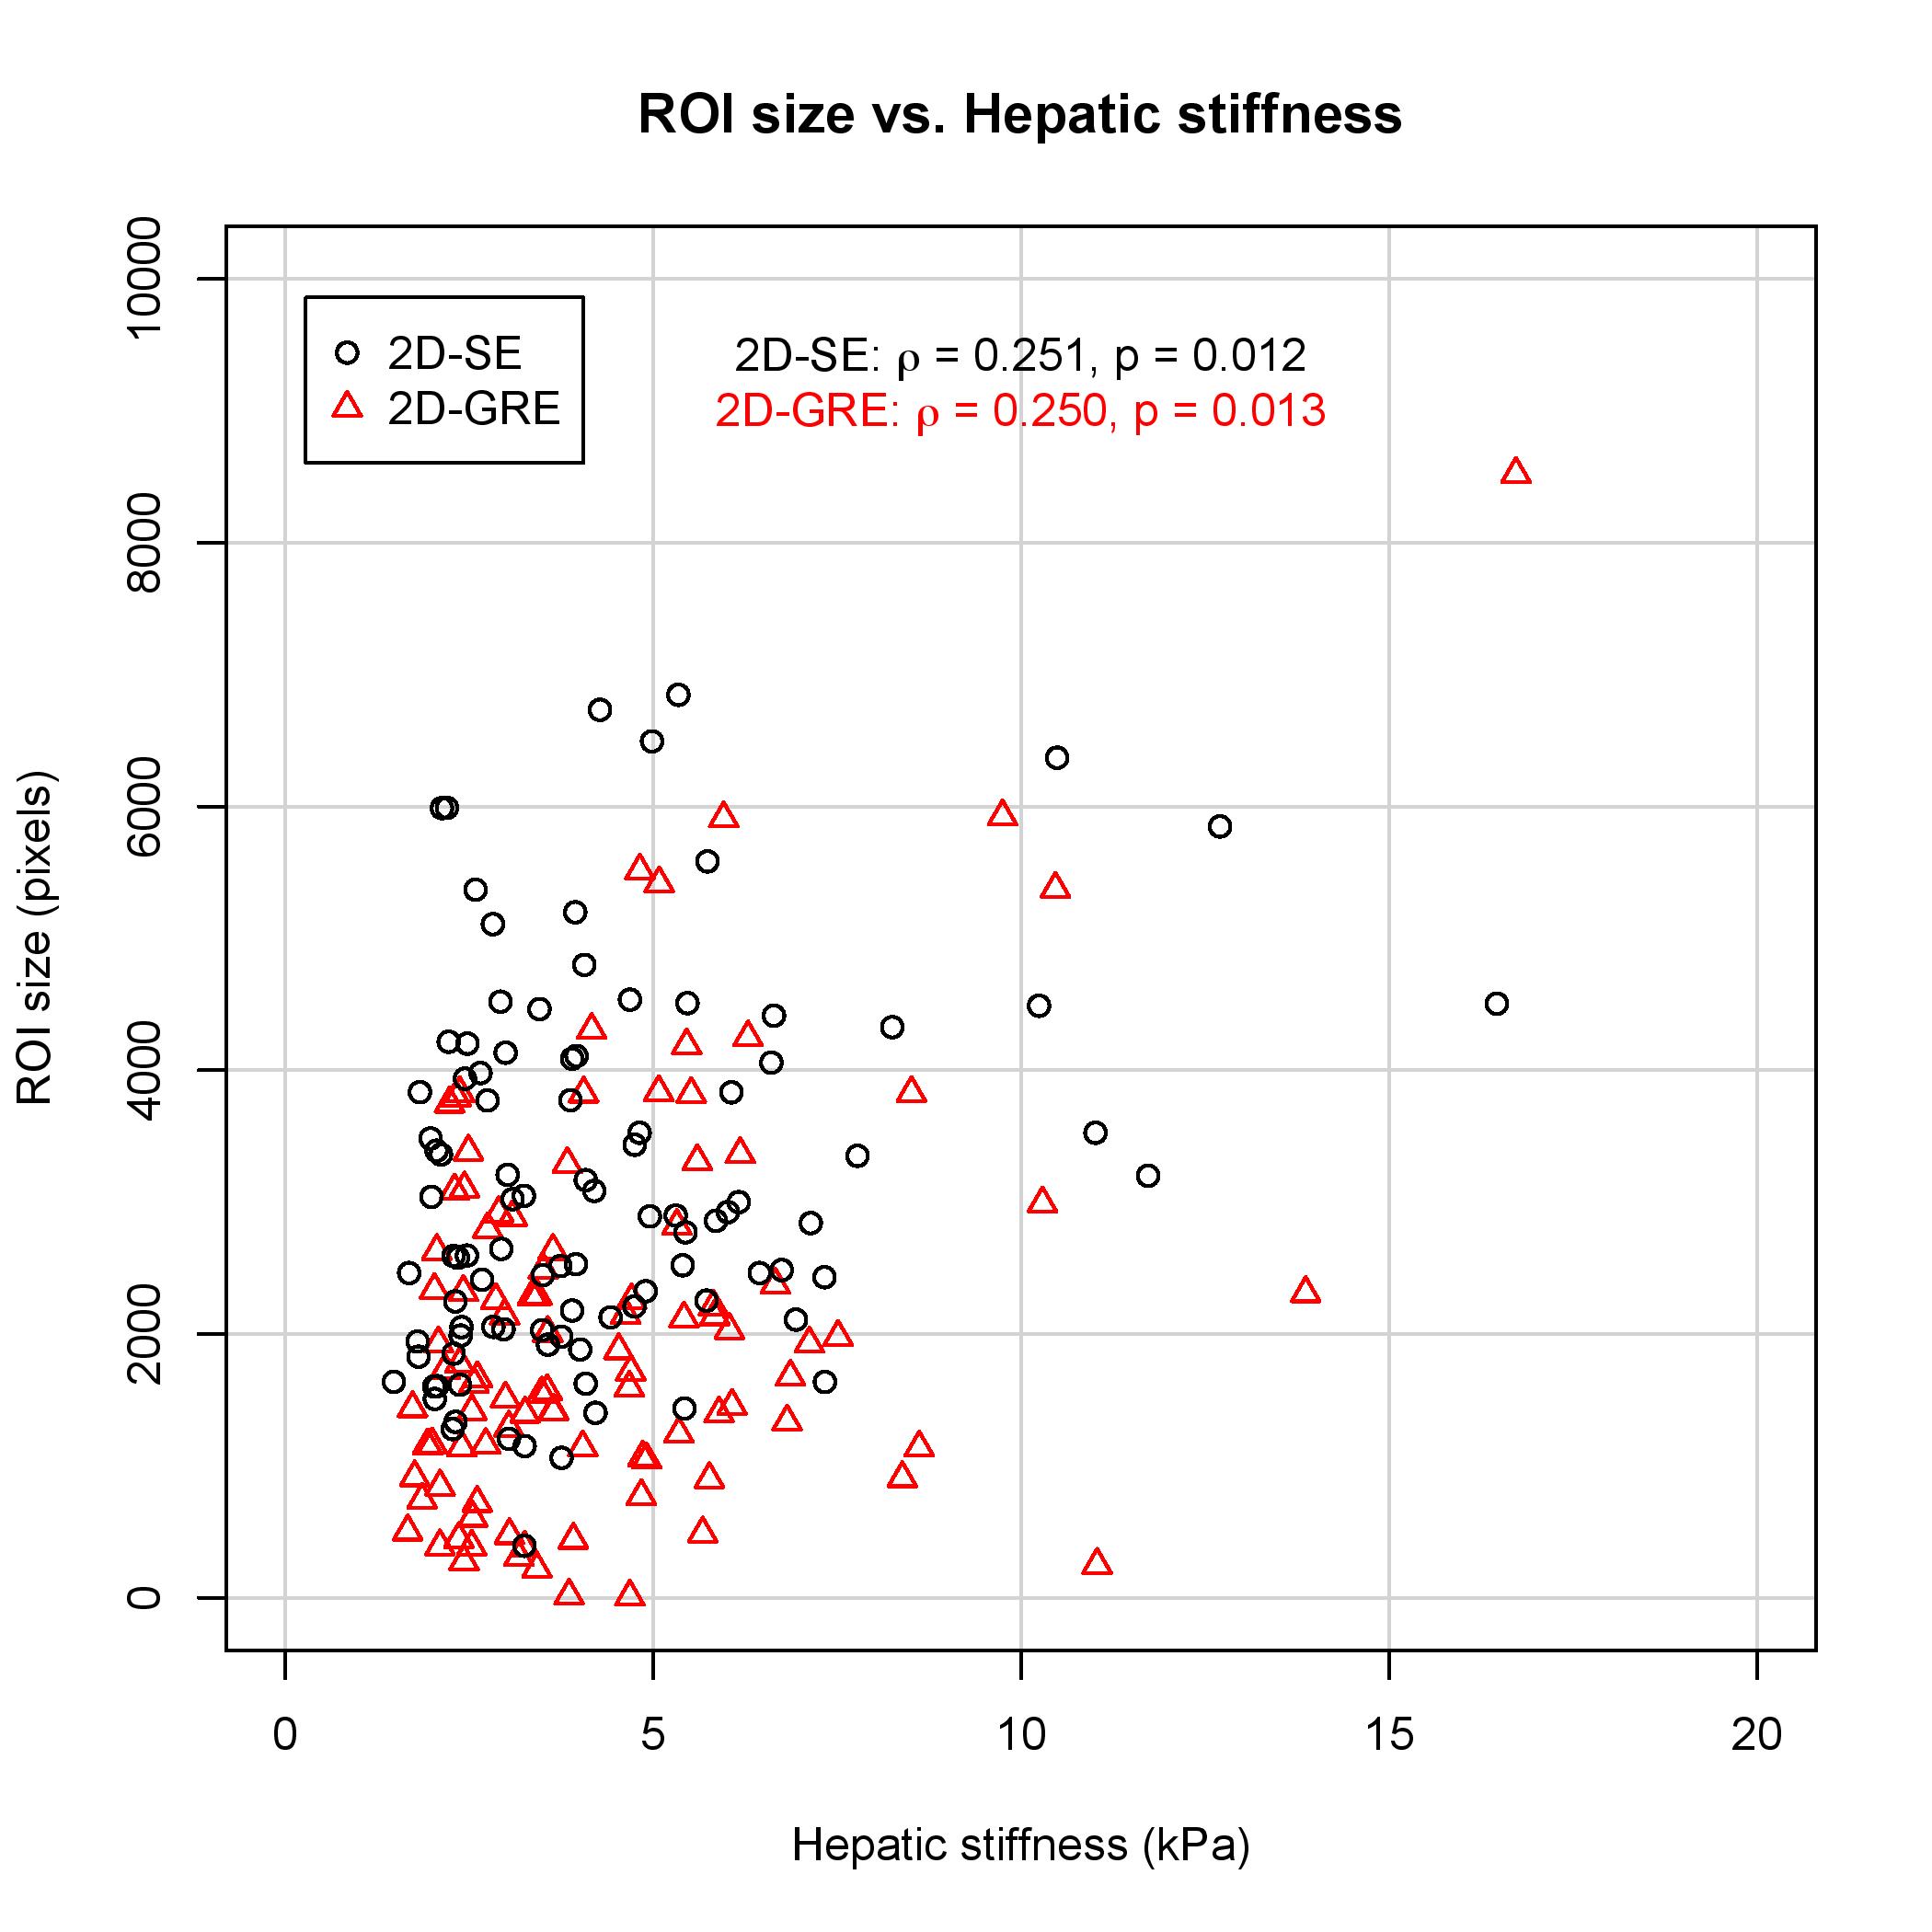
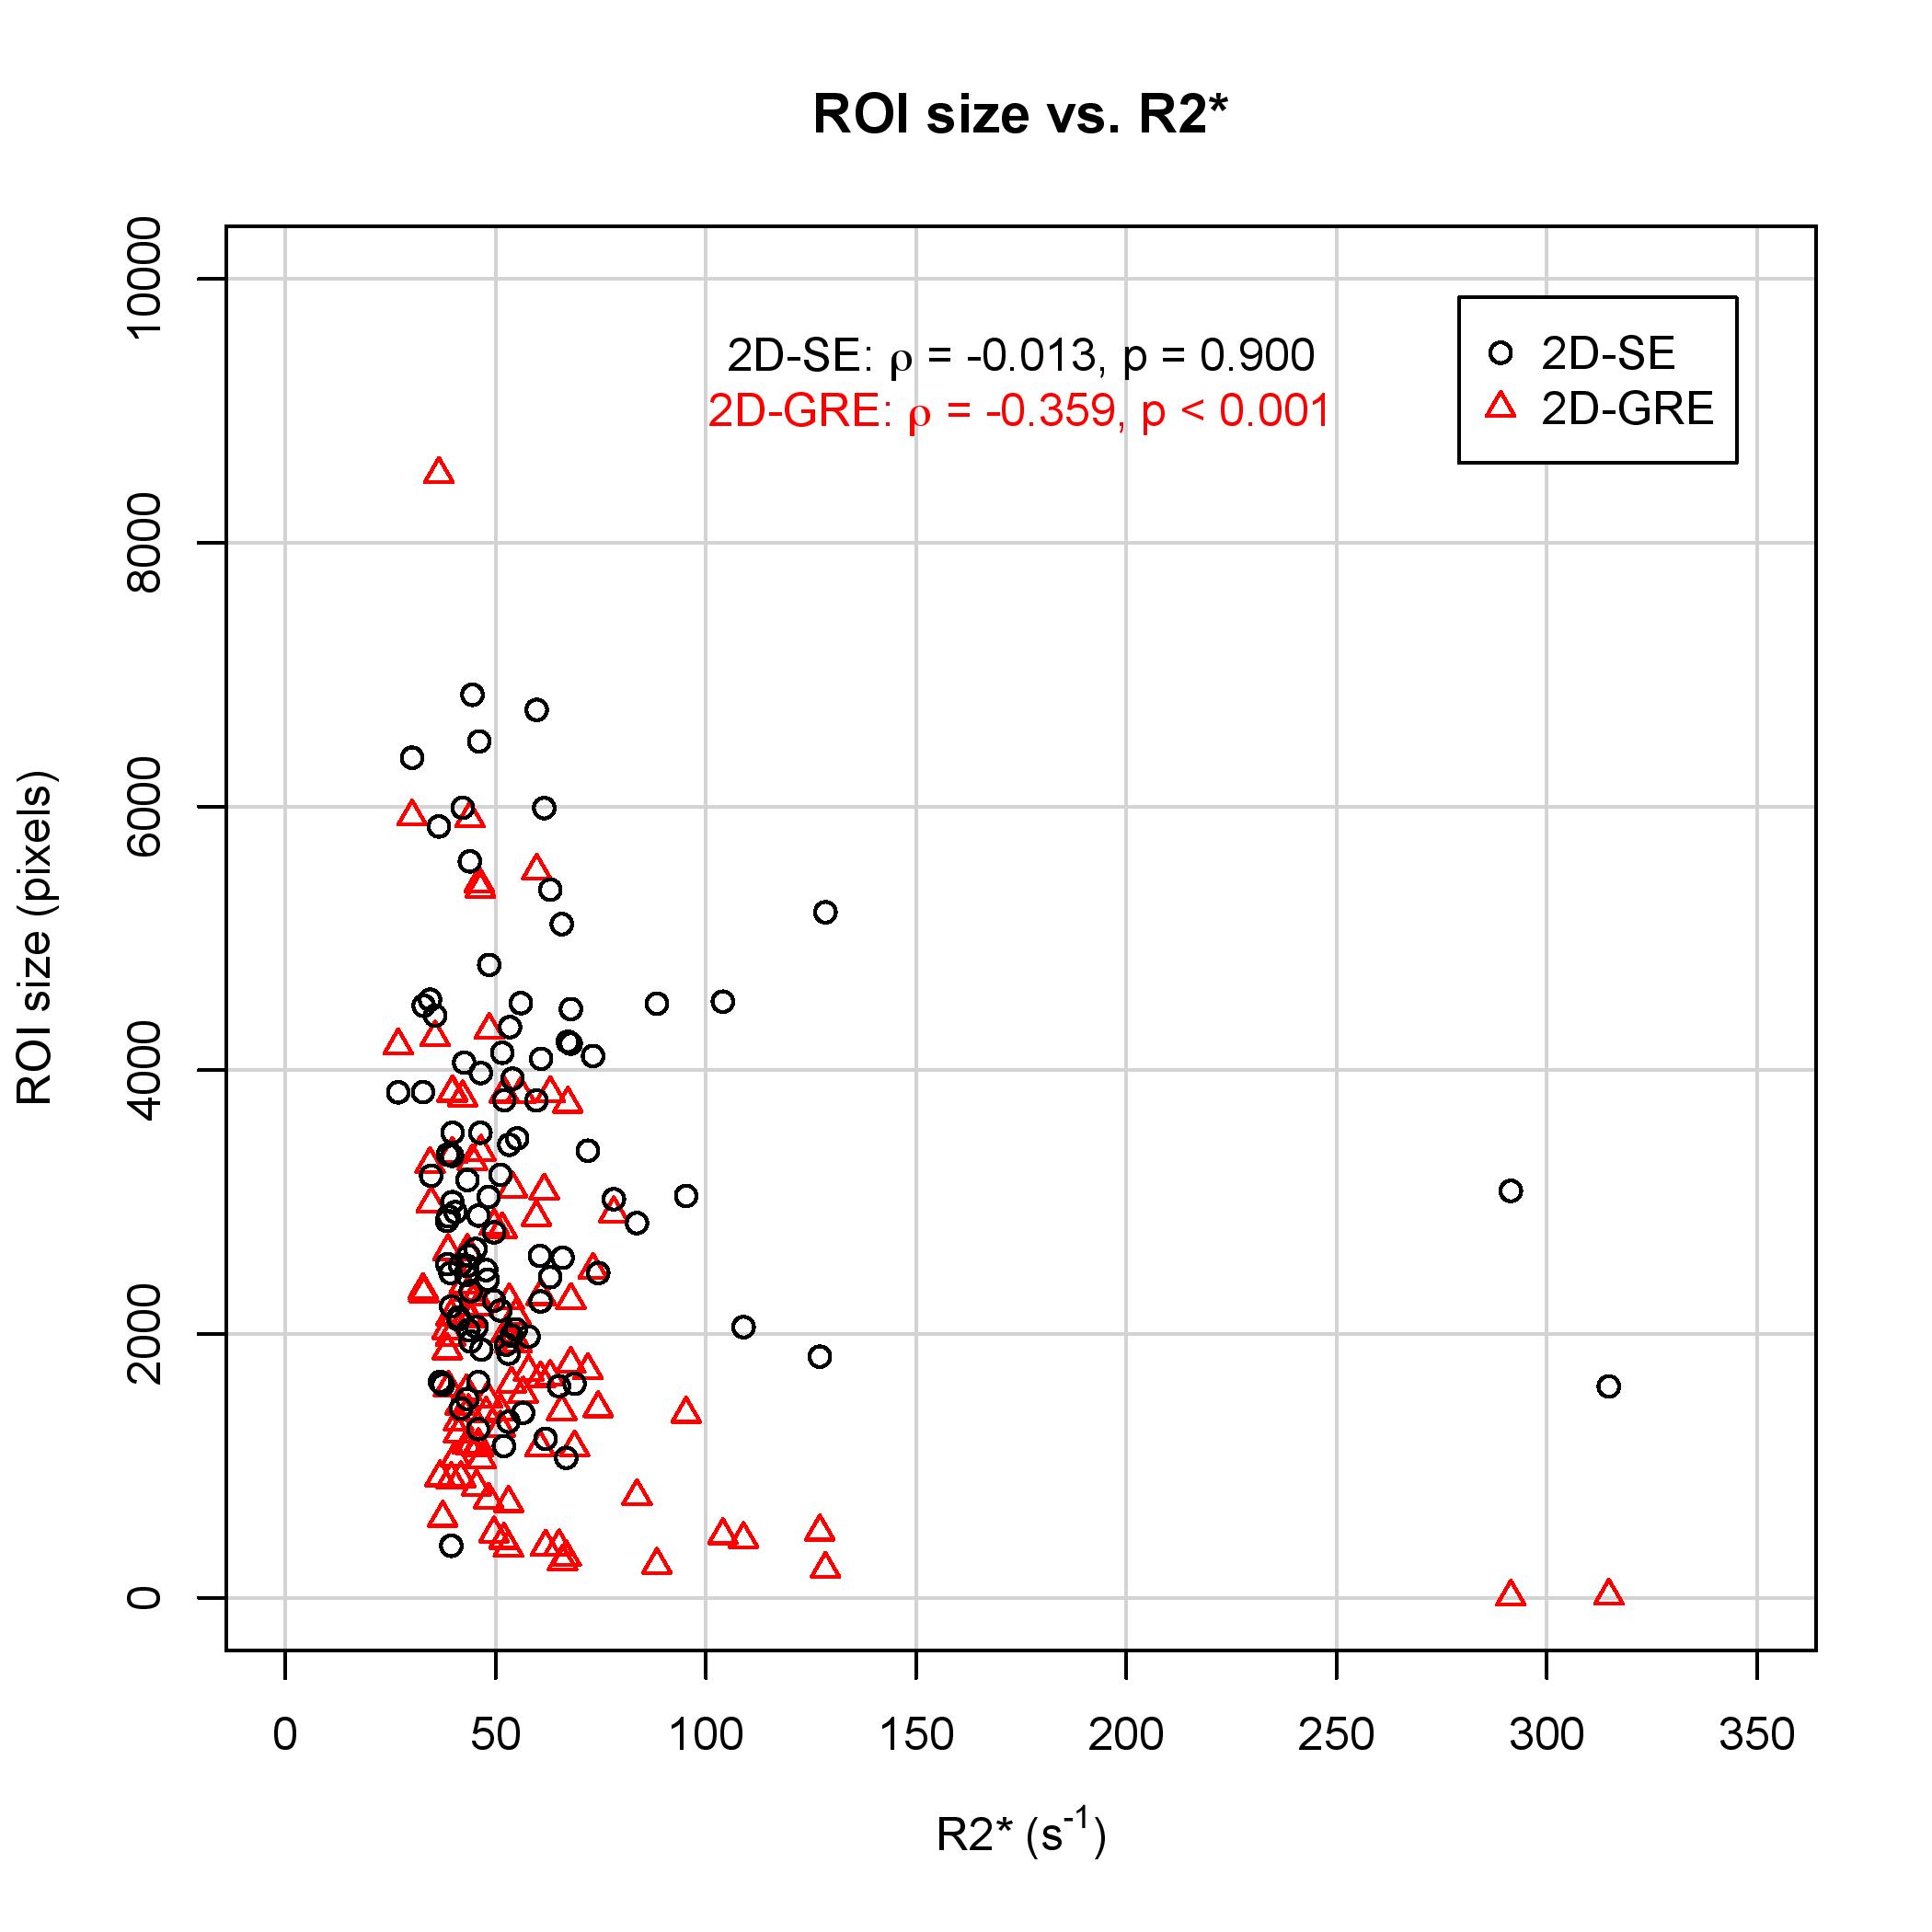
99 patients were included in this analysis (52 male, 47 female). The median stiffness measured by 2D-GRE and 2D-SE was 3.64 (IQR: 2.54 – 5.56) kPa and 3.75 (IQR: 2.46 – 5.41) kPa, respectively. The hepatic stiffness estimated by 2D-GRE was not significantly different from that estimated by 2D-SE (p = 0.191). Mean bias of the stiffness measurements between the two sequences was 0.100 kPa (Figure 1). ROI sizes were significantly associated with hepatic stiffness for both 2D-GRE (ρ = 0.250, p = 0.013) and 2D-SE (ρ = 0.251, p = 0.012) MRE (Figure 2). However, ROI sizes measured by 2D-SE were significantly larger than those measured by 2D-GRE (p < 0.001), as the median ROI sizes measured by 2D-GRE and 2D-SE was 1772 (IQR: 1139 – 2852) pixels and 2892 (IQR: 2053 – 4073) pixels respectively. The median R2* value among the population was 48.5 (IQR: 42.0 – 61.2) s-1. ROI sizes from 2D-GRE were negatively correlated with increasing R2* (ρ = -0.359. p < 0.001). However, ROI sizes from 2D-SE were not associated with R2* values (ρ = -0.013, p = 0.900). At higher R2* values (R2* > 100 s-1), the ROI sizes for 2D-GRE were only 7 – 502 pixels, whereas ROI sizes for 2D-SE was 1602 - 5198 pixels (Figure 3).Discussion
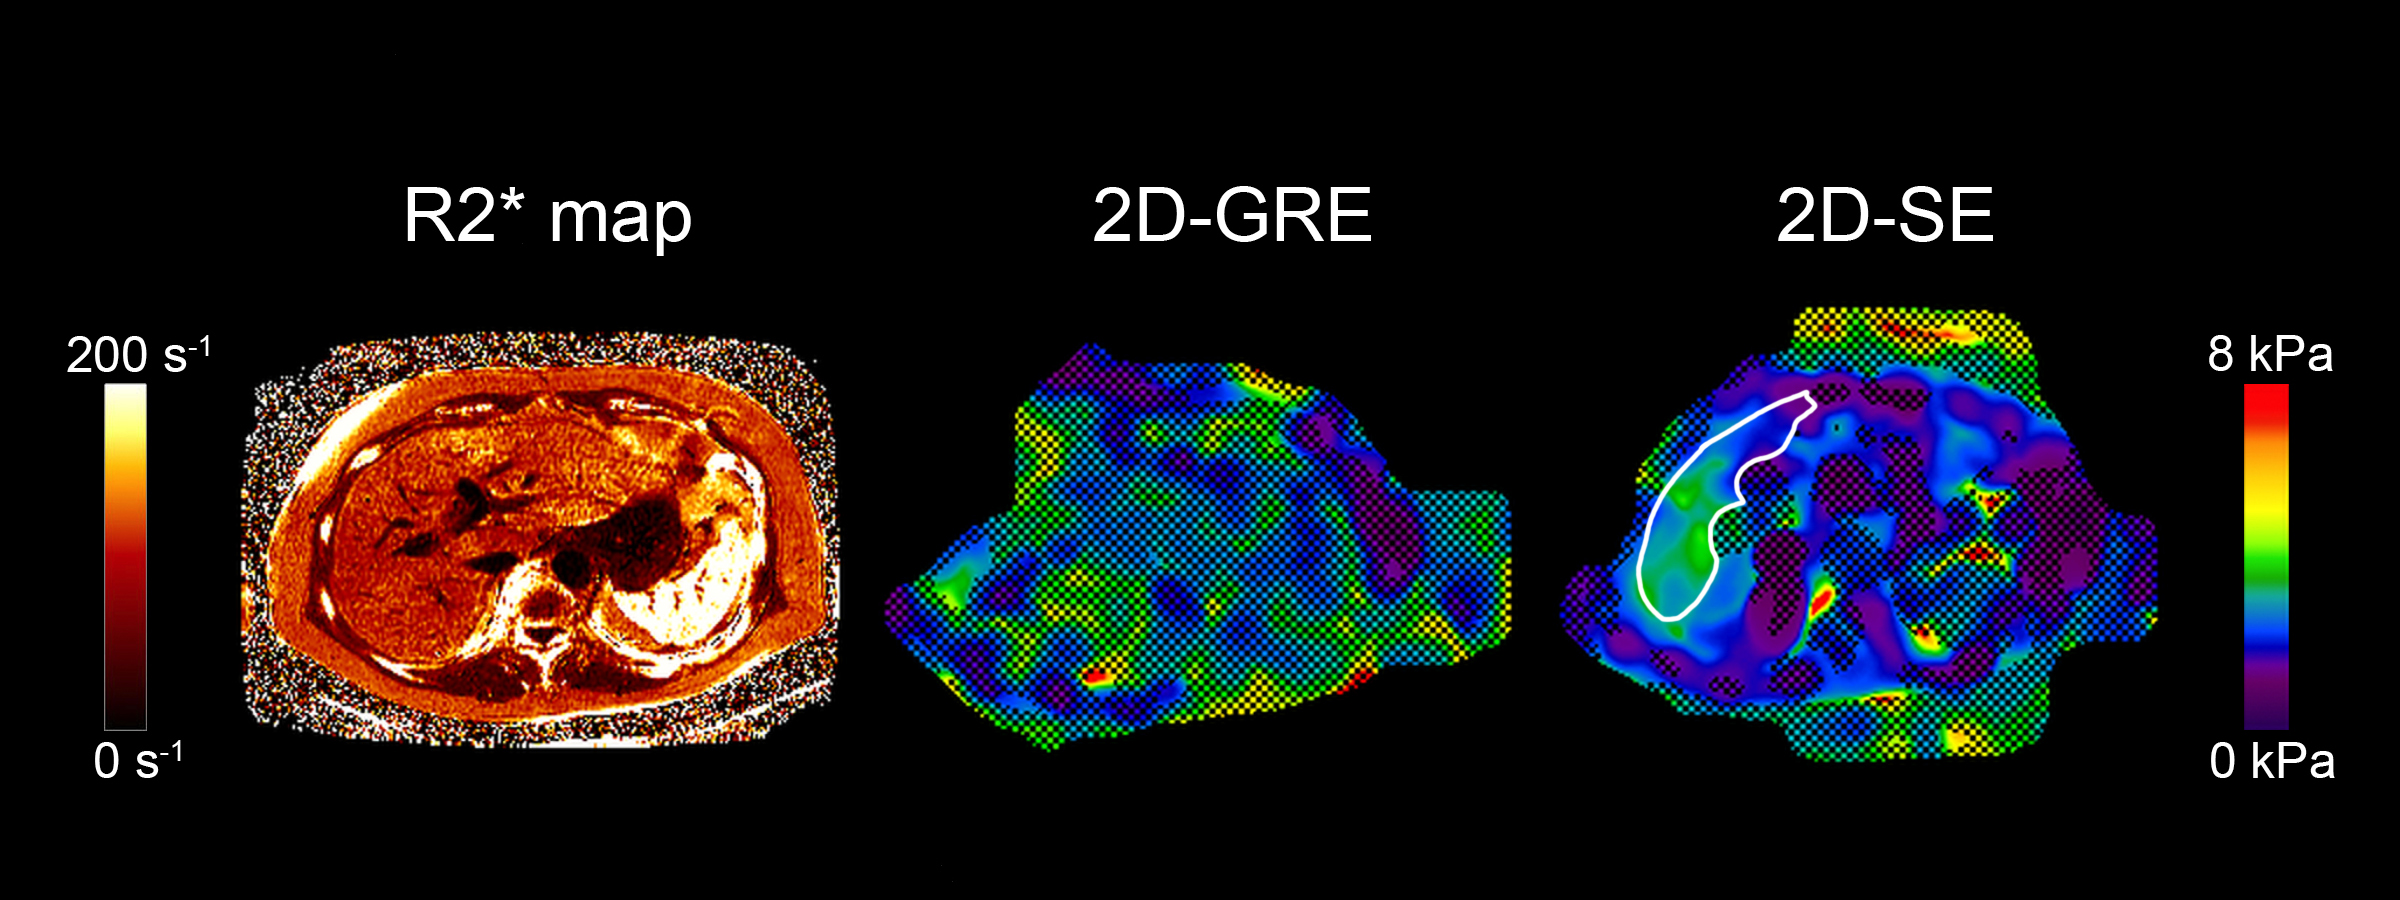
In this study, ROI sizes from 2D-GRE were negatively correlated with R2*. However, ROI sizes from 2D-SE were not correlated with R2*. Our results suggest that 2D-SE is a more robust technique for hepatic MRE than 2D-GRE, as it has larger adequate-wave-quality ROIs, and has the advantage of being insensitive to higher R2* values (Figure 4). This has practical implications in the patient population where MRE is clinically indicated, as iron-overload is associated with and can cause hepatic fibrosis. In these patients, 2D-SE-MRE may be able to obtain reliable data where 2D-GRE-MRE would not.Conclusion
2D-SE has larger adequate-wave-quality ROIs than 2D-GRE, especially at higher R2* values, at 3T. This suggests that 2D-SE may be the preferred MRE sequence at 3T.Acknowledgements
No acknowledgement found.References
1. Tang A, Cloutier G, Szeverenyi NM, Sirlin CB. Ultrasound Elastography and MR Elastography for Assessing Liver Fibrosis: Part 1, Principles and Techniques. Am J Roentgenol 2015;205(1):22–32.
2. Tang A, Cloutier G, Szeverenyi NM, Sirlin CB. Ultrasound Elastography and MR Elastography for Assessing Liver Fibrosis: Part 2, Diagnostic Performance, Confounders, and Future Directions. Am J Roentgenol 2015;205(1):33–40.
3. Loomba R, Wolfson T, Ang B, et al. Magnetic resonance elastography predicts advanced fibrosis in patients with nonalcoholic fatty liver disease: A prospective study. Hepatology 2014;60(6):1920–8.
4. Manduca A, Oliphant TE, Dresner MA, et al. Magnetic resonance elastography: non-invasive mapping of tissue elasticity. Med Image Anal 2001;5(4):237–54.
5. Dzyubak B, Glaser K, Yin M, et al. Automated liver stiffness measurements with magnetic resonance elastography. J Magn Reson Imaging 2013;38(2):371–9.
Figures