0432
4D flow MRI of Liver Hemodynamics: Influence of Velocity Encoding, Different Field Strength and Contrast Application on Visualization and Quantification of blood flowZoran Stankovic1, Bernd Jung1, Alan Arthur Peters1, Jelena Surla2, Edouard Semaan2, Michael Ith1, Johannes Heverhagen1, Michael Markl2, and Jeremy D. Collins2
1DIPR, Inselspital, University Hospital Bern, University of Bern, Bern, Switzerland, 2Radiology, Northwestern University, Chicago, IL, United States
Synopsis
4D flow MRI offers the possibility for complete volumetric and functional assessment of liver blood flow in patients with liver cirrhosis. This study reveals a significant difference when using a lower venc for visualization of the portal vein branches. Similar results are obtained for contrast application and different field strengths. For qualitative assessment of the intrahepatic branches by 4D flow MRI a lower venc is recommended.
Purpose
Liver cirrhosis patients tend to develop a hyperdynamic syndrome with increased splanchnic inflow and hepatic resistance. This leads to portal hypertension with decreased portal flow velocities1. The clinical gold standard for evaluation the liver hemodynamics is Doppler Ultrasound with known limitations of high inter-observer variability and volumetric coverage. 4D flow MRI represents a non-invasive and user-independent phase contrast MRI technique with three-directional velocity encoding. Recent publications show promising results for qualitative and quantitative assessment of the liver blood flow by 4D flow MRI2-4. The aim of this study was to evaluate the impact of velocity encoding, magnetic field strength and Gadolinium contrast media administration on 4D flow MRI image quality in the hepatic vasculature of patients and normal controls.Methods
The study cohort consisted of 10 patients (age=54±11years) with liver cirrhosis and 5 healthy controls (age= 54±9years). K-t GRAPPA accelerated 4D flow MRI acquisitions were applied to assess the arterial and portal venous hemodynamics of the liver. MRI scans were performed on 1.5T and 3T MR systems (AERA and SKYRA, Siemens Medical Systems, Erlangen, Germany). In order to reduce noise, ECG and respiratory gating was performed while acquiring an axial oblique 3D volume. Scans were performed with two different velocity encodings (venc=50cm/s and 100cm/s) as well as before and after application of a blood pool contrast (Ablavar©, Lanteus, N. Billerica, MA). Other parameters were as followed: spatial res.=2.5x2.1x3.0mm3, flip angle=7° and 15°, temporal res.=40.8ms, TE=2.7ms. The pre-processing included noise filtering, anti-aliasing and eddy current correction. A PC-MR angiogram was calculated from the 4D flow MRI data. The 3D PC-MRA data were imported to Mimics (Materialise NV, MI, USA) for manual 3D segmentation and visualization of visceral arterial, portal venous and hepatic venous systems (fig.1). Visualization assessment was performed by two independent readers evaluating the visibility of the PC-MRA, assessment of the number of portal vein branches and artery branches as well as the total image noise. The grading for the visibility of the PC-MRA was based on a three point scale: 0(not visible) – 1(partial visible) – 2(fully visible). The assessment of the vessel branches was as follows: 0(no branches) - 1(main stem) - 2(1st and 2nd order branches) - 3(more than 2nd order branches). Hemodynamic analysis included the calculation of peak velocities and net blood flow. In order to calculate statistically significant differences t-tests were applied and a p-value <0.05 was considered significant.Results
A total of n=78 4D flow MRI datasets were available for analysis (fig.2). Visualization of all arterial and portal venous vessels was successfully performed at 4D flow MRI with good inter-observer variability for arterial and portal venous (PV) liver hemodynamics. Both readers visualized significantly more intrahepatic portal venous branches with a venc of 50cm/s (p=0.007 reader A and p=0.001 reader B). No significant differences for visualization quality were found for contrast application and different field strength. Changes in venc resulted in significant improved visualization quality (p<0.01) and increased flow volume (15%, p<0.05) for the PV system. Contrast media application revealed 15% higher net flow volumes in the PV system (p<0.05), while peak velocity of the hepatic artery was 13% higher (p=0.035). Quantitative analysis of 4D flow MRI was feasible on 1.5T and 3T scanners with similar results. Only hepatic arterial net flow was measured 17% higher at 1.5 T compared to 3T (p=0.008). Significantly different blood flow parameters between patients and controls were found for flow volume in the PV system and the hepatic artery (p<0.05).Discussion
4D flow MRI is well suited to the qualitative and quantitative assessment of the complex liver hemodynamics enabling a quantitative balance of the blood flow resulting from the high-flow splanchnic arteries and the low-flow of the portal vein. Significant improvement of the visualization in the small intrahepatic portal venous branches was achieved when using a smaller venc of 50 cm/s as we expected. Surprisingly, there was no improvement in vessel visualization and had limited impact on quantification of liver hemodynamics by using a blood pool contrast agent or moving from 1.5 to 3T.Conclusion
Selection of the velocity encoding gradient, rather than the use of contrast or higher field strength, demonstrated the greatest effect on vascular visualization at 4D flow MRI. Further studies are needed to evaluate the impact of different venc on the quantifiable hepatic blood flow parameters.Acknowledgements
No acknowledgement found.References
1.Groszmann RJ. Hepatology. 1994;20:1359–1363. 2.Stankovic et al. Radiology. 2012;262:862-873. 3.Roldán-Alzate et al. J Magn Reson Imaging. 2013;37:1100-1108. 4.Stankovic et al. World J Gastroenterol. 2016; 22:89-102.Figures
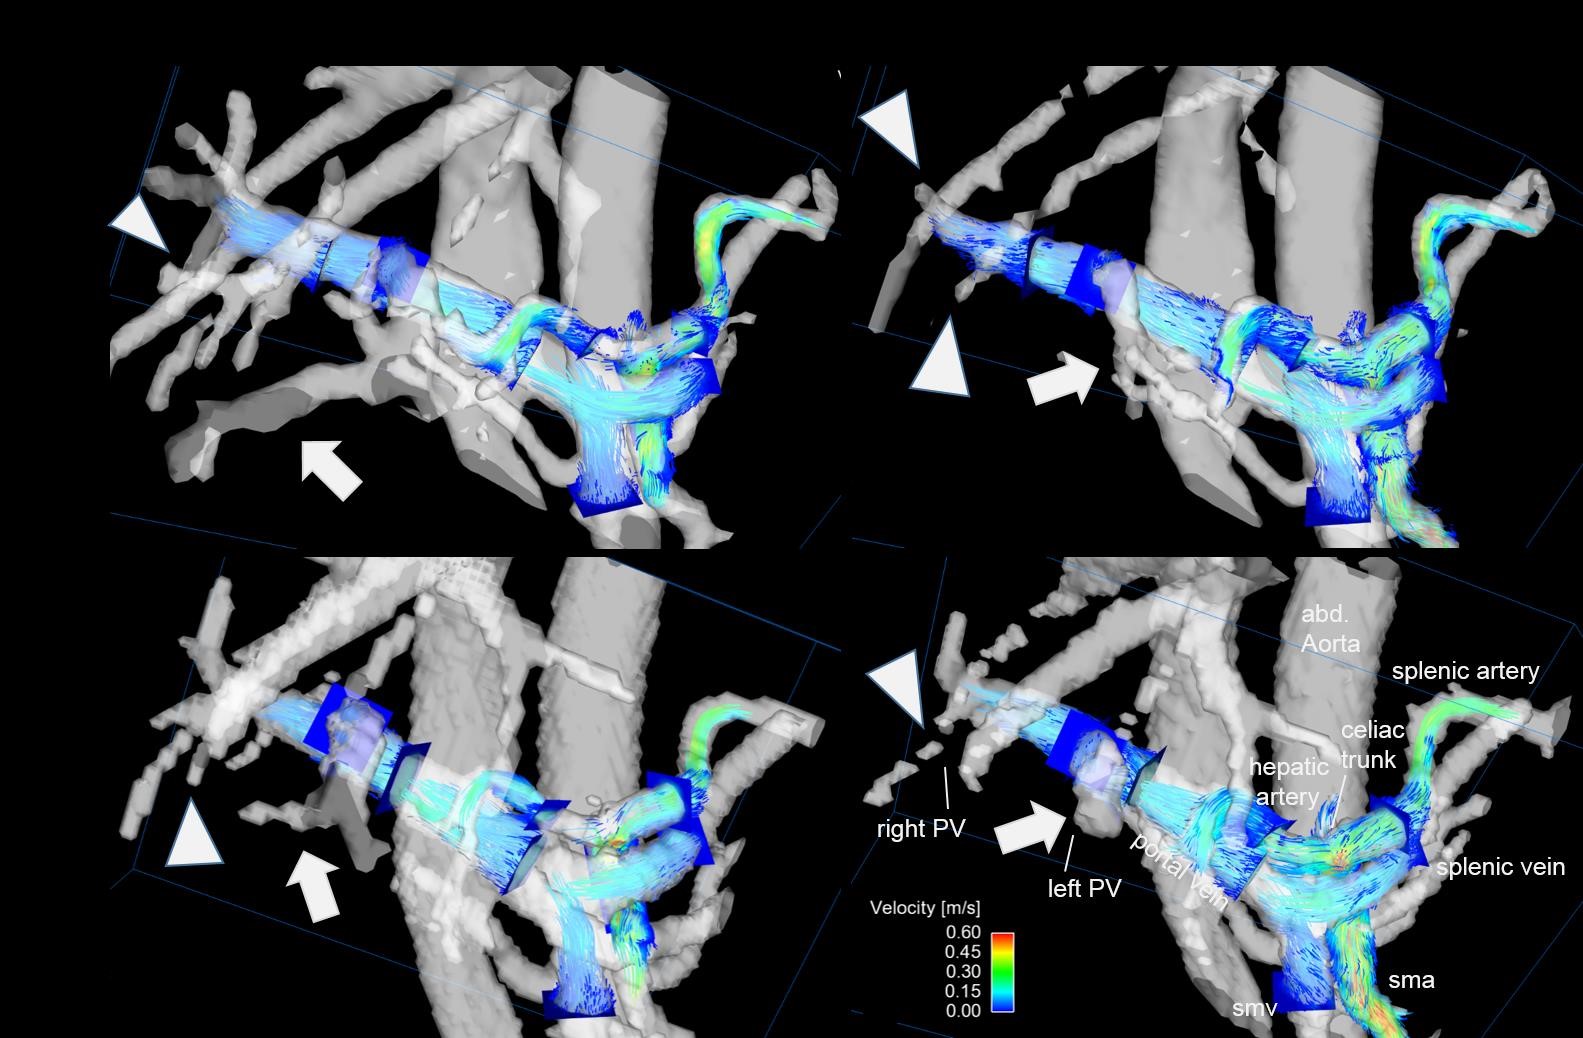
Figure 1: Visualization of hepatic
hemodynamics within the arterial and PV system in a patient with liver
cirrhosis using k-t GRAPPA accelerated 4D flow MRI with 3D particle traces and
ten analyses planes. The blue 2D analyses planes were manually positioned in
the PV and arterial systems. Left: Improved visualization quality of the portal
venous system, especially the small intrahepatic branches, using a velocity
encoding of 50 cm/s. Right: Impaired visualization quality using a velocity
encoding of 100 cm/s. No significant difference was seen between 1.5T and 3T.
arrowhead = right intrahepatic branches; arrow = left intrahepatic branches
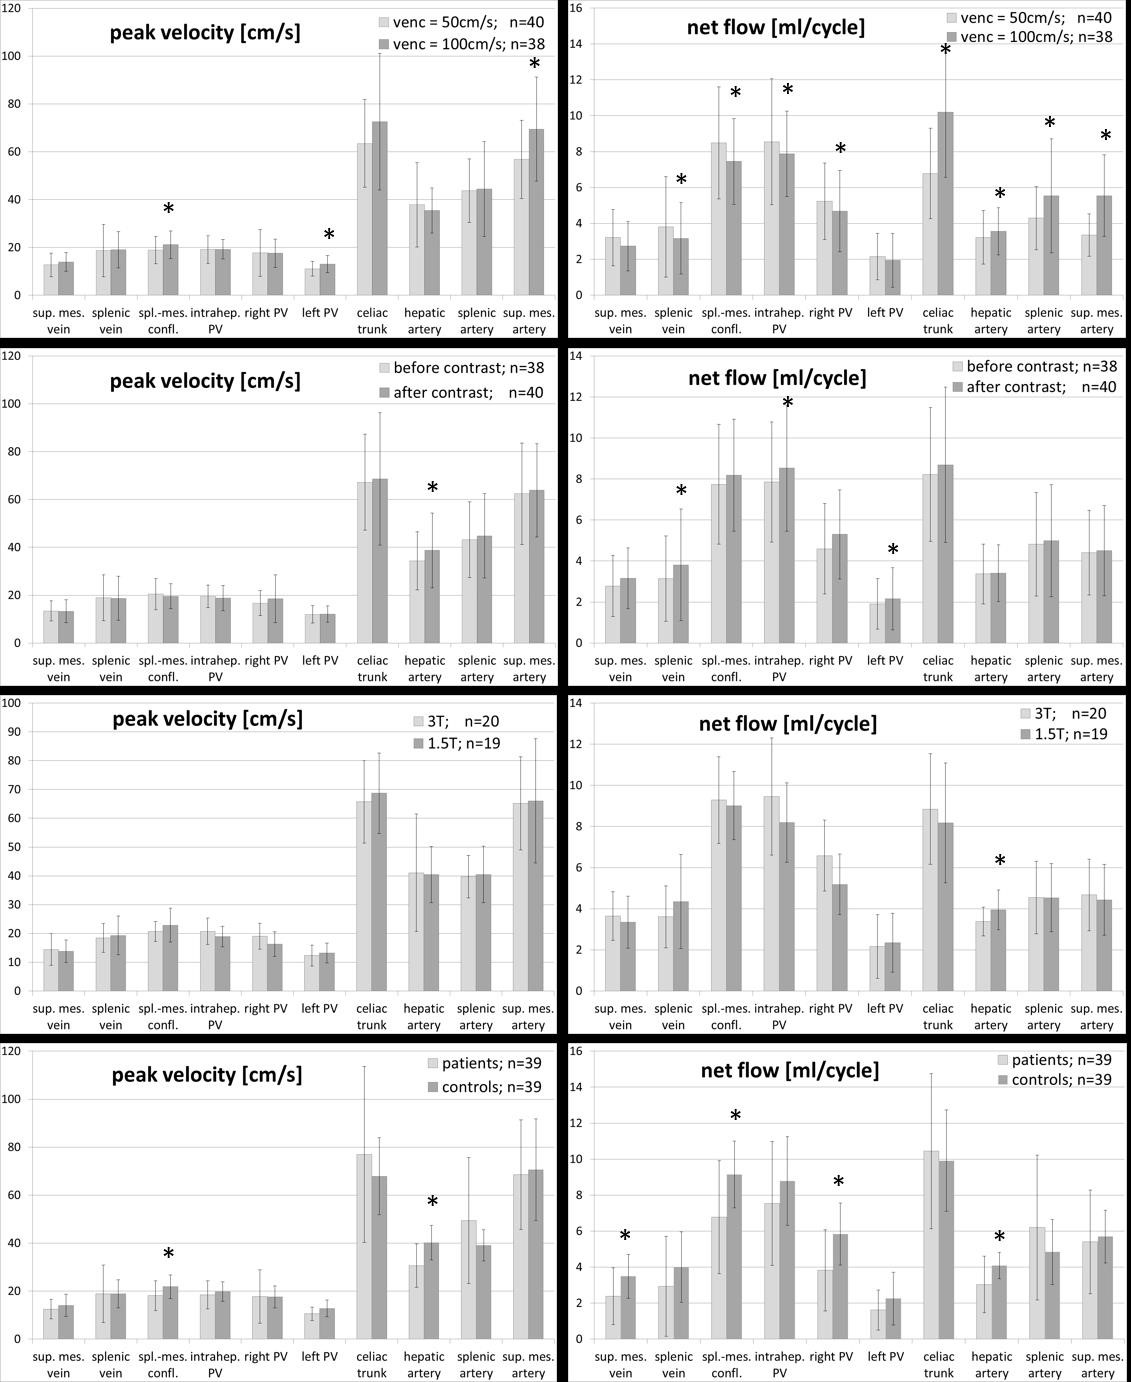
Figure 2: 4D flow MRI quantification
for all patients and controls (n=78) demonstrating peak velocity and flow
volume for different velocity encoding, contrast application, field strength
and patients with liver cirrhosis and controls. * = p<0.05 using
Wilcoxon-rank-sum test