0429
Detection of Advanced Liver Fibrosis and Cirrhosis using MR elastography compared to liver surface nodularity measurement, EOB-DTPA uptake and blood tests1Translational and Molecular Imaging Institute, Icahn School of Medicine at Mount Sinai, New York, NY, United States, 2Radiology, Groupe Hospitalier Pitié Salpêtrière, Paris, France, 3Pathology, Icahn School of Medicine at Mount Sinai, New York, NY, United States, 4Radiology, New York University Langone Medical Center, New York, United States, 5Radiology, University of Mississippi Medical Center, Jackson, MS, United States
Synopsis
This study compares the diagnostic performance of multiparametric MRI including qualitative and quantitative assessment of MR-elastography (MRE), liver surface nodularity (LSN) software measurement, hepatic enhancement ratios on Gd-EOB-DTPA (EOB-ER), and serum markers (APRI and FIB4) for the detection of liver fibrosis and cirrhosis. When comparing different MRI methods and serum markers with histologic findings, liver stiffness measured with MRE showed better performance than other methods for detection of advanced liver fibrosis and cirrhosis, especially when combined with blood tests (FIB4).
Purpose
The degree of liver fibrosis is commonly determined from liver biopsy, which represents the reference standard for diagnosis and is commonly used to assess prognosis and guide therapy in patients with chronic liver disease. However, liver biopsy is an invasive approach and has several limitations, including sampling errors and variability in assignment of pathological stage [1]. MRI has emerged as a multiparametric (mp) approach to diagnose and stage liver fibrosis allowing anatomical and functional information [2]. The purpose of this study is to compare the diagnostic value of mpMRI including qualitative and quantitative (LS: liver stiffness) assessment of MR Elastography (MRE), liver surface nodularity (LSN) software measurement, hepatic enhancement ratios on Gd-EOB-DTPA (EOB-ER), and serum markers (APRI: AST to Platelet Ratio Index and FIB4: Fibrosis-4 score) for detection of advanced liver fibrosis and cirrhosis.Methods
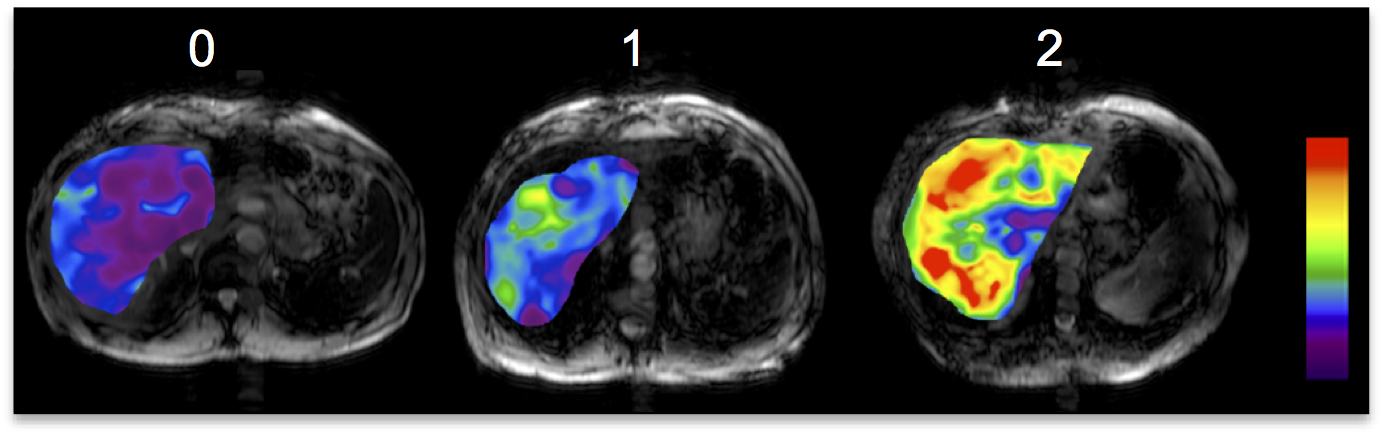
83 patients (M/F 59/24, mean age 58y) who underwent MRI including MRE within 1-year of liver biopsy/resection/transplant were included in this IRB-approved retrospective study. Regions of interest (ROI) were drawn to measure LS on MRE stiffness maps and EOB-ER T1weighted pre and post-contrast hepatobiliary phase images in 4 slices in the liver parenchyma. A recently developed semi-automated software (ImageIQ, Cleveland, Ohio) was used to generate LSN measurements [3], which automatically detects the liver edge on the selected ROI section and the distance between the detected liver edge and the spline is measured on a pixel-by-pixel basis, and the mean distance for each slice (expressed as 10th of a millimeter) is measured. A higher LSN score denotes a higher degree of surface nodularity. Two independent observers analyzed qualitative color-coded MRE maps using the following scoring system: 0=Normal, 1=Intermediate, 2=Advanced fibrosis or cirrhosis (Fig.1). ROC analyses were used to assess the utility of all techniques for detection of advanced fibrosis (F3) and cirrhosis (F4). A multivariable logistic analysis was performed to identify independent predictors of each outcome. Histopathology was used as the reference standard for all cases.Results
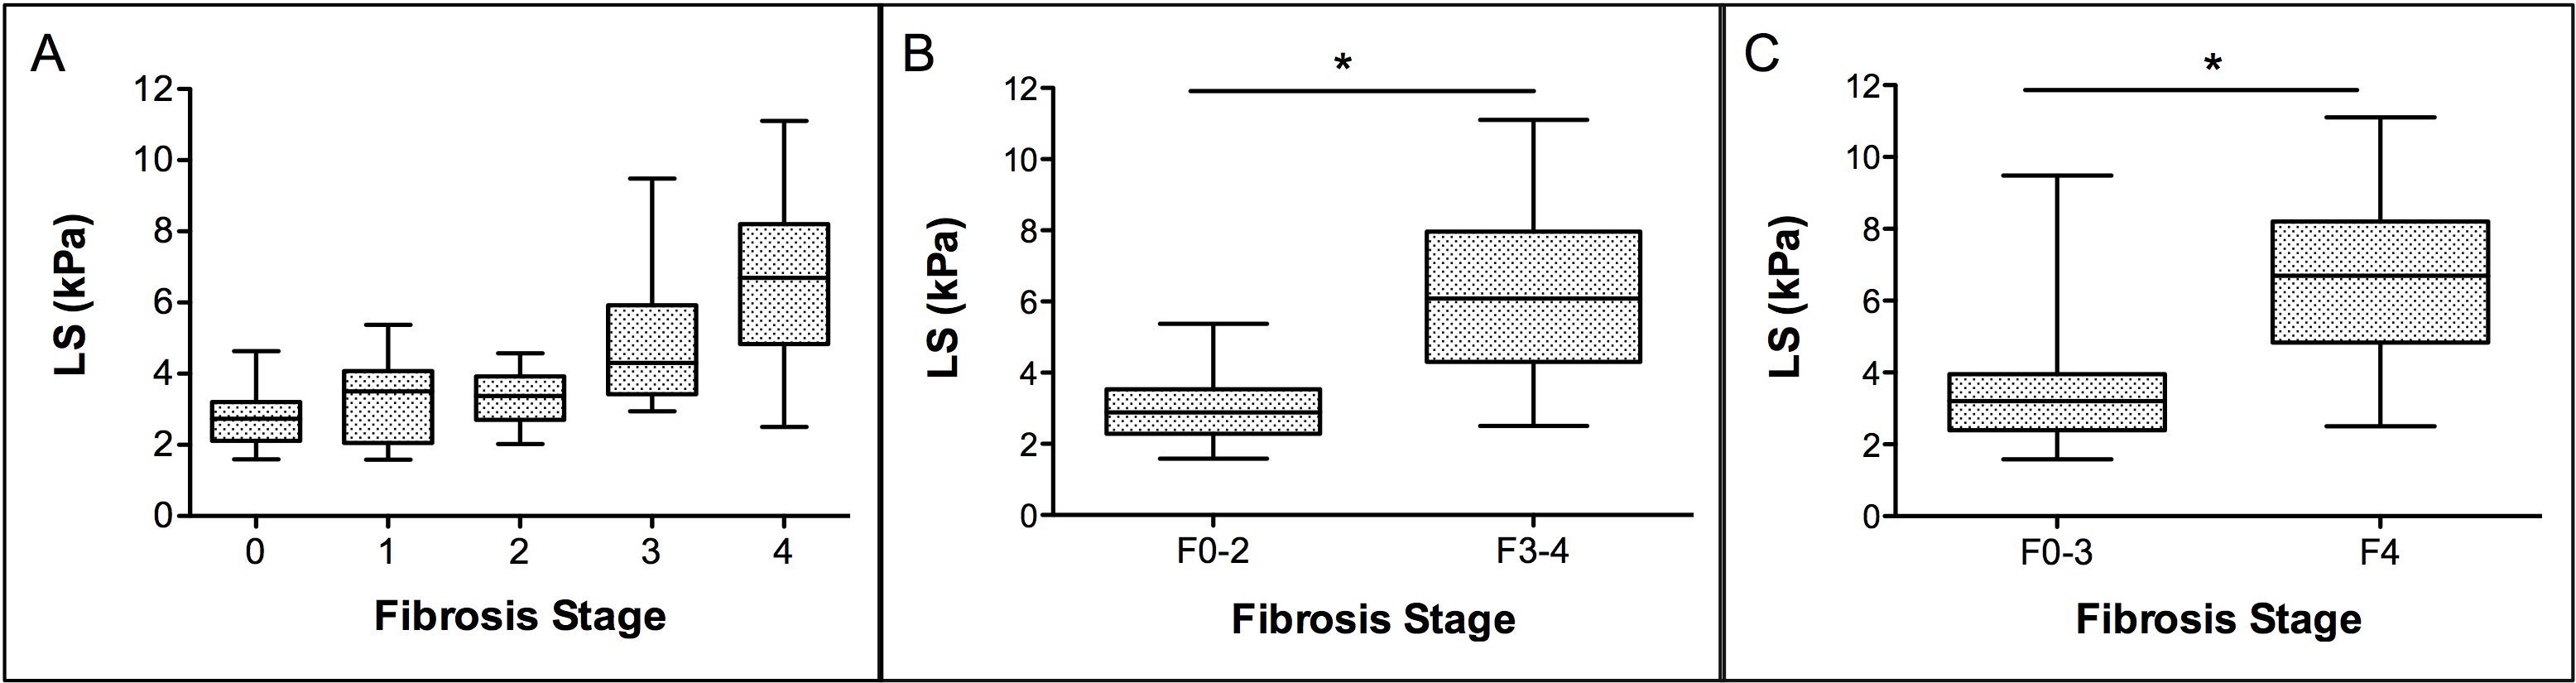
Fibrosis stage (METAVIR) distribution was F0 (n=20), F1 (n=9), F2 (n=9), F3 (n=12), and F4 (n=33). Comparison of parameters according to advanced fibrosis and cirrhosis subgroups showed significant differences for all parameters with the exception of EOB-ER (Table 1, Fig.2). LS yielded the highest diagnostic performance for detection of F3-F4 and F4 (AUC of 0.91 and 0.89 respectively, p<0.001) (Table 2). For detection of F3-F4, AUC of LS was significantly better than that of APRI, LSN, EOB-ER, FIB-4 and MRE-qualitative assessment from observer 2 (p=0.001-0.028), and borderline significant different than MRE-qualitative reading from observer 1 (p=0.059). For detection of F4, AUC of LS was significantly better than that of APRI, LSN, EOB-ER, and MRE-qualitative reading from observer 2 (p=0.001-0.017), and not significantly different than FIB-4 (p=0.068), and MRE-qualitative reading from observer 1 (p=0.233). The multivariable logistic analysis identified LS and FIB4 as independent predictors of F3-F4 and F4 yielding an AUC of 0.93 and 0.92 (p<0.001) respectively when combined.Discussion and Conclusion
Our results show that quantitative MRE yields the highest diagnostic performance compared to other tested methods for detection of advanced fibrosis/cirrhosis, especially when combined with blood tests (FIB-4). Similar observations have been made in previous studies comparing quantitative MRE against serum markers and advanced MRI functional methods for liver fibrosis characterization [4]. We also found acceptable accuracy for characterization of F3-F4 and F4 using qualitative assessment of the color-coded MRE map, which is the fastest method of analysis of MRE and to our knowledge has not been compared to quantitative MRE. The semi-automated LSN software used in this study is a new promising tool that can be applied to acquired images and can potentially avoid variability of subjective readings. This technique has been recently applied to CT images with excellent diagnostic accuracy for predicting cirrhosis (AUC of 0.91-0.959) [3, 5] with no reported data on MRI. Although, we found limited diagnostic accuracy for this technique when applied to MRI in our population, which might be explained in part by the larger pixel size of MR images compared to CT. In summary, LS measured with MRE is superior to other tested MRI parameters and serum markers for the non-invasive diagnosis of advanced liver fibrosis and cirrhosis.Acknowledgements
No acknowledgement found.References
1. Regev, A., et al., Sampling error and intraobserver variation in liver biopsy in patients with chronic HCV infection. Am J Gastroenterol, 2002. 97(10): p. 2614-8.
2. Hope, T.A., M.A. Ohliger, and A. Qayyum, MR Imaging of Diffuse Liver Disease: From Technique to Diagnosis. Radiol Clin North Am, 2014. 52(4): p. 709-724.
3. Smith, A.D., et al., Liver Surface Nodularity Quantification from Routine CT Images as a Biomarker for Detection and Evaluation of Cirrhosis. Radiology, 2016: p. 151542.
4. Dyvorne, H.A., et al., Prospective comparison of magnetic resonance imaging to transient elastography and serum markers for liver fibrosis detection. Liver Int, 2016. 36(5): p. 659-66.
5. Pickhardt, P.J., et al., Accuracy of Liver Surface Nodularity Quantification on MDCT as a Noninvasive Biomarker for Staging Hepatic Fibrosis. AJR Am J Roentgenol, 2016: p. 1-6.
Figures
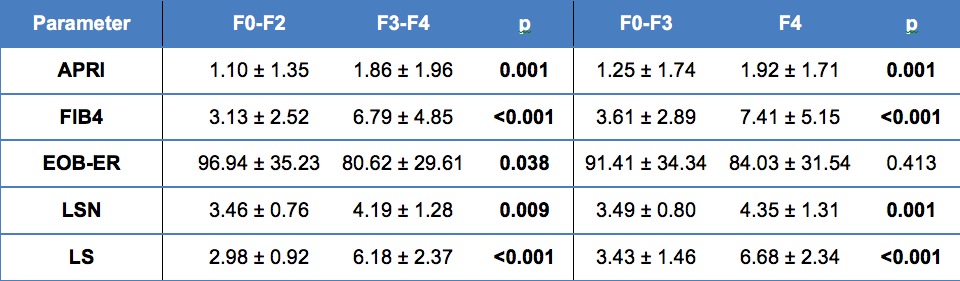
Table 1: Parameters from patients stratified by liver fibrosis stage. P values are from exact Mann-Whitney tests to compare the groups (significant p-values are bolded).
Serum markers (APRI: AST to Platelet Ratio Index, FIB4: Fibrosis-4 score), EOB-ER: hepatic enhancement ratios on Gd-EOB-DTPA, LSN: Liver surface nodularity, LS: liver stiffness measured with MR Elastography (MRE).
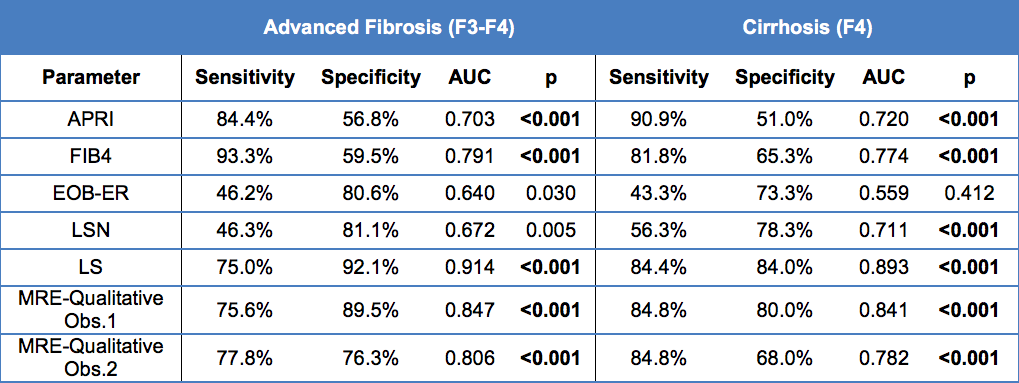
Table 2: Diagnostic performance of non-invasive MRI modalities and serum markers (APRI and FIB4) for detection of advanced liver fibrosis (≥ F3) and cirrhosis (≥ F4). Significant p-values are bolded.
Serum markers (APRI: AST to Platelet Ratio Index, FIB4: Fibrosis-4 score), EOB-ER: hepatic enhancement ratios on Gd-EOB-DTPA, LSN: Liver surface nodularity, LS: liver stiffness measured with MR Elastography (MRE).