0428
Assessment of liver function using an uptake ratio based on multiple-time points hepatocyte mapping1MR Clinical Science, Philips Healthtech, Tokyo, Japan, 2Department of Central Radiology, Kumamoto University Hospital, Kumamoto, Japan, 3Department of Diagnostic Radiology, Faculty of Life Sciences, Kumamoto University, Kumamoto, Japan
Synopsis
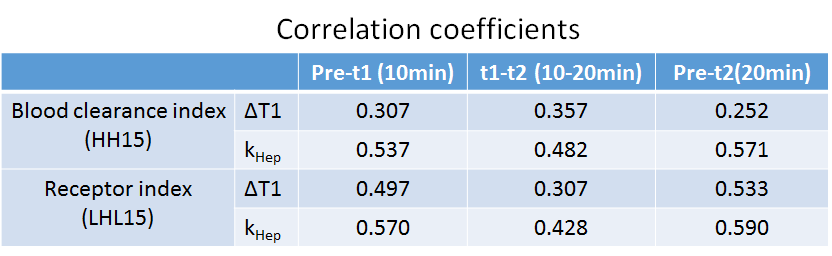
We calculated the uptake fraction (kHep) based on a pharmacokinetics model of gadolinium ethoxybenzyl-diethylenetriamine pentaacetic acid (Gd-EOB-DTPA) uptake using R1 changes in the hepatocyte. The kHep and ΔT1 values were compared to indexes determined by 99mTc-GSA scintigraphy for three different scan time points. The correlation coefficients of the blood clearance indexes (HH15) and receptor indexes (LHL15) were 0.307 and 0.497 for the ΔT1 and 0.537 and 0.570 for kHep values, respectively. The results indicate that the proposed quantification value of kHep is a more robust index for liver function compared with the ΔT1 value.
Purpose
Assessment of liver function using Gd-EOB-DTPA has been reported as a promising method for the characterization of liver function. Some studies measured T1 or ΔT1 value changes of the liver parenchyma as markers after Gd-EOB-DTPA injection1,2. We demonstrated the usefulness of a new method to quantify the hepatocyte fraction based on simple pharmacokinetics3 and measurement of R1 changes (ΔR1) in the liver and the spleen in this meeting last year4,5. In this study we propose an index of uptake function based on the calculated ΔR1 in the hepatocyte for multiple time-points. We investigate the correlation of this hepatic uptake index with indexes obtained using Technetium-99m galactosyle-serum-albumin-scintigraphy (99mTc-GSA) and with ΔT1 values of the liver parenchyma.Materials and Methods
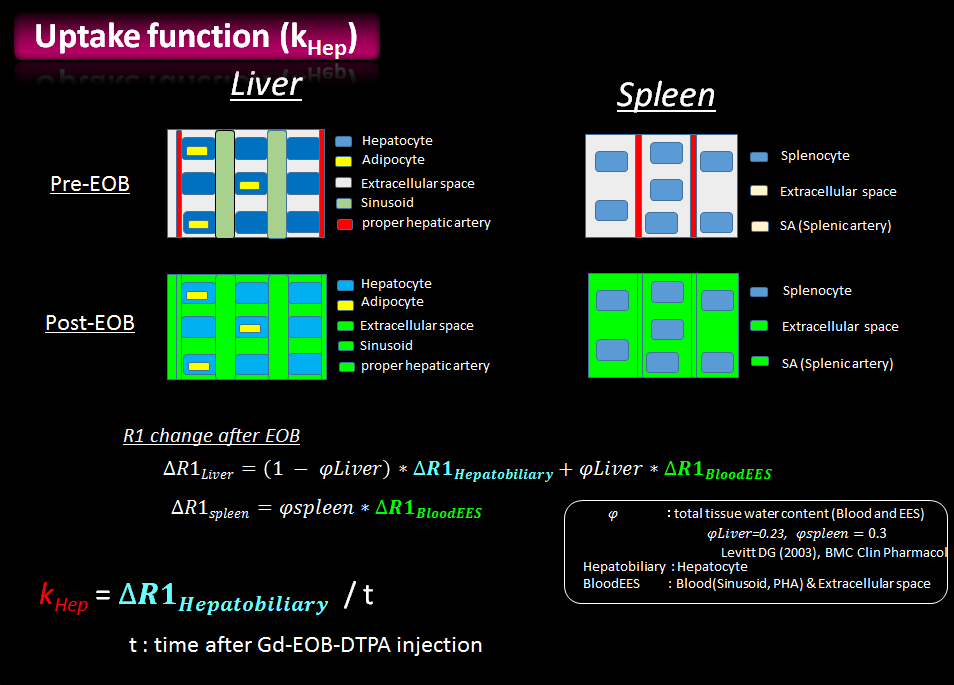
For the assessment of the proposed index of the uptake function based on the R1 change in the hepatocyte, a two-compartment model of the liver and spleen was used in this study4,5. The Gd-EOB-DTPA induced signal change in the liver and spleen between pre- and post-contrast injection is illustrated in Figure 1. The R1 values of the liver and spleen were measured pre- and post-contrast administration; subsequently, ΔR1 in the hepatocyte was calculated. The uptake function (kHep) is defined as follows:
kHep = ΔR1Hep / t
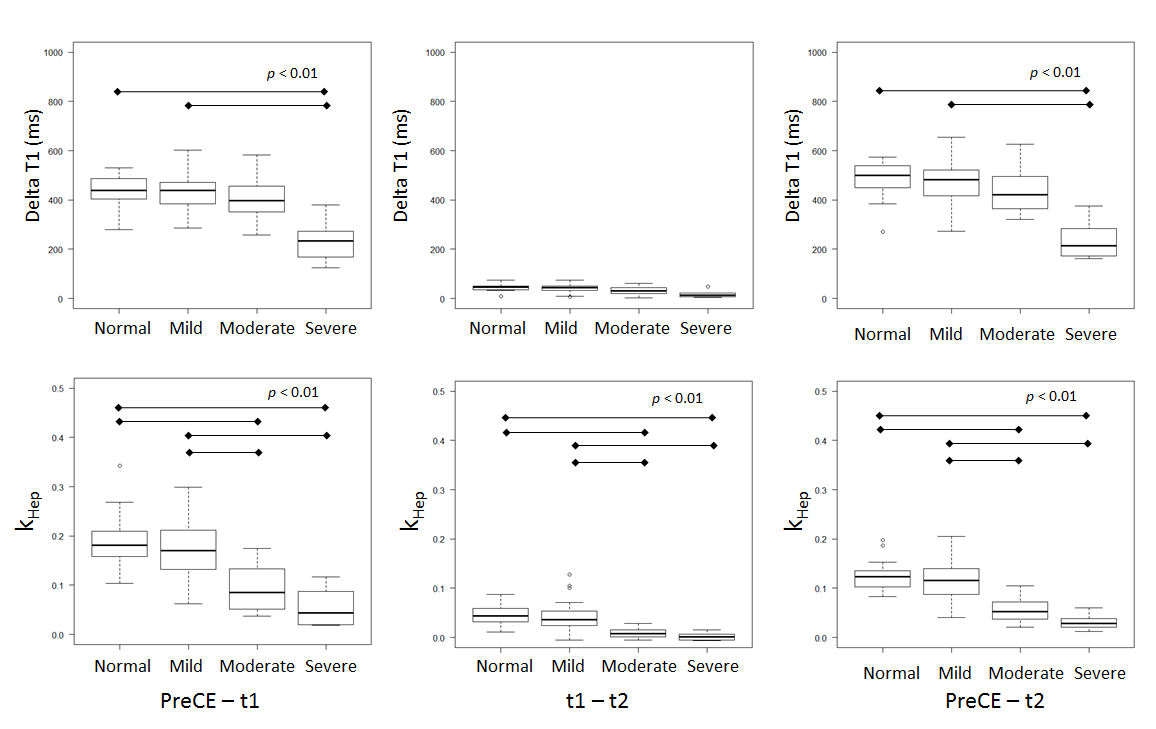
Here, t represents the time in minutes after the Gd-EOB-DTPA injection. Seventy-five patients underwent 99mTc-GSA scintigraphy, with measurements of their blood clearance indexes (HH15) and receptor indexes (LHL15). The patient criteria were classified into four severity levels: Normal (n=19), Mild (n=43), Moderate (n = 8), and Severe (n=5). These patients were then scanned using a 3T scanner (Achieva TX, Philips Healthcare). The ΔR1 value of the liver and spleen were measured at pre- and post-contrast administration. The post-contrast measurement was conducted twice—at ten min (t1 defined as 8 to 12 min) and at the hepatobiliary phase (t2 defined as 17 to 22 min)—after the injection. The ΔT1 and kHep values were calculated for the pre-injection and t1, the t1 and t2, and the pre-injection and t2 time intervals. The R1 map was calculated from the Look-Locker sequence using the following scan parameters: TE/TR=1.7/7 ms, 1.37×1.37×8 mm, FA=7, single-slice, shot interval=5 sec, SENSE factor=2, and scan time=20 sec with breath holding. Finally, the ΔT1 and kHep values of each severity level were compared statistically using the Kruskal-Wallis method, and were compared with the LHL15 and HH15 indexes. A p value < 0.01 was considered to be indicate significance.
Results
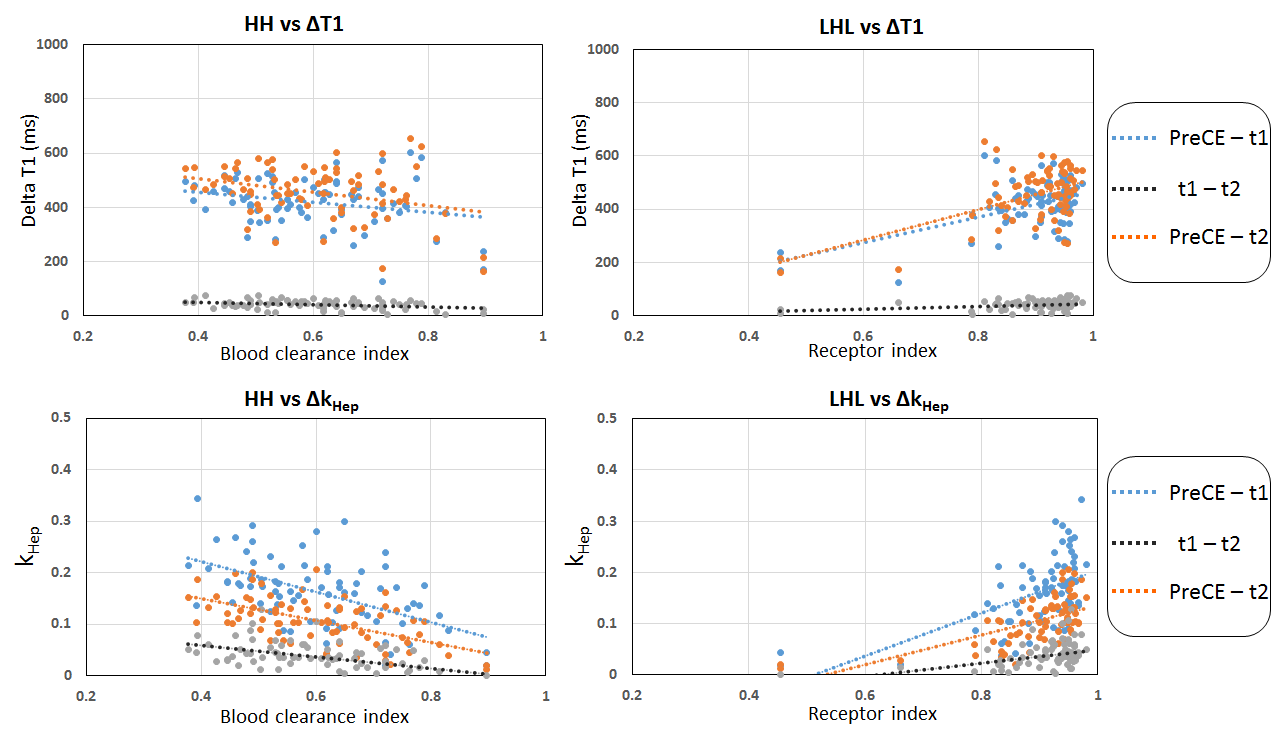
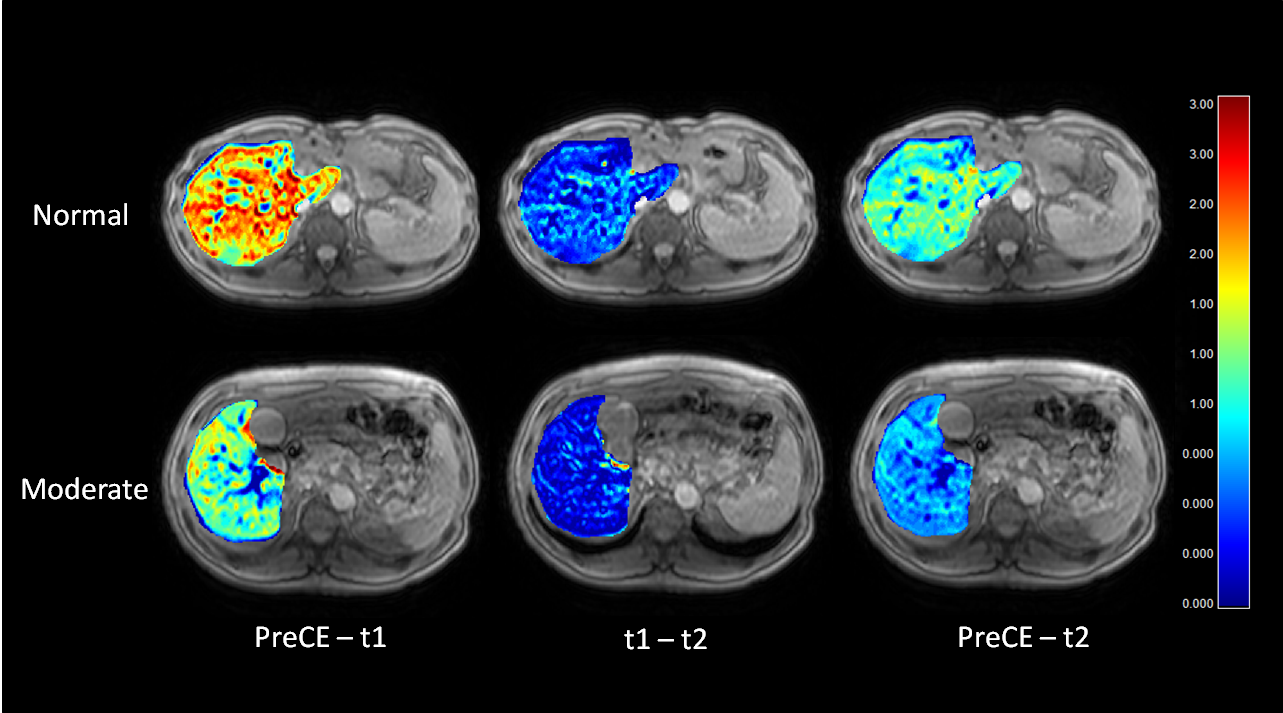
The ΔT1 values were significantly different between the Normal and Severe, and between the Mild and Severe (p < 0.01) classifications. However, all calculated kHep values were significantly different between the Normal and Moderate, Normal and Severe, Mild and Moderate, and Mild and Severe levels for each timing interval (p < 0.01) (Figure 2). Figure 3 shows the correlation of the HH15 and LHL15 indexes with the ΔT1 and kHep values for each interval. The correlation coefficients of the HH15 and LHL15 indexes with the ΔT1 and kHep values are listed in Table 1. The kHep values exhibited better correlation with the HH15 and LHL15 indexes for all scan time intervals. Images of the kHep maps for the different scan time intervals are shown in Figure 4. The kHep maps clearly visualise the difference between normal and moderate liver function for the first phase (between pre-injection and t1).Discussion
All kHep values indicate a significant difference among the classified groups compared with ΔT1, even for the timing between t1 and t2 during which limited uptake by the hepatocyte was observed. The first time interval was optimal. The correlation of the HH15 and LHL15 indexes with kHep had higher values than with the ΔT1 values for all scan time points. The kHep values were thus a statistically better index than ΔT1. The ΔT1 value reflects the T1 shortening effect by Gd-EOB-DTPA in both hepatocyte and the extracellular extravascular space. On the other hand, the kHep value is influenced only by Gd-EOB-DTPA uptake in the hepatocyte itself. Gd-EOB-DTPA is known to be taken up by active hepatocytes through their OATP1 pump. Therefore, the kHep values provide a more robust estimation of the liver function.Conclusion
We proposed the kHep index based on ΔR1 of the hepatocytes between pre-injection and two post-injection measurements after Gd-EOB-DTPA administration. We assessed the usefulness of this index versus the classification based on 99mTc-GSA scintigraphy, and compared with ΔT1 measurements. The results indicate that the kHep value is a robust index for liver function assessment, better than ΔT1 and especially for the first time interval between pre-contrast and 10 minutes later.Acknowledgements
No acknowledgement found.References
1. Katsube T, Okada M, Kumano S, Hori M, Imaoka I, Ishii K, et al. Estimation of liver function using T1 mapping on Gd-EOB-DTPA-enhanced magnetic resonance imaging. Invest Radiol. 2011;46(4):277–83.
2. Yoon JH, Lee JM. Quantitative Liver Function Analysis: Volumetric T1 Mapping with Fast Multisection B1 Inhomogeneity Correction in Hepatocyte-specific Contrastenhanced Liver MR Imaging. Radiology 2016 DOI: 10.1148/radiol.2016152800
3. Dahlqvist Leinhard O, Dahlström N, Kihlberg J, Sandström P, Brismar TB, Smedby O, et al. Quantifying differences in hepatic uptake of the liver specific contrast agents Gd-EOB-DTPA and Gd-BOPTA: a pilot study. Eur Radiol 2012 23;22(3):642–53.
4. Tomoyuki Okuaki, Kosuke Morita, Tomohiro Namimoto et al. Assessment of the Hepatocyte Fraction for estimation of liver function. Proc Intl Soc Mag Reson Med 2015, p 384
5. Tomoyuki Okuaki, Kosuke Morita, Tomohiro Namimoto et al. Comparison of the Hepatocyte Fraction and Conventional Image Based Methods for the Estimation of Liver Function. Proc Intl Soc Mag Reson Med 20152016,p 165
Figures