0427
Proton Density Fat Fraction Estimation Accuracy of High-Flip-Angle, Contrast-Enhanced, Magnitude-Based Multi-Gradient-Echo MR Imaging at 3T1University of California, San Diego, San Diego, CA, United States
Synopsis
Proton density fat fraction (PDFF) is a widely-used magnetic resonance imaging (MRI)-based biomarker for noninvasive quantification of hepatic steatosis. PDFF derived from low-flip-angle magnitude-based multi-gradient-echo MRI (MRI-M) without intravenous contrast has been shown to have high accuracy for estimating fat fraction. However, this MRI-M technique has a relatively low signal-to-noise ratio (SNR), which makes it difficult to visualize anatomical features. In this analysis of ninety-two patients, high-flip-angle contrast-enhanced (with either gadoxetate disodium or gadobutrol) MRI-M imaging had no significant difference in fat-grading accuracy from the standard low-flip-angle pre-contrast PDFF, using MR spectroscopy (MRS)-PDFF as the reference standard.
Introduction
Proton density fat fraction (PDFF) is a method of noninvasive quantification of hepatic steatosis derived from magnitude-based multi-gradient-echo MRI (MRI-M). PDFF estimation utilizing a six-echo multi-frequency model with low-flip-angle (FA) has been proven to have both high diagnostic and grading accuracy2-4. Low FA is used because high-FA tends to overestimate PDFF due to increased T1 weighting1. However, the T1 of fat and water are similar in gadolinium-enhanced acquisitions, thus mitigating this confounder1. Administration of intravenous contrast agents allows the use of high-FA imaging to achieve higher signal-to-noise ratio (SNR)5. We hypothesize that high-flip-angle, contrast-enhanced, magnitude-based multi-gradient-echo MR imaging can provide an accurate estimation of PDFF by combining the opposing effects of contrast and high FA on PDFF estimation while maintaining a high SNR. The primary aim of this study was to compare the PDFF estimation accuracy of post-contrast high-FA MRI-M with the standard pre-contrast low-FA MRI-M, using MR spectroscopy (MRS)-PDFF as the reference standard.Methods
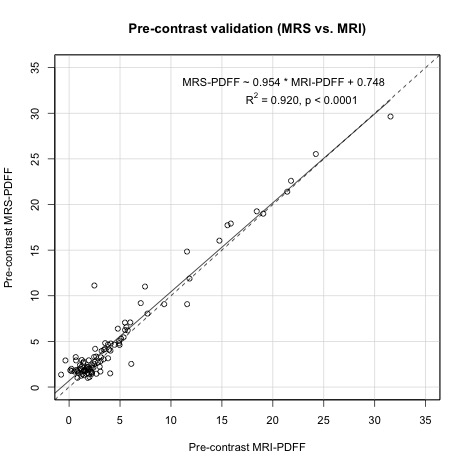
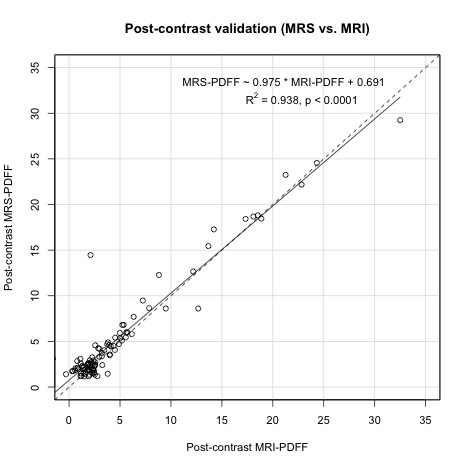
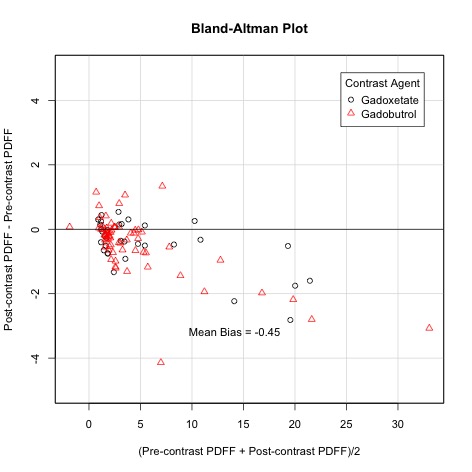
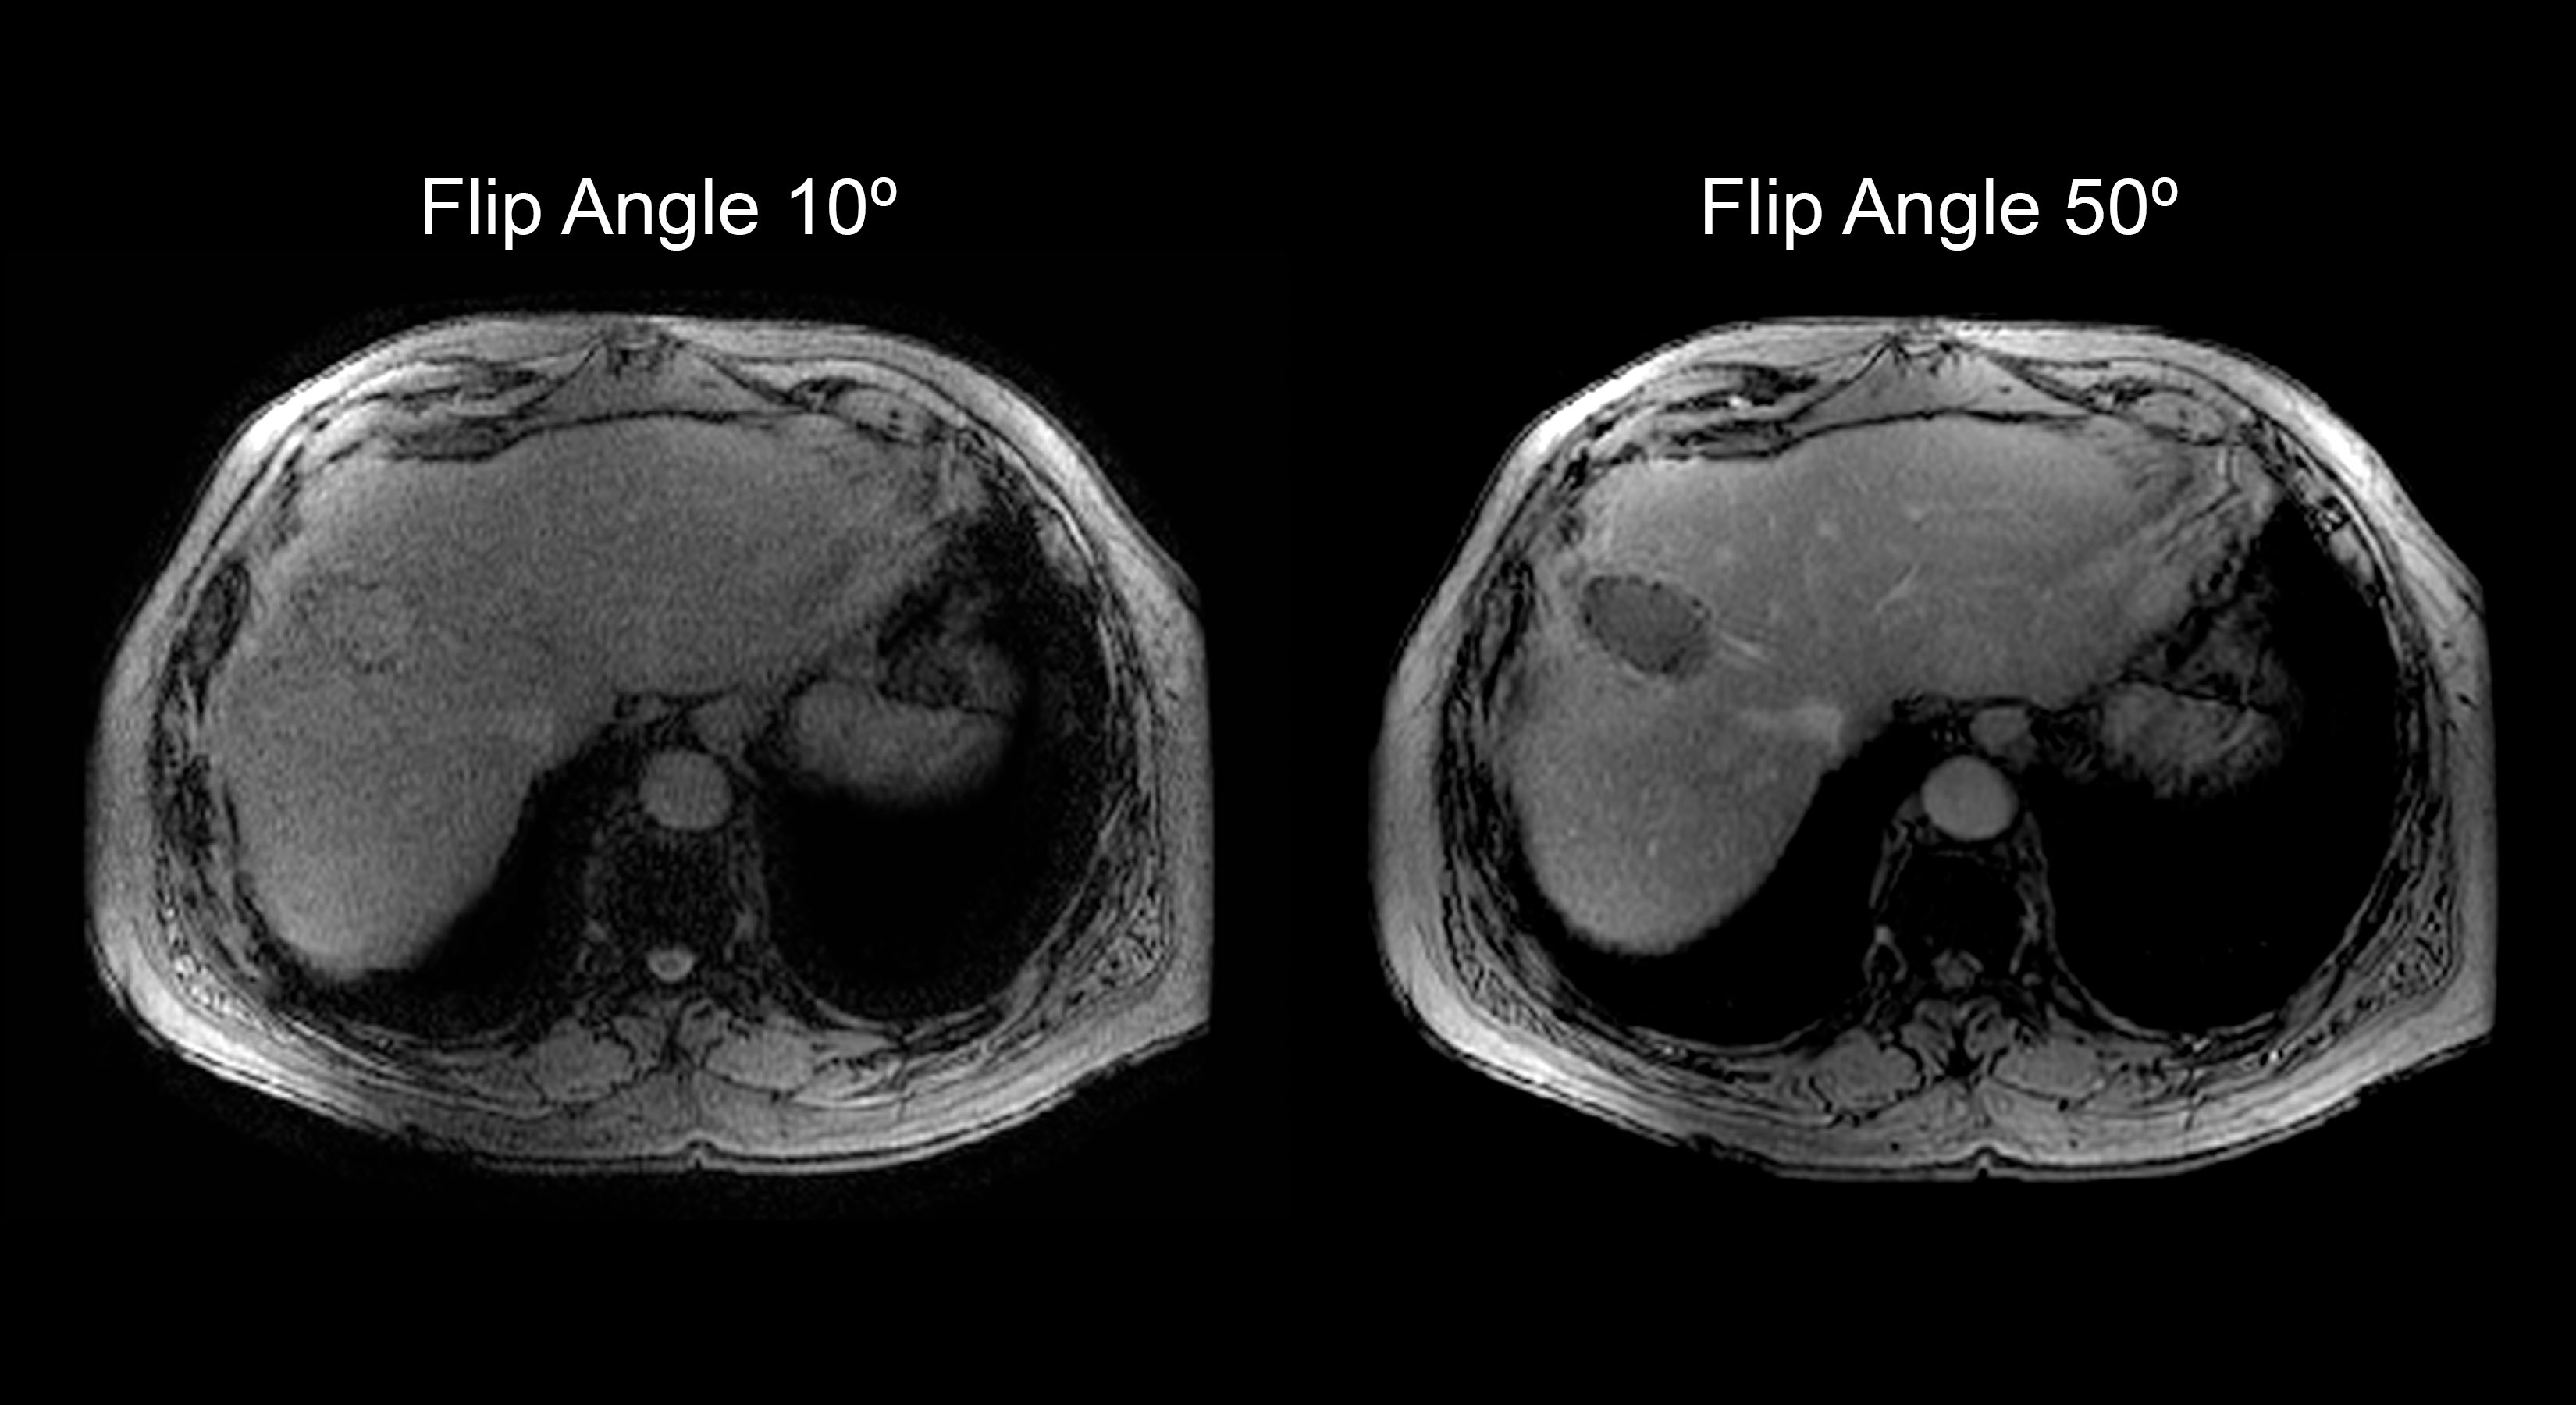
We performed a retrospective analysis of adults who underwent either gadoxetate- or gadobutrol-enhanced clinical 3T liver MRI from March 2016 to September 2016. MRS was performed pre- and post-contrast to measure MRS-PDFF. Low (10º)-FA MRI-M sequences were acquired before administration of contrast, and high (50º)-FA MRI-M sequences were acquired during the delayed phase. MRI-PDFF was estimated by placing a 1-cm radius region-of-interest (ROI) in each of the nine Couinaud hepatic segments, and three additional ROIs were placed co-localized to the MRS voxel. PDFF values from the 9 hepatic segments were averaged to obtain a composite whole-liver PDFF. Linear regression was performed with the mean co-localized MRI-PDFF as the predictor variable and MRS-PDFF as the response variable for both MRI-M sequences (pre-contrast 10º-FA and post-contrast 50º-FA). Bland-Altman analysis was performed to assess the variation of the bias PDFF estimated between the two MRI-M techniques and its dependence on mean PDFF.Results
Ninety-eight patients were included in this analysis (46 female, 52 male; mean age of 60.2 ± 14.6 years, range: 19 – 87). Linear regression slopes for both 10º and 50º-FA fit closely with MRS, with R2 of 0.920 (low-FA) and 0.938 (high-FA). The mean bias between post-contrast PDFF and pre-contrast PDFF was -0.449 (limits of agreement: -2.16, +1.27). The correlation coefficient between mean PDFF and the average bias was -0.66 (p < 0.001).Discussion
Using MRS as the reference standard, we observed that contrast-enhanced (gadoxetate and gadobutrol) high-FA MRI-M sequences have similar fat estimation accuracy compared to low-FA MRI-M across a large PDFF range (0-35%). Bland-Altman analysis pre-contrast low-FA sequence estimates higher PDFF values than post-contrast high-FA sequence on average. The increase in SNR in the post-contrast 50º-FA sequence from the pre-contrast 10º-FA (Figure 4) allows for better distinction between anatomical features. Although further validation is necessary, our findings suggest that PDFF can be accurately estimated using high-FA in patients obtaining intravenous gadoxetate or gadobutrol.Conclusion
High-FA post-contrast PDFF estimation using magnitude-based MRI displays no significant difference in accuracy from the standard low-FA pre-contrast PDFF relative to MRS, although the high-FA technique tends to estimate lower PDFF values.Acknowledgements
No acknowledgement found.References
1. Bydder M, Yokoo T, Hamilton G, et al. Relaxation effects in the quantification of fat using gradient echo imaging. J Magn Reson Imaging. 2008;26.3:347-359.
2. Yokoo T, Shiehmorteza M, Hamilton G, et al. Estimation of hepatic proton-density fat fraction by using MR imaging at 3.0 T. Radiology. 2011;258(3):749-759.
3. Tang A, Tan J, Sun M, et al. Nonalcoholic fatty liver disease: MR imaging of liver proton density fat fraction to assess hepatic steatosis. Radiology. 2013;267(2):422-431.
4. Reeder SB, Hu HH, Sirlin CB. Proton density fat-fraction: A standardized MR-based biomarker of tissue fat concentration. J Magn Reson Imaging. 2012;36(5):1011-1014.
5. Tajima T, Takao H, Akai H, et al. Relationship between liver function and liver signal intensity in hepatobiliary phase of gadolinium ethoxybenzyl diethylenetriamine pentaacetic acid-enhanced magnetic resonance imaging. J Comp Assis Tomog. 2011;34(3):362-366.
Figures