0426
Relationship between hepatic blood flow and segmental liver hypertrophy after portal vein embolization using 4D flow MRI1Radiology, UW Wisconsin Madison, Madison, WI, United States, 2Medical Physics, UW Wisconsin Madison, Madison, WI, United States
Synopsis
This study used 4D-flow MRI to assess potential correlations between changes in portal-venous blood flow and liver growth after portal vein embolization (PVE). 4 pigs underwent PVE and were examined with 4D flow MRI before and immediately after PVE as well as 1 week and 2 weeks after PVE. The results indicate that a persistent increase in blood flow volume to non-embolized liver segments as opposed to a peak in flow volume that later decrease over time, is likely to influence growth of these segments. Furthermore, 4D-flow MRI is well suited to study changes in portal-venous flow volume after PVE.
Introduction
Portal vein embolization (PVE) is performed in patients with liver tumors who are candidates for tumor resection but have anticipated post-resection liver volumes insufficient to sustain hepatic function. Embolization is performed in the portal branches of the portion of the liver segment(s) to be resected. This leads to increased blood flow in the non-embolized hepatic segments, and triggers hypertrophy of those segments. Hypertrophied segments can then compensate for loss of liver function due to the ensuing resection, thus avoiding post hepatectomy liver failure[1]. However, growth of the non-embolized segments is often insufficient to maintain liver function [2]. In this study, we used radial 4D flow MRI to asses portal-venous blood flow changes before and after PVE in an animal model, to determine whether early changes in blood flow after PVE can predict the rate of hypertrophy of non-embolized hepatic segments.Methods
4 pigs were included in this institutional animal care and use committee (IACUC) approved study. Mean weight was 54kg. 3 pigs underwent PVE and one pig served as a control. Pigs underwent MRI on a clinical 3T system immediately before and after PVE, as well as 1 week and 2 weeks after PVE. A 32-channel phased-array torso coil was used. 4D-flow MRI was performed using a free breathing, radially undersampled phase contrast acquisition (5-point PC-VIPR) [3; 4] with retrospective ECG-gating. Imaging parameters were: TR/TE=6.3/2.4ms, FA=10°, BW=+/-125kHz, FOV=360x360x360mm3. Velocity-encoding gradients of 60cm/s for venous and 120cm/s for arterial flow measurements were utilized. Vessel segmentation was performed using MATLAB (MathWorks, Natick, MA). Flow measurements were performed in EnSight (CEI, Apex, NC) using manual placement of cut-planes in the vessel of interest. Measurements were performed in the main portal vein (PV), right lateral portal vein, right middle portal vein, left middle portal vein and left lateral portal vein. Furthermore, a respiratory-navigator triggered dual-echo high-resolution T1-w 3D spoiled gradient echo (SGRE) sequence with two-point fat-water separation was utilized for liver volumetry. Acquisition parameters included: TR/TE1/TE2 = 4.4/1.3/2.6ms, FA=12°, BW=+/-127kHz, true spatial resolution: 1.25x1.6mmx1.3mm. PVE of two of the four portal vein branches (left lateral and left medial branch in all three animals) was performed via a transcutaneous approach. Polyvinyl-alcohol-particles were used for embolization until stasis of flow under fluoroscopy flow was achieved. Changes in volumetric portal-venous blood flow rate to the non-embolized liver segments (right lateral+right middle PV) were calculated and normalized to total portal-venous blood flow volume at each visit. Changes in volume (%) of the non-embolized liver segments after one and two weeks were also calculated. Limited descriptive statistical analyses were performed in this preliminary analysis, where we compared volumetric flow to the non-embolized segments to the induced growth of these segments.Results
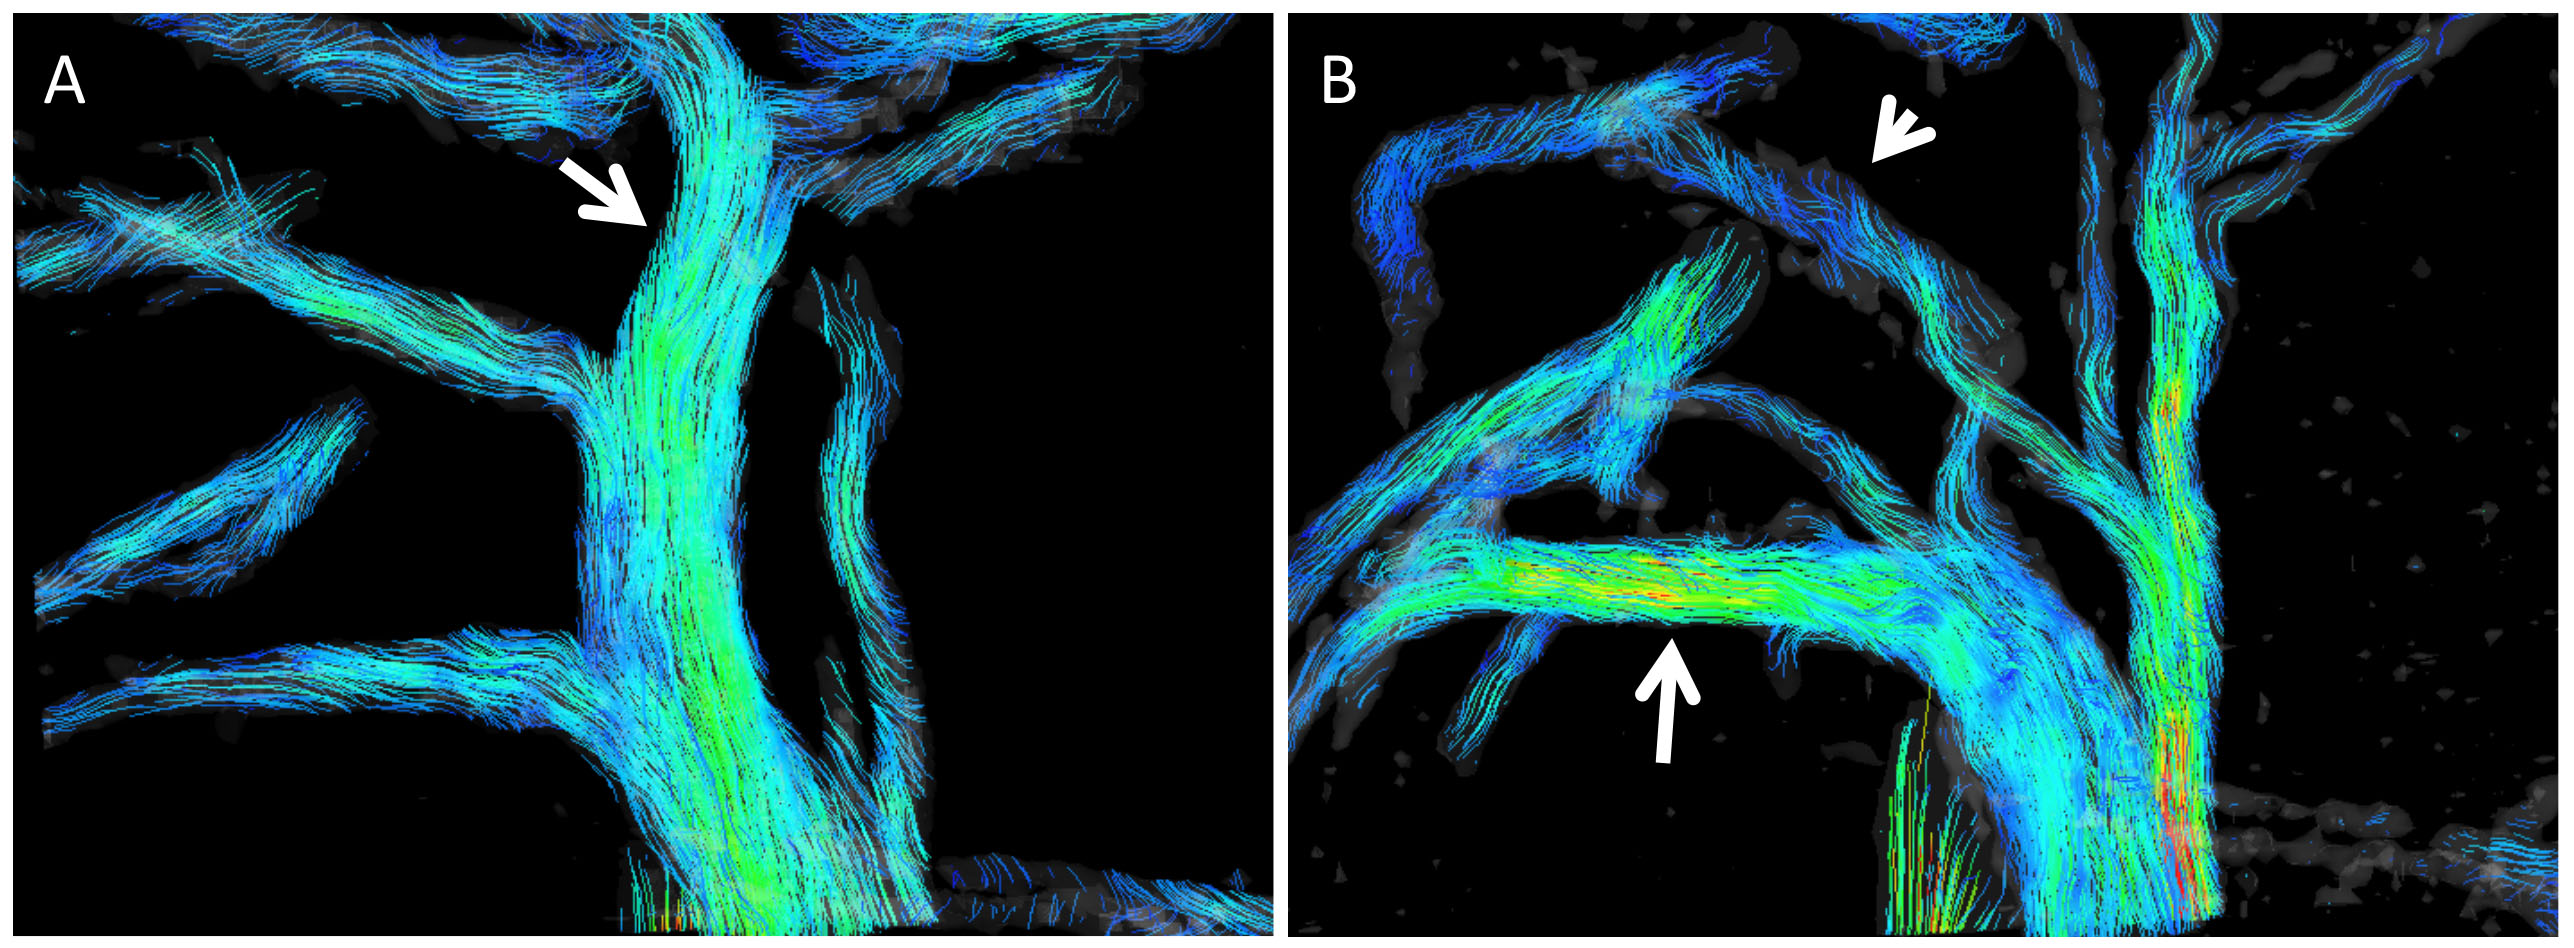
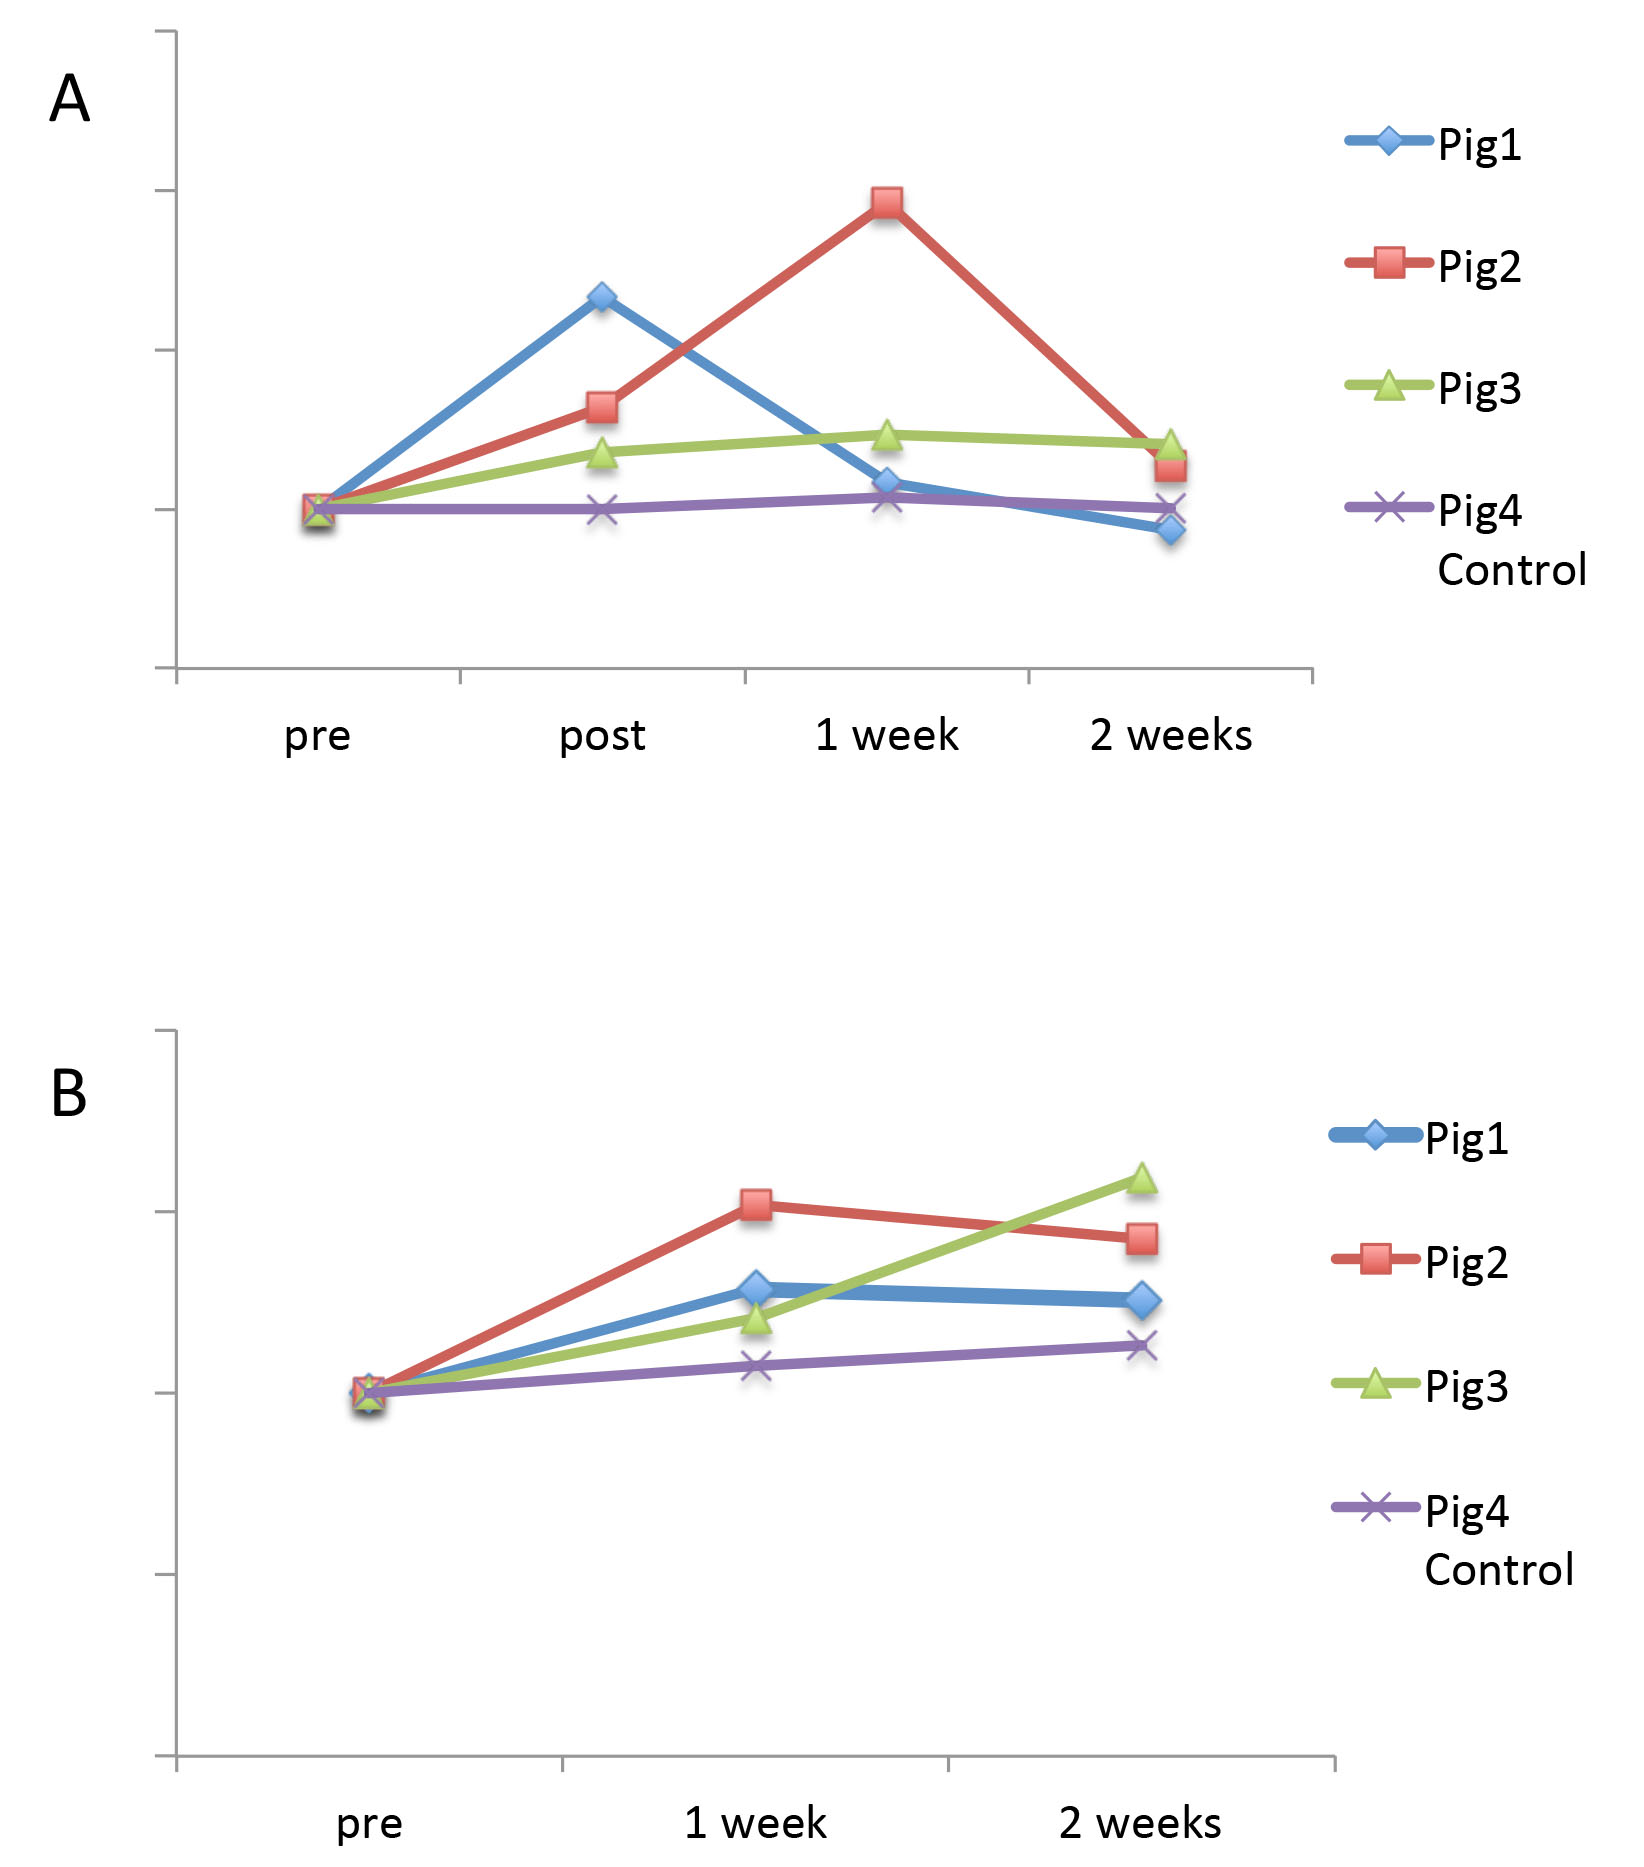
Portal-venous blood flow to the non-embolized liver segments increased with a mean of 77% (36%-133%) immediately after PVE, 85% (17%-192%) after one week and 18% (-13%-41%) after 2 weeks, compared to the control animal which showed an increase in PV flow of +7% after one week and of +1% after two weeks. The non-embolized liver segments showed a mean increase in volume of 34% (21-51%) after one week and 42% (26-59%) after two weeks. The control animal showed an increase in right liver volume of 7% after one week and 13% after 2 weeks. The animal with the largest volumetric increase of the non-embolized segments (59%) demonstrated a persistent increase in PV blood flow to the non-embolized segments from immediately after PVE (36%) until 2 weeks after PVE (41%). The remaining two animals showed a peak in blood flow volume to the non-embolized segments immediately after PVE (133%, 64%, Figure 1) with a subsequent decrease in blood flow volume after 2 weeks (-13%, 27%). These two animals had a lower induced volume increase of the non-embolized segments (26%, 42%). Figure 2 shows a graphical summary of results.Discussion
This study investigated changes in portal-venous blood flow and liver segmental hypertrophy after PVE in an animal model. Changes in flow were closely related to the induced growth of the non-embolized liver segments. 4D flow MRI is ideally suited for this application, as it provides large volumetric coverage and the ability to characterize blood flow over the entire liver. Our preliminary results suggest that persistent increases in blood flow to non-embolized liver segments may be most beneficial to predict growth in the non-embolized liver segments.Conclusion
4D-flow MRI is well suited to study changes in portal-venous flow volume after PVE. Persistent increase in blood flow volume to non-embolized liver segments is likely to influence growth of these segments.Acknowledgements
The authors wish to acknowledge support from the NIH (R01 DK096169, UL1TR00427, R01 DK083380, R01 DK088925, R01 DK100651, K24 DK102595), as well as GE Healthcare.References
1 Abdalla EK, Barnett CC, Doherty D, Curley SA, Vauthey JN (2002) Extended hepatectomy in patients with hepatobiliary malignancies with and without preoperative portal vein embolization. Arch Surg 137:675-680; discussion 680-671
2 Abulkhir A, Limongelli P, Healey AJ et al (2008) Preoperative portal vein embolization for major liver resection: a meta-analysis. Ann Surg 247:49-57
3 Gu T, Korosec FR, Block WF et al (2005) PC VIPR: a high-speed 3D phase-contrast method for flow quantification and high-resolution angiography. AJNR Am J Neuroradiol 26:743-749
4 Johnson KM, Markl M (2010) Improved SNR in phase contrast velocimetry with five-point balanced flow encoding. Magn Reson Med 63:349-355
Figures