0425
Exploration for Novel Markers of Left Atrial Disease and Thrombo-embolic Risk in Patients with Paroxysmal Atrial Fibrillation Using 4D Flow MRIJulio Garcia1,2, Michael S Bristow2,3, Carmen Lydell2,4, Andrew G Howarth2,3, Bobby Heydari2,3, Frank S Prato5, Maria Drangova5, Rebecca Thornhill6, Pablo Nery7, Stephen Wilton2, Allan Skanes8, and James White2,3
1Department of Cardiac Sciences, University of Calgary, Calgary, AB, Canada, 2Stephenson Cardiac Imaging Centre, Libin Cardiovascular Institute of Alberta, Calgary, AB, Canada, 3Department of Medicine, University of Calgary, Calgary, AB, Canada, 4Diagnostic Imaging, University of Calgary, Calgary, AB, Canada, 5Medical Imaging, University of Western Ontario, London, ON, Canada, 6Diagnostic Imaging, The Ottawa Hospital, Ottawa, ON, Canada, 7Electrophysiology, University of Ottawa, Ottawa, ON, Canada, 8Department of Medicine, University of Western Ontario, London, ON, Canada
Synopsis
This study may be of interest for clinicians and clinical researchers who study or measure left atrial blood flow. This pilot study demonstrates that: 1) 4D flow imaging of LA inflow and vortex formation is clinically feasible, 2) Significant differences in LA flow can be identified in patients with paroxysmal AF versus healthy controls; 3) Asymmetry of pulmonary vein inflow was observed in this population and may be contributory to (or as a result of) alterations in LA vortical flow, and 4) Vortical flow is fractionated in patients with a history of paroxysmal AF. These early observations seed interest for LA 4D flow as a marker of early or established left atrial disease and may provide value for the prediction of thrombo-embolic events.
Purpose:
Atrial fibrillation (AF) is a common cardiac arrhythmia associated with elevated morbidity and mortality (1). The latter are largely contributed to by an elevated risk of systemic thrombo-embolism and stroke leading to disability or death. Previous studies using Doppler echocardiography have supported that thrombus formation is associated with alterations in left atrial flow in this population (2). Recently, time-resolved three-dimensional phase-contrast imaging with three directional velocity encoding (4D flow MRI) was able to visualize and quantify markers of global LA flow velocity in patients with AF versus healthy controls (3-4). This pilot study aims to expand on this important work by exploring LA inflow from individual pulmonary veins and assess their relationship to LA vortex formation, the latter a potential marker of atrial disease and thrombo-embolic risk.Methods:
15 male subjects (10 with paroxysmal AF >2 years duration referred for pulmonary vein ablation, 5 healthy controls) were enrolled in an IRB-approved study protocol. Patients were required to be in sinus rhythm and not have >mild mitral insufficiency. Imaging was performed using a 3T MRI scanner (Prisma or Skyra, Siemens, Erlangen, Germany) using a standardized protocol inclusive of ECG-gated 4D flow with adaptive navigator respiratory gating (5). Data was acquired in trans-axial orientation with whole heart coverage. Imaging parameters were: Venc=1.5–2.0 m/s, TE=2.61–3.14 ms, TR= 4.9–5.9 ms, FOV= 200–420 mm×248–368 mm, spatial resolution = 1.9–3.5×2.0–3.2×1.8–3.5 mm³, temporal resolution = 39.9–47.2 ms, FA = 8°. 4D flow data was pre-processed for noise masking, velocity anti-aliasing, and correction of eddy-currents using in-house software (Matlab,Mathworks, Natick, MA, USA) (6). A time-averaged phase contrast MR angiogram (5) (PC-MRA) was constructed from 4D flow MRI data (Fig. 1A) and used to perform a 3D segmentation of the left sided chambers and proximal aorta (Fig. 1B-Top). Segmentation was performed semi-automatically using fast marching segmentation with 3D active contour detection algorithms implemented in Matlab (7,8). Blood flow visualization and flow quantification was performed using 3D pathlines (Fig. 1B) initiated from specific plane locations (Ensight, CEI, USA) in the segmented heart model. These were located at the top, middle, and bottom third (close to mitral valve) of the left atrium (Fig. 1C) as well as in the ostium of each pulmonary vein (i.e. left superior, left inferior, right superior, and right inferior, Fig. 1D). Blood flow analyses for each of these 7 planes included: peak velocity, net flow, forward flow, retrograde flow, and regurgitant fraction (%) (9). Left atrial flow patterns were visually assessed for vortex formation, rotation and fractionation using both streamlines and particle traces in all subjects. Flow quantification parameters were compared between AF patients and healthy subjects using a Mann-Whitney U-test. Similarly, mean flow estimates for each of the pulmonary veins were compared using a U-test. Statistical analysis was performed using SPSS 17 (SPSS, Chicago, Illinois, USA).Results:
Median age was 54 years in AF subjects and 28 years in healthy controls. All subjects completed the 4D flow imaging study with good image quality. LA flow measurements showed significant alteration in flow parameters at all chamber planes. At the top plane net flow (NF) was significantly lower in subjects with AF versus healthy controls (median = 39 ml/cycle vs. 48 ml/cycle, p<0.070). Peak velocities (PV) were significantly lower in subjects with AF versus healthy controls with median values of 0.5 m/s vs. 0.7 m/s (p=0.076) at the mid plane and 0.7 m/s vs. 0.9 m/s (p=0.003) at the bottom plane. No asymmetry in pulmonary vein inflow velocities were observed in controls, however patients with AF showed significant asymmetry in peak velocities of the left superior (LS) versus right superior (RS) pulmonary veins with median values of 0.57 m/s and 0.47 m/s (p=0.001), respectively (Fig. 2). While helical and vortical LA flow patterns were observed in both cohorts these patterns were broader, more complex, and highly fractionated in AF subjects (Fig 2), 2 patients incrementally showing right inferior LA vortex formation. LA vortex rotation was clockwise (viewed from ventricular side) in all subjects.Discussion and Conclusion:
This pilot study demonstrates that: 1) 4D flow imaging of LA inflow and vortex formation is clinically feasible, 2) Significant differences in LA flow can be identified in patients with paroxysmal AF versus healthy controls; 3) Asymmetry of pulmonary vein inflow was observed in this population and may be contributory to (or as a result of) alterations in LA vortical flow, and 4) Vortical flow is fractionated in patients with a history of paroxysmal AF. Collectively, these early observations seed interest for LA 4D flow as a marker of early or established left atrial disease and may provide value for the prediction of thrombo-embolic events. Future studies require sufficiently broad cohorts and protocol considerations to permit considerations in variability of left ventricular filling pressure, given anticipated application of this technique to patients with comorbid diastolic dysfunction.Acknowledgements
This work was supported in part by the Cardiac Arrhythmia Network of Canada (CANet) AF-START grant, Circle Cardiovascular Imaging and MITACS (IT07679)References
1. Feinberg WM et al. Arch intern Med 1995; 155(5):469-473. 2. Bernhardt P et al. J Am Coll Cardiol 2005; 45(11):1807-1812. 3. Fluckiger J et al. J Mag Reson Imaging 2013:38:580-587. 4. Markl M et al. Int J Cardiovasc Imaging 2016:32(5):807-15. 5. Markl M et al J Mag Reson Imaging 2007:25:824-831. 6. Bock J et al. ISMRM 2007, abstract 3138. 7. Zhang Y et al. IEEE Int Conf Biomed Vis (2008). 8. Sabry H et al. IEEE Trans Pattern Anal Mach Intell 2007;29(9) :1563-74. 9. Schnell S et al. J Comput Assist Tomogr 2016; 40(1):102-8.Figures
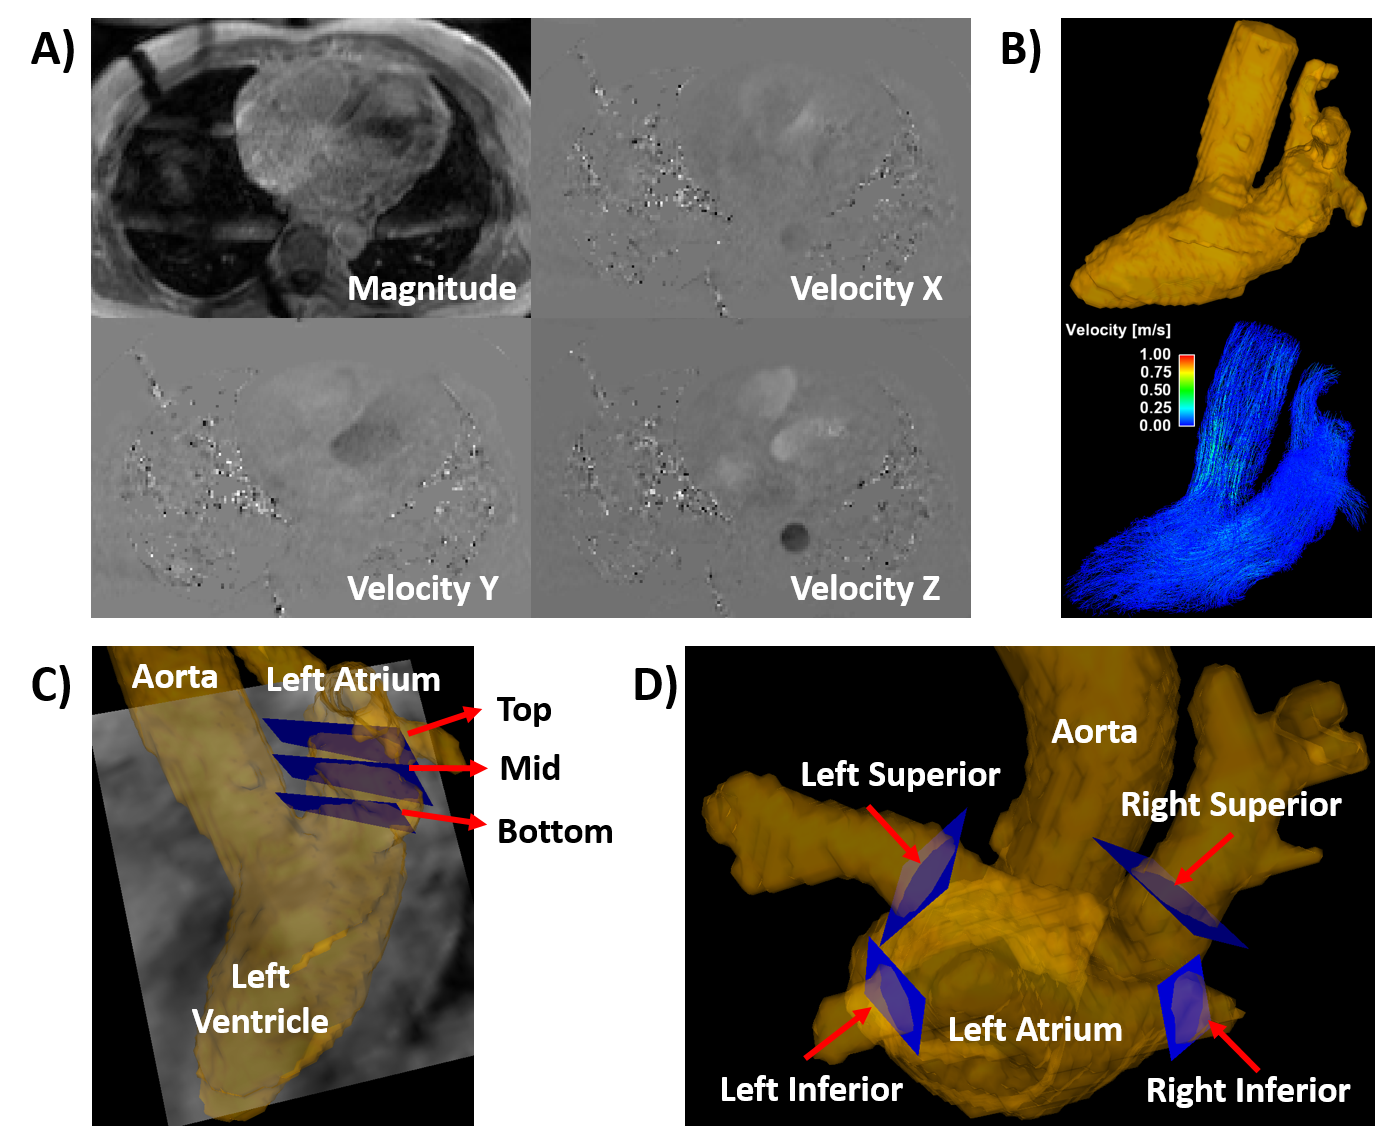
Figure 1. Workflow for left atrial flow analysis. 4D flow data
(A) were used for calculating a time-averaged phase contrast MR angiogram (PC-MRA).
PC-MRA was used to segment the whole heart (B-Top). Whole heart segmentation
was used for masking the entire velocity field, generating visualization
pathlines, and local flow quantification at specific plane locations. Plane
locations for analysis were located at the top, mid, and bottom within the left
atrium (C) and at each pulmonary vein (D).
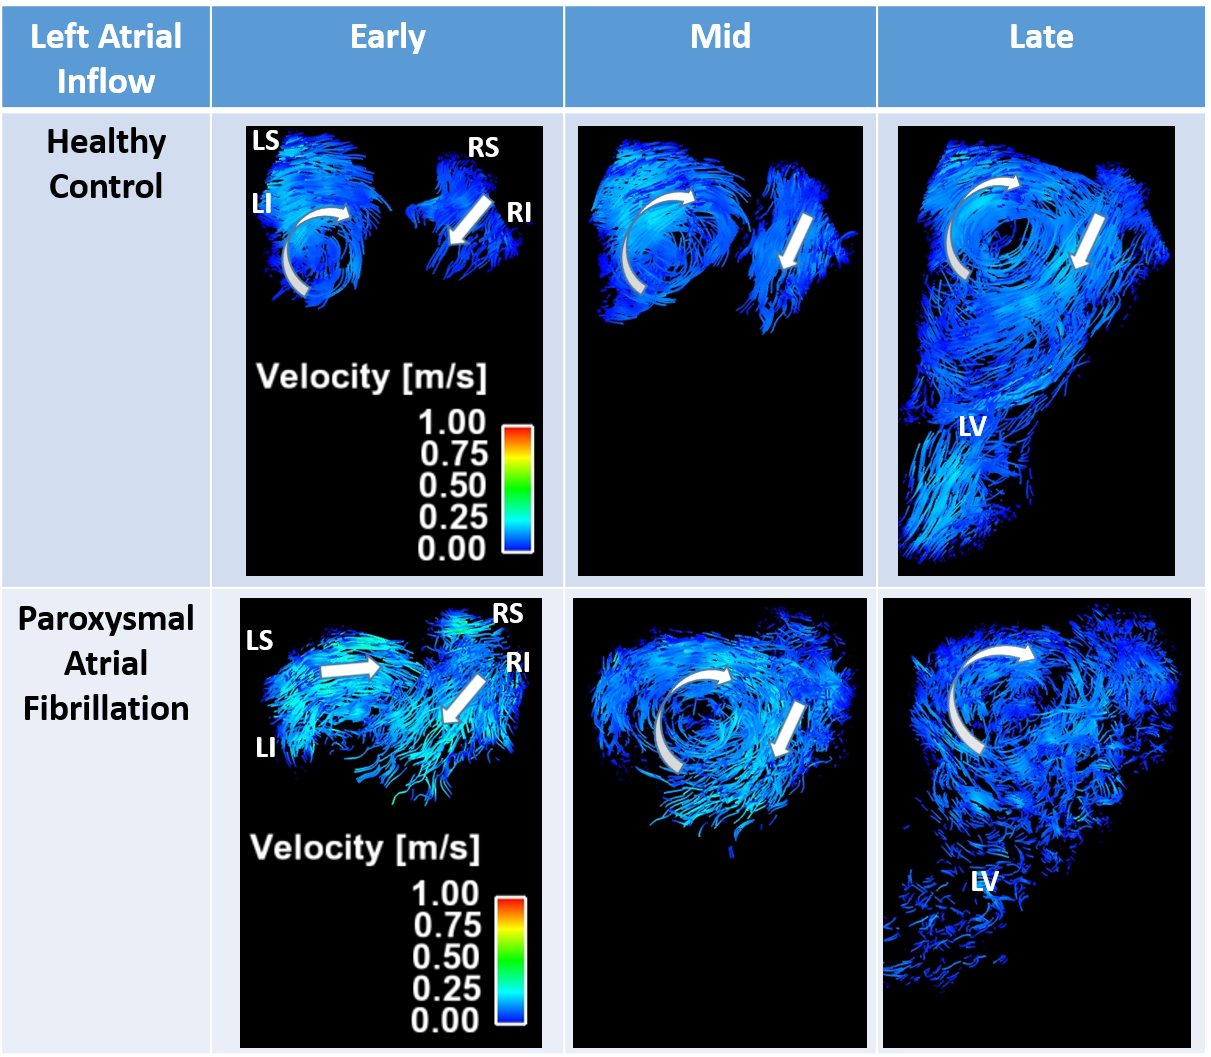
Figure 2. Particle traces
comparison between healthy control and patient with paroxysmal atrial
fibrillation. Columns illustrate left atrial inflow in early (before aortic
valve closure), mid (at aortic valve closure), and late (mitral valve opens)
phases. Left atrial vortex shows significant fraction in patients with atrial
fibrillation. Arrows indicate the direction and rotation of blood flow. LS:
left superior; LI: left inferior; RS: right superior; RI: right inferior; LV:
left ventricle.