0423
k-t accelerated aortic 4D flow MRI in under 2 minutes: feasibility and impact of resolution, k-space sampling patterns, and respiratory navigator gating on hemodynamic measurements1Department of Radiology, Northwestern University, Chicago, IL, United States, 2Department of Radiology, Academic Medical Center, Amsterdam, Netherlands, 3Department of Biomedical Engineering, Northwestern University, Chicago, IL, United States
Synopsis
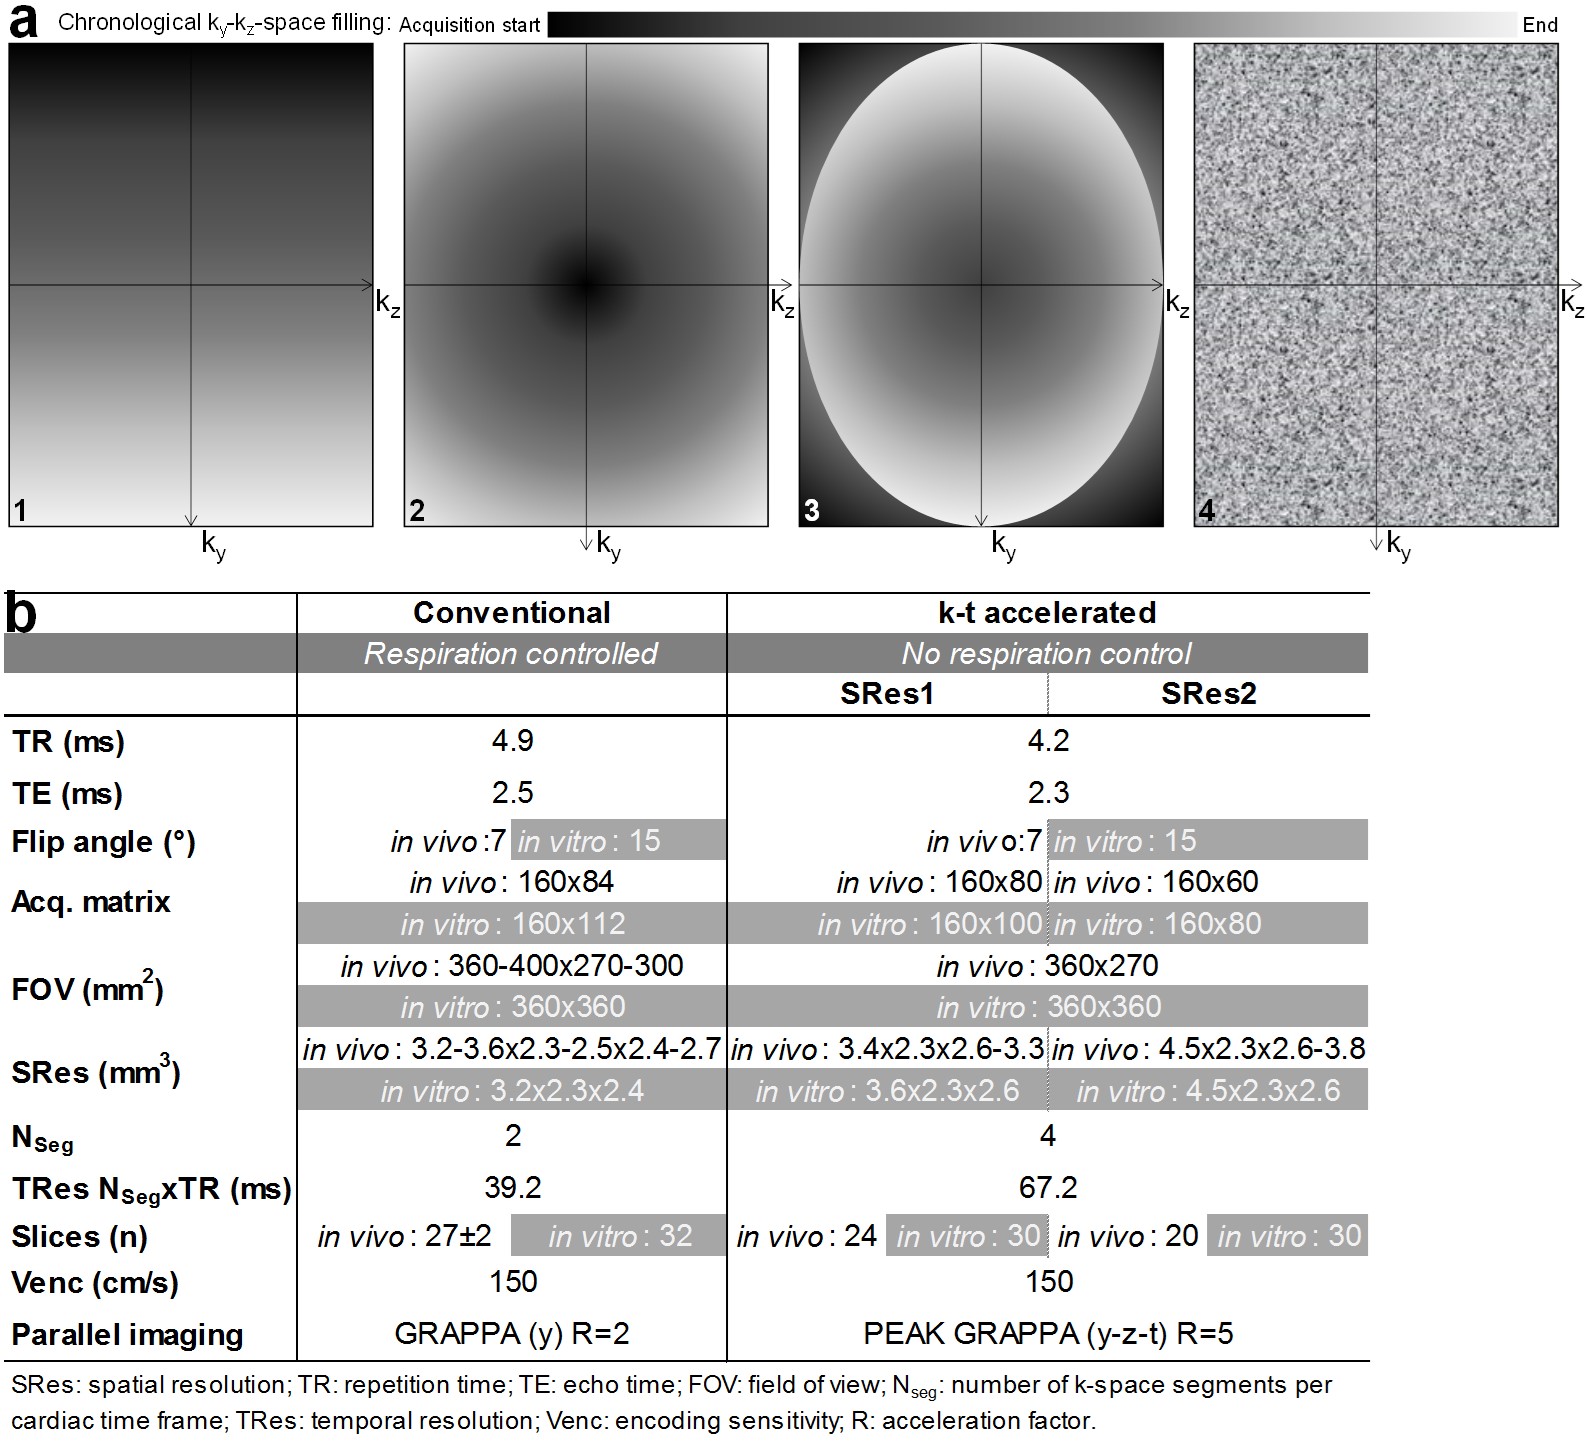
Our objective was to assess the performance of eight highly k-t accelerated non-gated free-breathing aortic 4D flow MRI measurements acquired in under 2 minutes (PEAK GRAPPA R=5; TRes=67.2ms; four ky-kz-space Cartesian fillings: linear, center-out, out-center-out, random; two spatial resolutions=3.5x2.3x2.6mm3, 4.5x2.3x2.6mm3), both in vitro and in 10 healthy volunteers. Despite lower image quality, the significantly shorter k-t accelerated datasets provided aortic hemodynamic indices in agreement with conventional respiratory-gated 4D flow measurements. Differences were non-significant when using linear and out-center-out k-space samplings (absolute differences≤22%). In conclusion, aortic 4D flow MRI in under 2 minutes is feasible with moderate underestimation of flow indices.
INTRODUCTION
4D flow MRI is often limited by scan times, which are rendered even longer with respiratory navigator gating1, commonly used for thoracic applications to correct for breathing-related motion. Thus, typical scan times for an aortic 4D flow exam range from 8 to 12 minutes when using regular parallel imaging (acceleration factor R=2). The purpose of this study was to assess the feasibility of performing aortic 4D flow MRI in under 2 minutes by combining k-t acceleration, free breathing data acquisition using different ky-kz sampling patterns (linear, centric, random) to mitigate breathing artifacts, and adapted spatial/temporal resolutions.METHODS
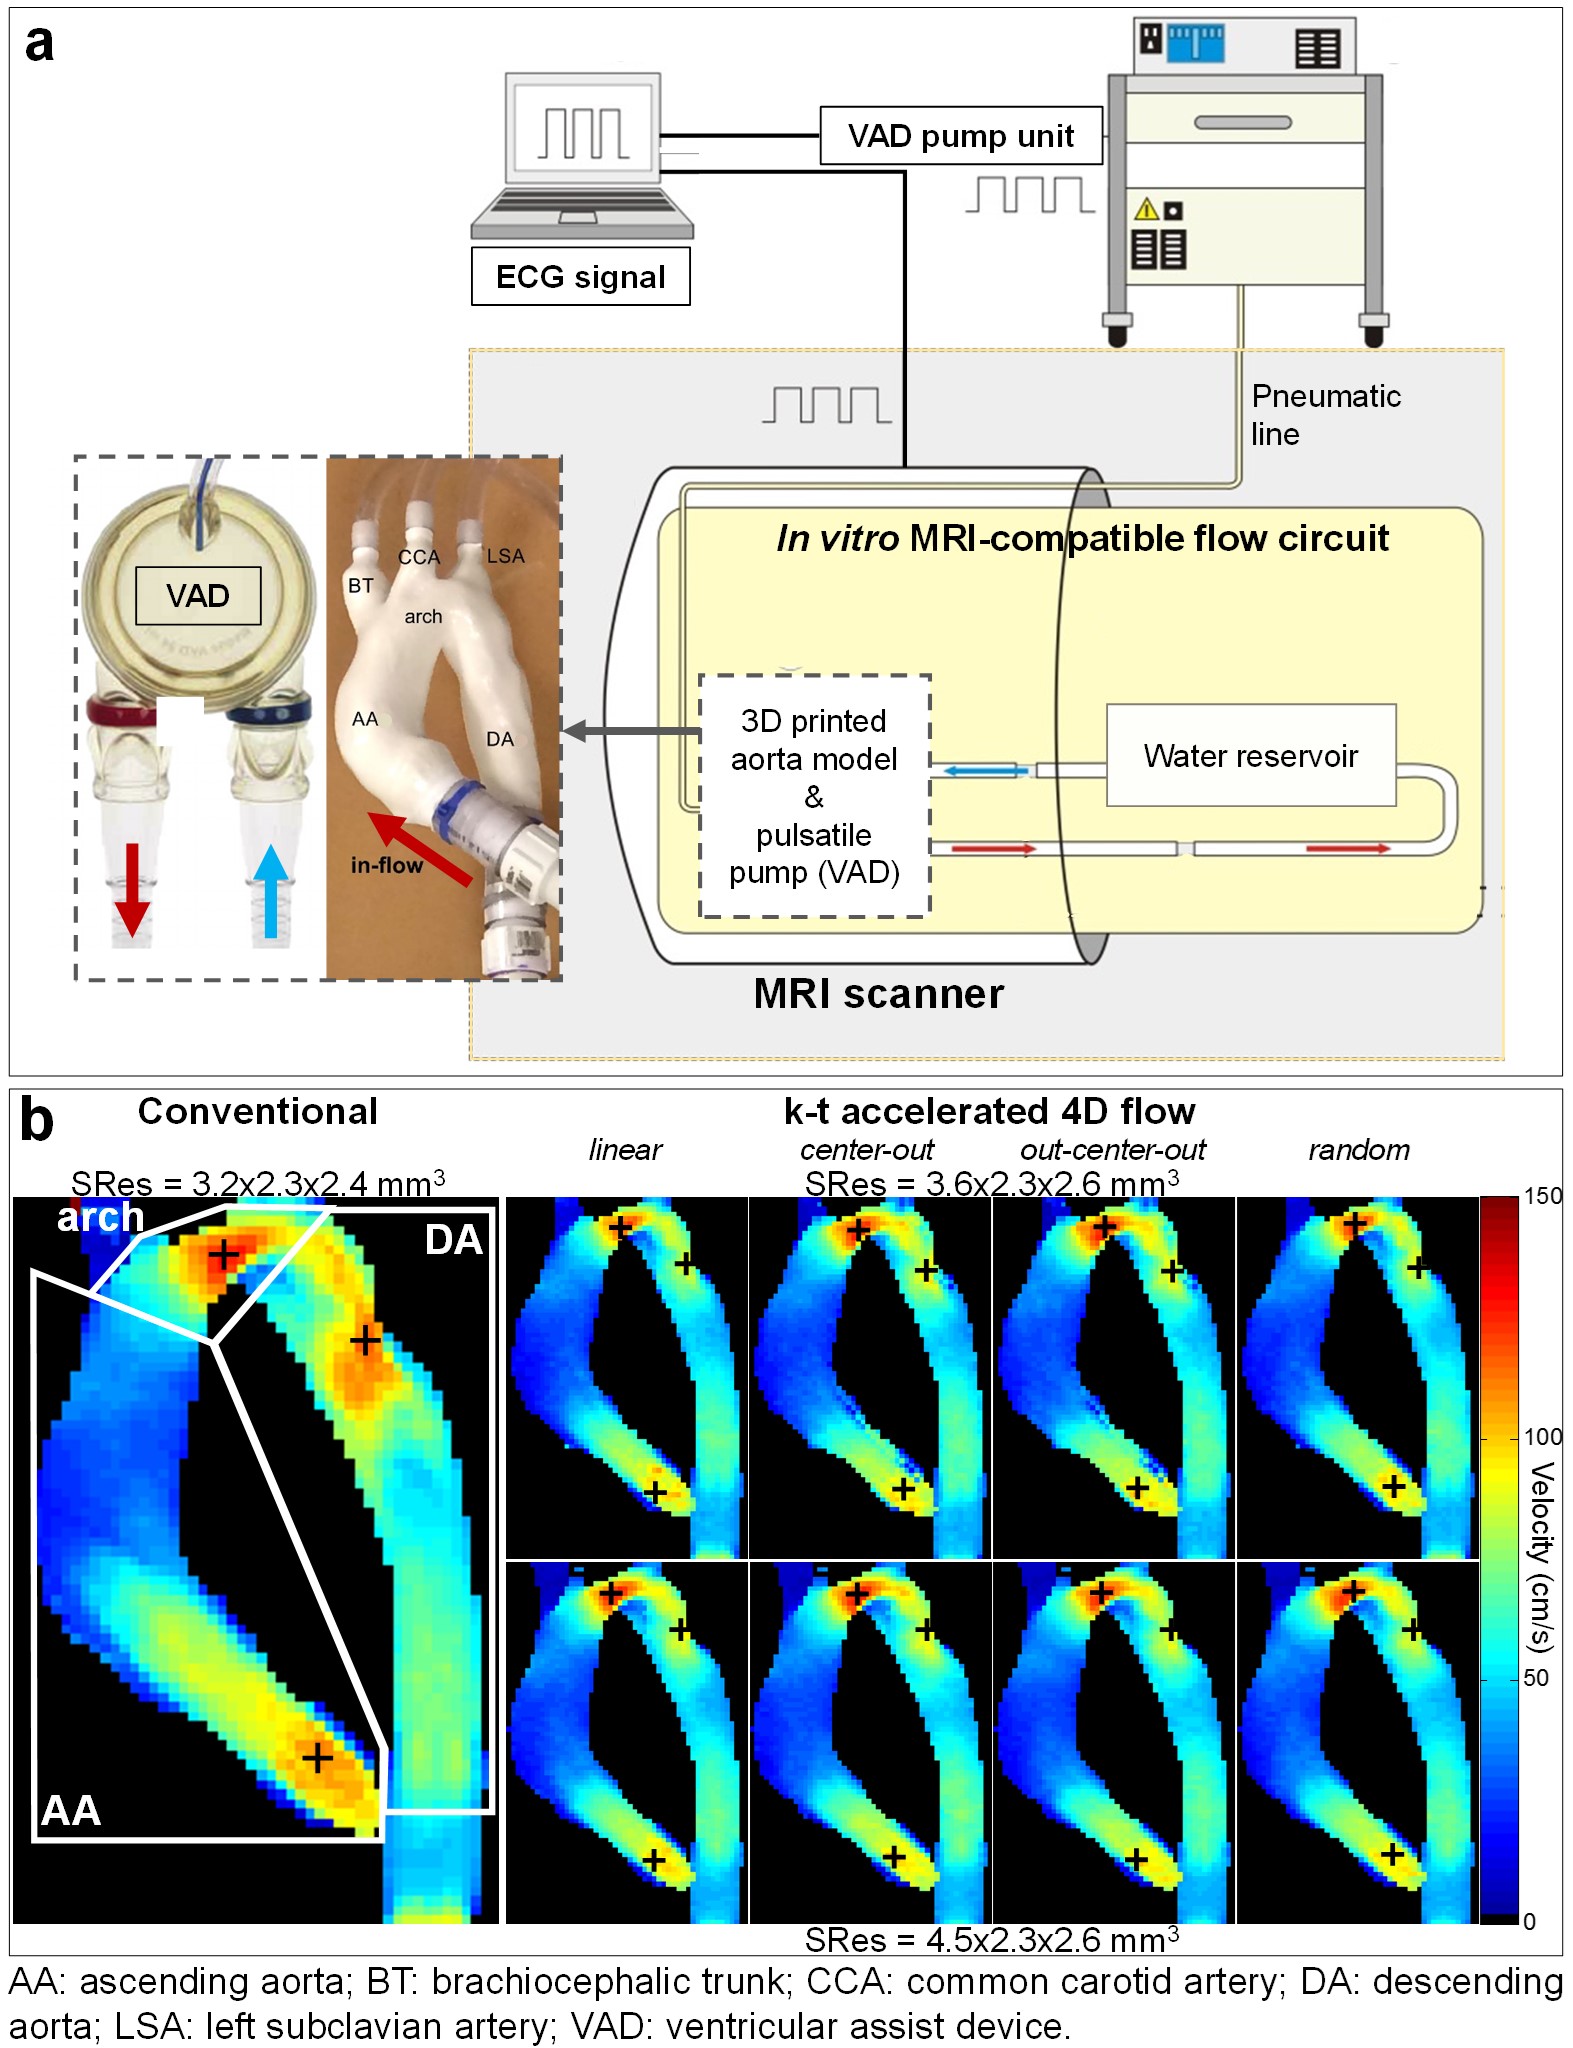
Eight variants of k-t accelerated non-gated 4D flow MRI (PEAK GRAPPA2 R=5) using 2 spatial resolutions (SRes1 and SRes2) and 4 ky-kz Cartesian sampling patterns (Figure 1.a) were implemented: 1- conventional linear line-by-line ky-kz-space filling; 2- centric encoding from the central (ky=kz=0) to the outer k-space positions (‘center-out’); 3- most outer ky-kz-space positions (k-space corners) initially filled during the first 10 cardiac cycles, followed by centric encoding (‘out-center-out’); 4- random filling. The 8 acquisition strategies were compared to conventional navigator-gated 4D flow MRI, which was performed according to consensus recommendations3 (Figure 1.b), using navigator gating of the lung-liver interface with a fixed 16-mm acceptance window size combined with respiratory-ordered phase encoding4. The evaluation was performed on a 1.5T MAGNETOM Aera scanner (Siemens, Germany) both in vitro, on a patient-specific 3D-printed aortic coarctation model connected to a pulsatile pump (Figure 2.a), and in 10 healthy volunteers (4 women, age: 61±16 [31-77] years). Data analysis included visual image quality assessment on a 3-point scale in the ascending aorta (AA), arch and descending aorta (DA) based on the 4D flow magnitude cine data and the PC-MRA sagittal maximal intensity projection (MIP). Flow indices (regional peak velocity Vmax and flow Qmax as well as net flow volume Qnet) were further computed as previously described5,6.RESULTS
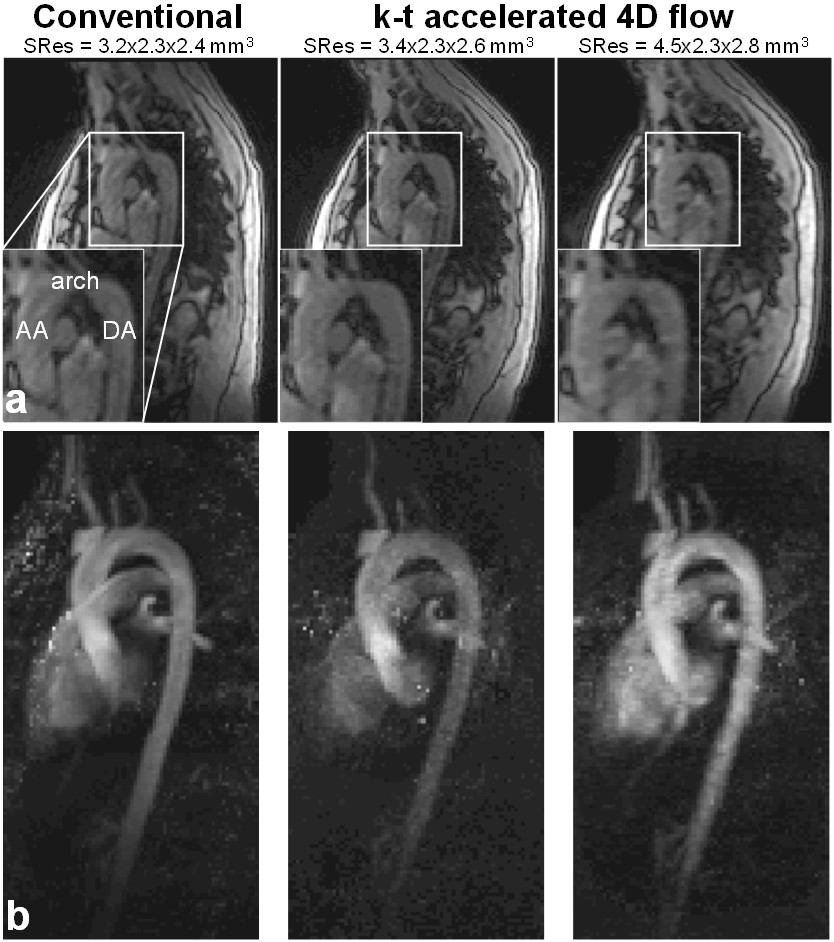
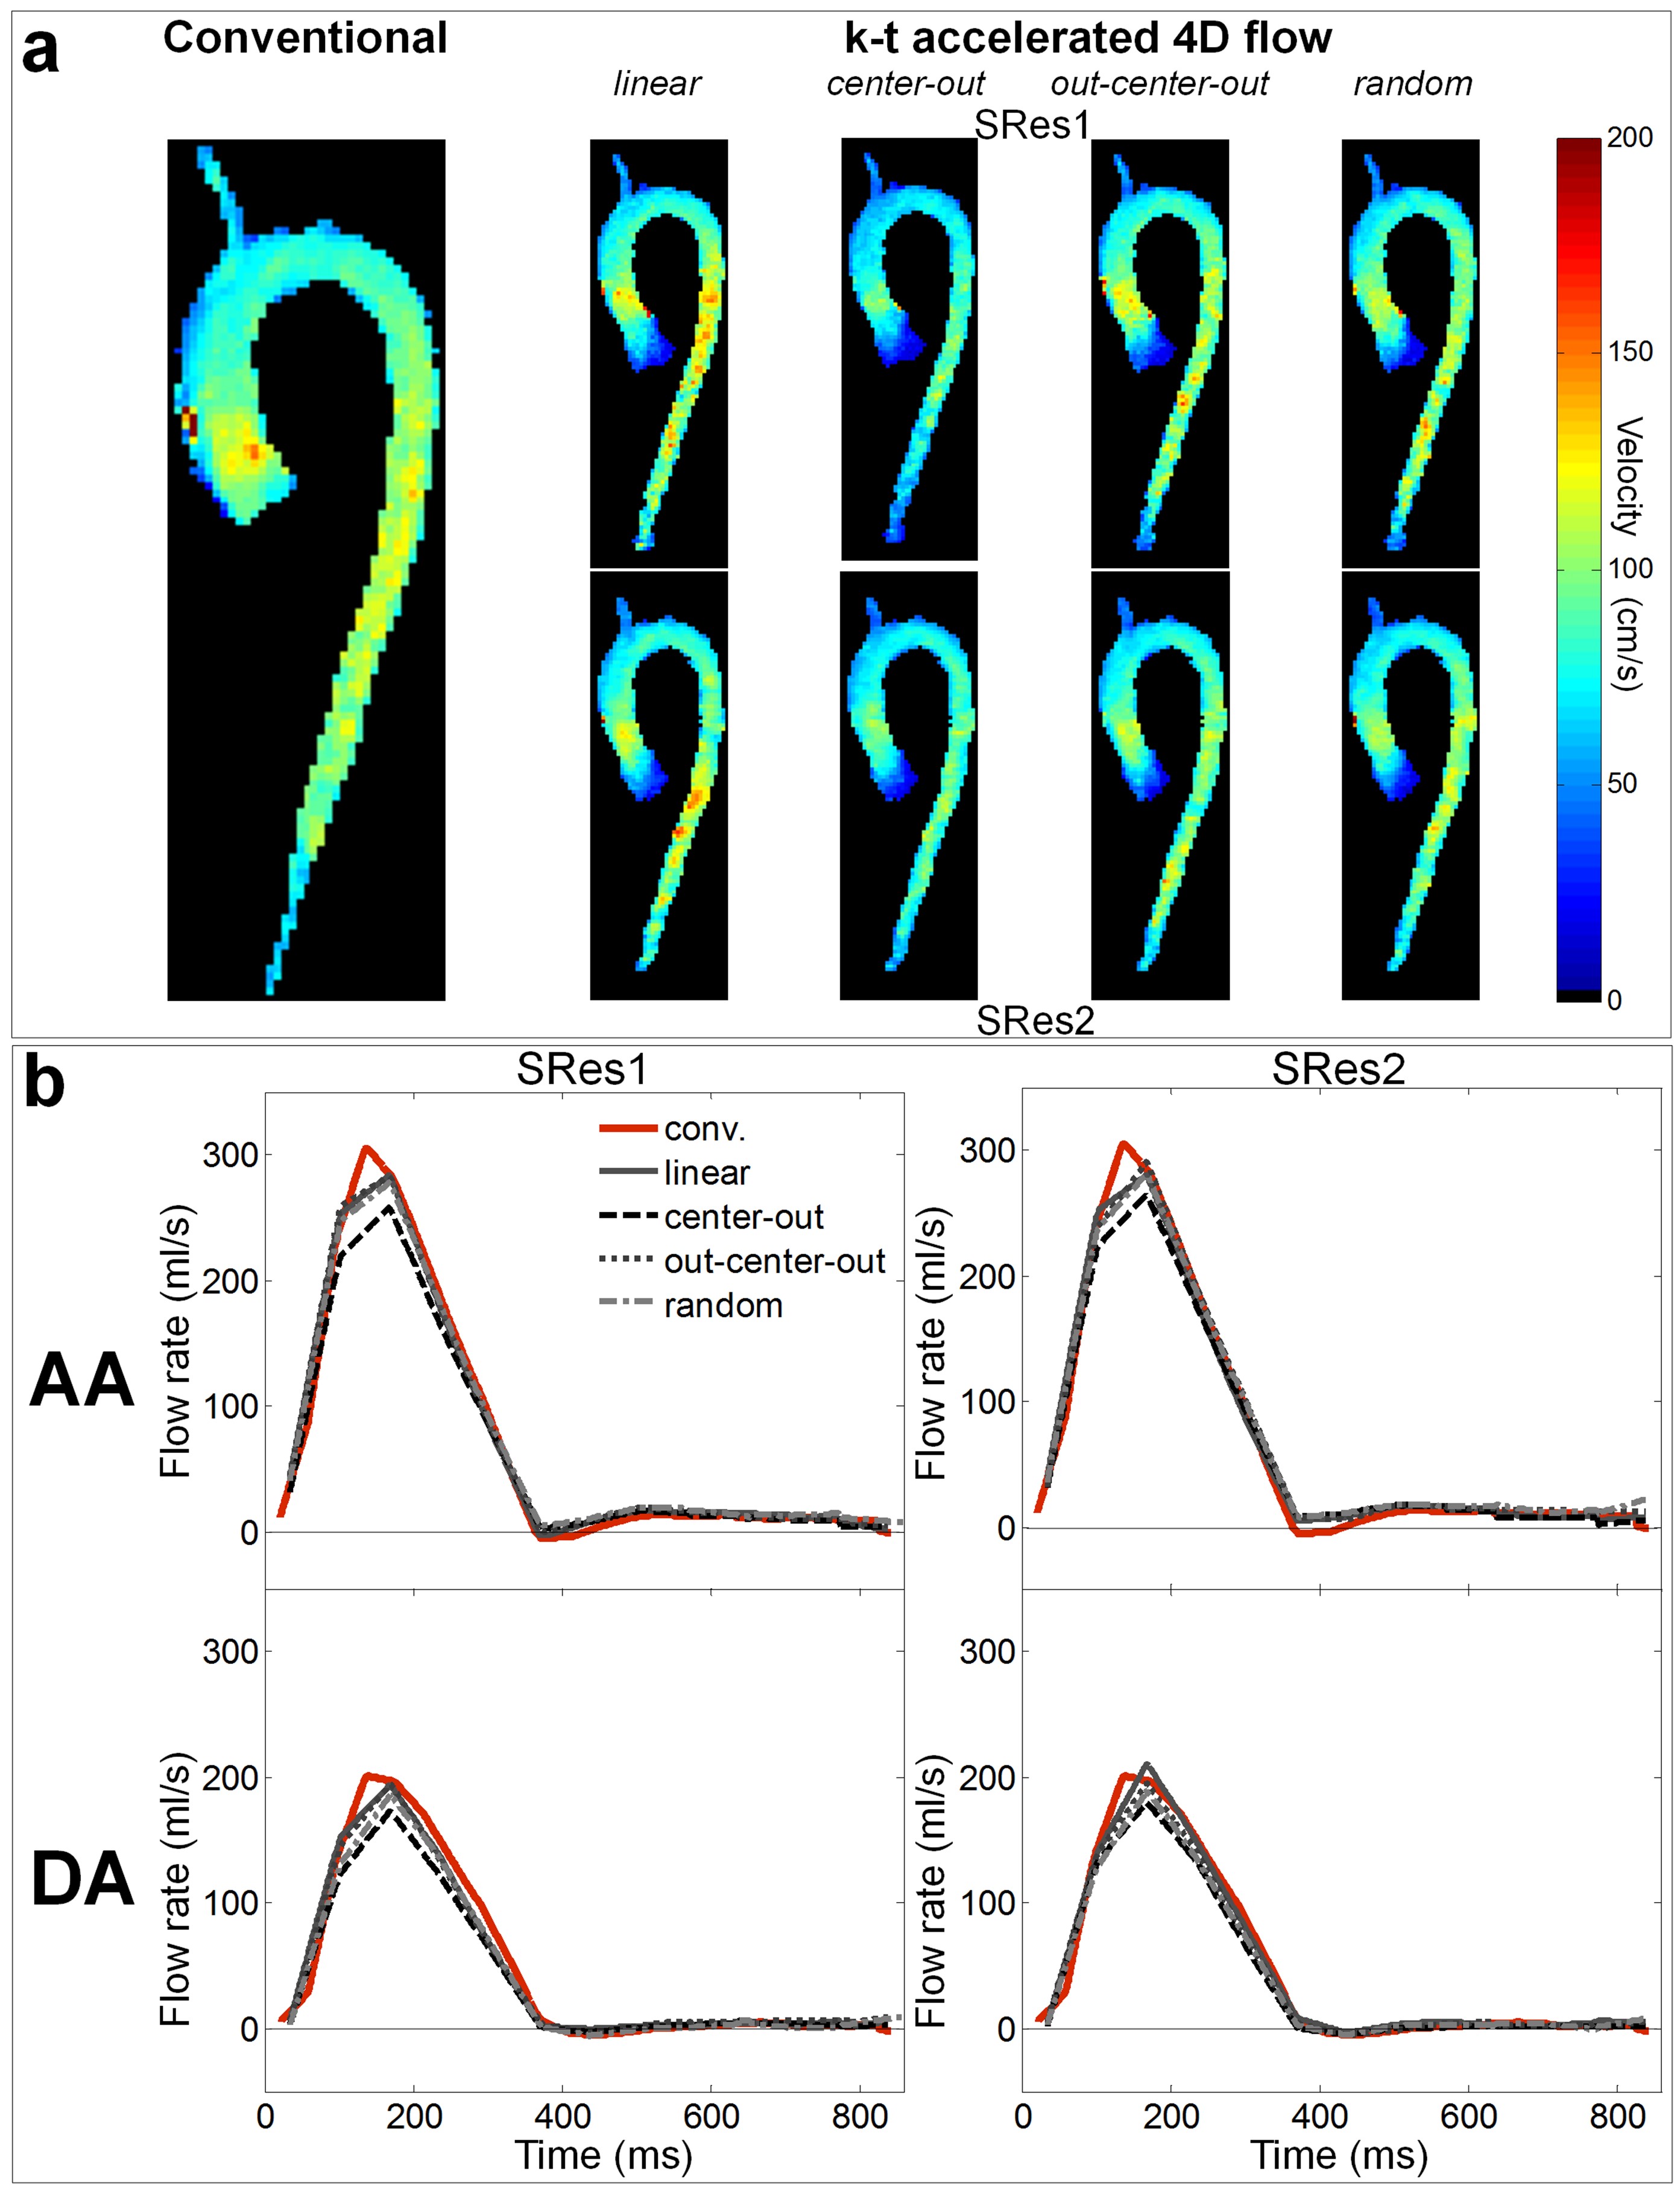
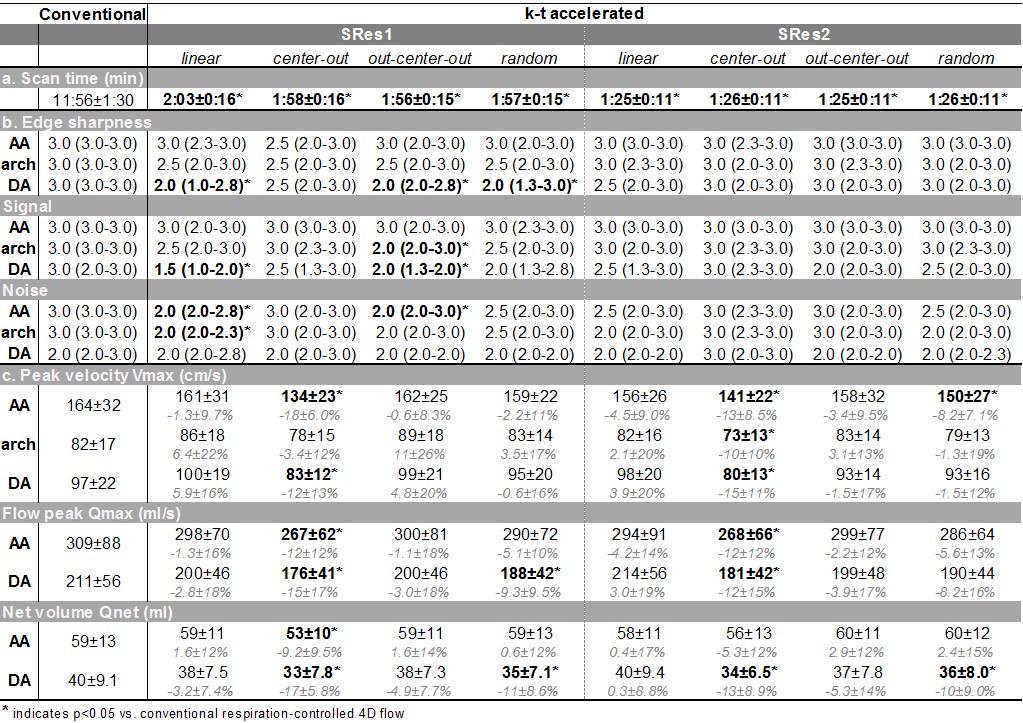
Conventional and the 8 k-t accelerated 4D flow MRI datasets were successfully acquired on the phantom and 10 volunteers (total n=99 datasets). In vitro scan time was 9:27, 2:16 and 1:53 minutes for the conventional and the k-t accelerated acquisitions with SRes1 and SRes2 spatial resolutions, respectively. k-t accelerated aortic Qmax, Qnet and Vmax were lower than the reference conventional 4D flow indices by ≤4.7%, ≤11%, and ≤22%, respectively, with highest differences observed in the DA coarctation (Figure 2.b). In vivo k-t accelerated acquisitions were significantly shorter than conventional 4D flow (Table 1.a, p=0.002). Figure 3 illustrates examples of 4D flow magnitude images and 3D PC-MRA MIPs. Image quality was overall reduced for k-t accelerated data when compared against conventional 4D flow (Table 1.b). Finally, results of regional flow quantification are summarized in Table 1.c. Examples of in vivo peak systolic velocity MIPs are shown in Figure 4, along with cohort-averaged AA and DA flow waveforms. A Bland-Altman analysis revealed overall lowest biases compared to conventional 4D flow MRI when using the out-center-out ky-kz sampling pattern (mean biases [limits of agreement]: from -6.3 [-39;26] to 7.4 [-27;41] cm/s for Vmax, -12 [-73;49] to -8.9 [-120;103] ml/s for Qmax, -2.7 [-13;7.2] to 1.1 [-13;15] ml for Qnet).DISCUSSION
Our main findings were that: 1) aortic 4D flow under 2 minutes is feasible but can lead to a moderate underestimation of hemodynamic indices and particularly of peak systolic velocity; 2) free breathing without controlling for respiratory motion reduces image quality but flow and velocity indices for specific k-space ordering schemes (linear, out-center-out) were close to those obtained using conventional navigator-gated 4D flow; 3) the observed differences in k-space sampling patterns suggest an opportunity to mitigate some image artifacts and velocity errors by adapting k-space filling. A limitation of our work is the lack of inter-exam variability or patient data; however, recruitment of patients is currently under progress to confirm if our findings are still valid in case of complex flow dynamics with high velocity and acceleration. Other previously described acceleration7-9 and respiratory control10 methods should also be explored in future studies to help defining the best compromise between short scan time and breathing motion correction.CONCLUSION
Aortic 4D flow MRI in under 2 minutes is feasible and easy to use, with no navigator placement and set-up required before the actual acquisition, providing moderate underestimation of flow indices. Differences reported in this preliminary study on an in vitro phantom and in healthy volunteers suggest an opportunity to mitigate image artifacts by an optimal trade-off between scan time, acceleration, and k-space sampling.Acknowledgements
This work was supported by the National Institutes of Health grants R01HL115828 and K25HL119608 as well as the American Heart Association Midwest Affiliate grant 16POST27250158.References
1. van Ooij P, Semaan E, Schnell S, et al. Improved respiratory navigator gating for thoracic 4D flow MRI. Magn Reson Imaging. 2015;33(8):992-9.
2. Jung B, Ullmann P, Honal M, et al. Parallel MRI with extended and averaged GRAPPA kernels (PEAK-GRAPPA): optimized spatiotemporal dynamic imaging. J Magn Reson Imaging. 2008;28(5):1226-32.
3. Dyverfeldt P, Bissell M, Barker AJ, et al. 4D flow cardiovascular magnetic resonance consensus statement. J Cardiovasc Magn Reson. 2015;17:72.
4. Markl M, Harloff A, Bley TA, et al. Time-resolved 3D MR velocity mapping at 3T: improved navigator-gated assessment of vascular anatomy and blood flow. J Magn Reson Imaging. 2007;25(4):824-31.
5. Rose MJ, Jarvis K, Chowdhary V, et al. Efficient method for volumetric assessment of peak blood flow velocity using 4D flow MRI. J Magn Reson Imaging. 2016 (in press).
6. Stalder AF, Russe MF, Frydrychowicz A, et al. Quantitative 2D and 3D phase contrast MRI: optimized analysis of blood flow and vessel wall parameters. Magn Reson Med. 2008;60(5):1218-31.
7. Baltes C, Kozerke S, Hansen MS, et al. Accelerating cine phase-contrast flow measurements using k-t BLAST and k-t SENSE. Magn Reson Med. 2005;54(6):1430-8.
8. Giese D, Schaeffter T, Kozerke S. Highly undersampled phase-contrast flow measurements using compartment-based k-t principal component analysis. Magn Reson Med. 2013;69(2):434-43.
9. Tariq U, Hsiao A, Alley M, et al. Venous and arterial flow quantification are equally accurate and precise with parallel imaging compressed sensing 4D phase contrast MRI. J Magn Reson Imaging. 2013;37(6):1419-26.
10. Uribe S, Beerbaum P, Sorensen TS, et al. Four-dimensional (4D) flow of the whole heart and great vessels using real-time respiratory self-gating. Magn Reson Med. 2009;62(4):984-92.
Figures