0422
A Bayesian Approach to Enable Single Breath-Hold 4D Flow MRI1Electrical and Computer Engineering, The Ohio State University, Columbus, OH, United States, 2Dorothy M. Davis Heart and Lung Research Institute, The Ohio State University, Columbus, OH, United States, 3Siemens Medical Solutions, Columbus, OH, United States, 4Department of Radiology, Columbus, OH, United States, 5Division of Cardiovascular Medicine Department of Internal Medicine, Columbus, OH, United States
Synopsis
PC-MRI based 4D flow imaging is a powerful tool to quantify hemodynamics within the heart and the great vessels. We develop a Bayesian technique to greatly accelerate 4D flow image acquisition. Our technique exploits the rich structure in 4D flow images within a joint reconstruction algorithm. We validate the technique using retrospectively accelerated flow phantom data and prospectively accelerated, single breath-hold in vivo data. In the flow phantom, stroke volume differed by ≤9% for R≤28 when compared to fully sampled data. The high acceleration provided by the Bayesian approach could allow for clinical application of single breath-hold 4D flow imaging.
Purpose
Hemodynamic changes within the heart and great vessels have been linked to various cardiovascular conditions including valvular stenosis. Quantification of hemodynamic parameters can lead to better understanding of the pathophysiology of the cardiac system. MRI-based 4D Flow imaging is a non-invasive tool that allows for visualization of flow patterns in 3D space and quantification of hemodynamic parameters such as stroke volume, peak velocity, wall shear stress, pulse wave velocity, and turbulence. However, the benefits of 4D flow MRI are often limited by long scan times1. We present a Bayesian imaging approach to accelerate acquisition for 4D flow imaging by R=22. We evaluate the technique using retrospectively accelerated phantom data and prospectively accelerated in vivo data collected in a single breath-hold.Theory
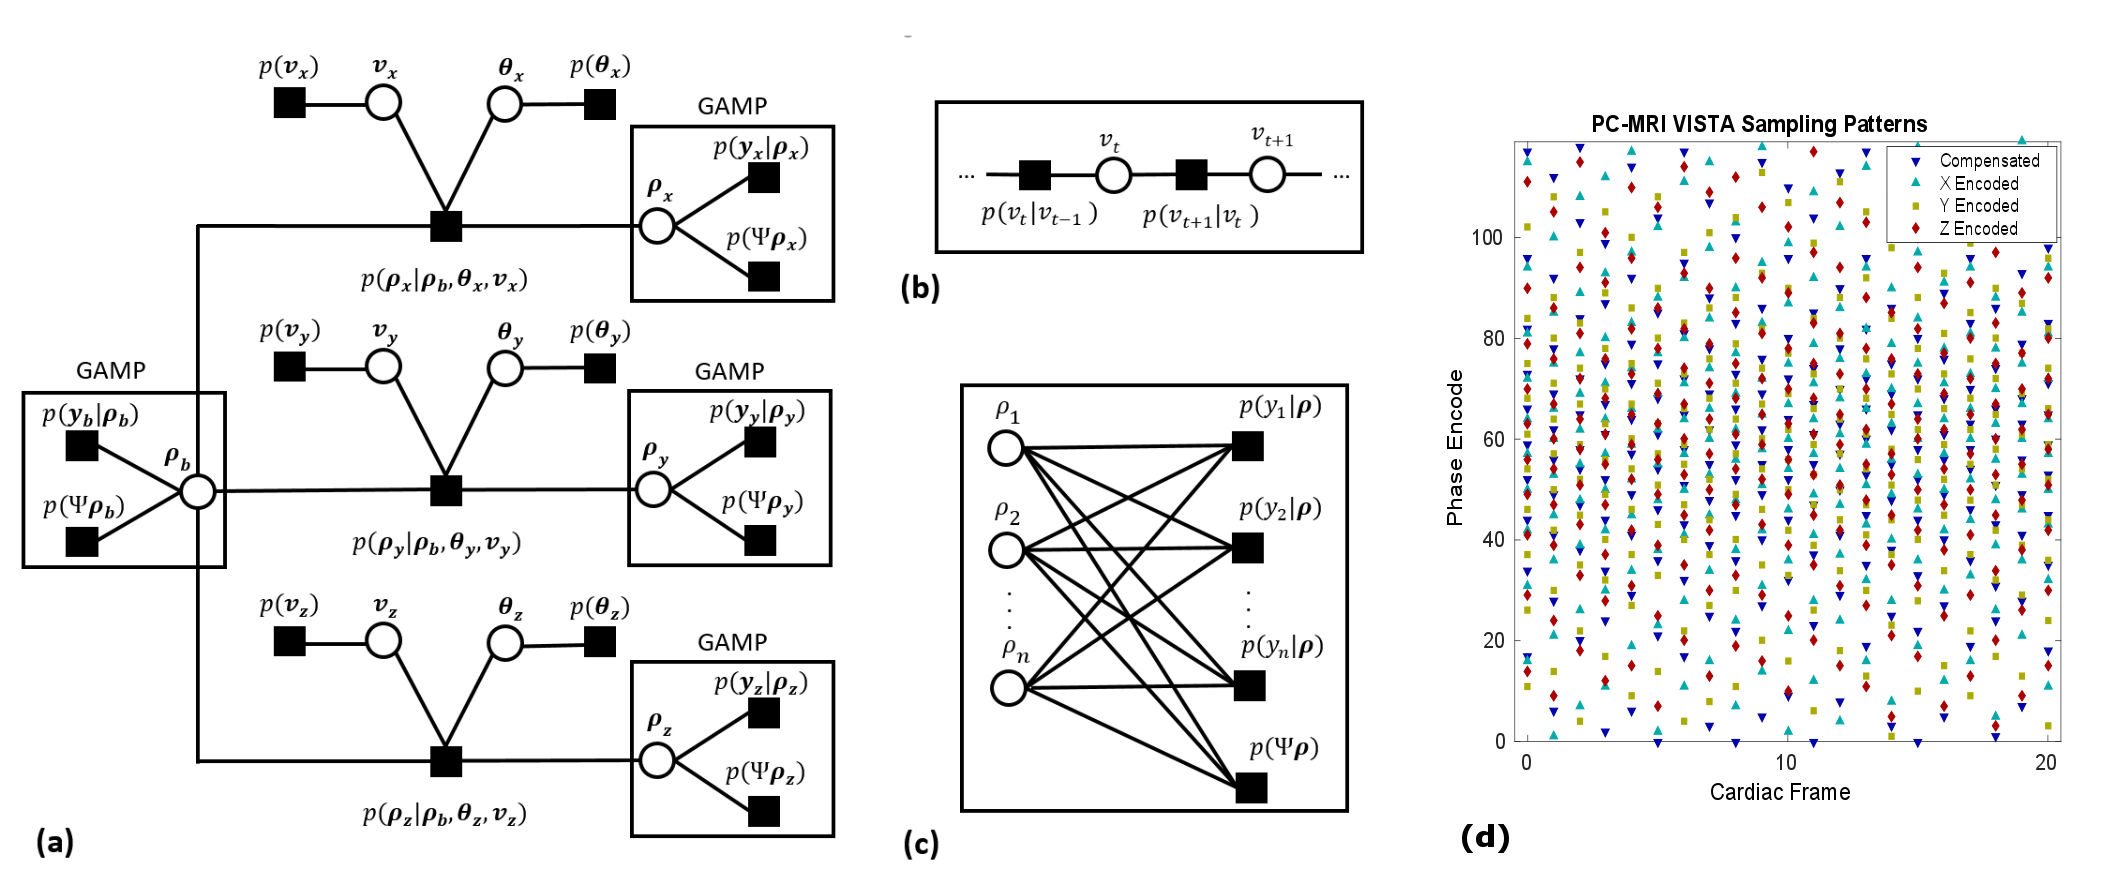
We present an empirical Bayes approach for inversion of highly accelerated 4D flow data. The work extends the previously described ReVEAL technique2 to 4D flow imaging. The proposed technique exploits similarities in magnitude and phase across velocity encodings through a mixture probability density, which exploits different regularizing constraints based on the presence (or absence) of velocity in a voxel. The Bayesian model uses a hidden indicator variable to automatically estimate the probability of non-zero velocity at each voxel. An additional regularizing constraint is imposed via a cosparse prior on the 4D spatio-temporal, non-decimated wavelet coefficients. We use a novel extension to the VISTA sampling pattern3 to provide sampling patterns jointly optimized over two spatial dimensions, one time dimension, and velocity encodings. Finally, from the joint posterior distribution, we create a factor graph depicted in Figure 1 (a)-(c). Through application of standard and loopy belief propagation, an iterative inversion algorithm is formed from the probabilistic model.Methods
Two data sets were collected for this study using a 1.5 T scanner (Avanto, Siemns Healthcare, Erlangen, Germany) with a gradient echo pulse sequence and an 18 channel cardiac array. The first was fully sampled flow phantom data, which was retrospectively accelerated. The second was prospectively accelerated in vivo data. A referenced, four point encoding with prospectively triggered acquisition was used for both data sets. ReVEAL is compared against L1-SENSE which does not exploit the inter-encoding structure but only relies on the cosparse prior in the spatio-temporal domain.
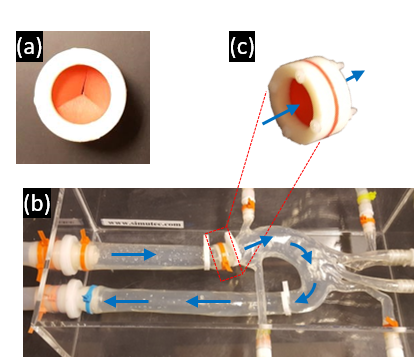
Flow phantom study: A mechanical flow phantom was constructed from an aortic arch phantom and a synthetic valve. The flow phantom, depicted in Figure 2, was driven by a CardioFlow 5000 MR flow pump (Shelley Medical Imaging Technologies, Toronto, Ontario, Canada). The fully sampled data were retrospectively undersampled by acceleration factors R = 8-30 using VISTA sampling. The scan parameters for this acquisition were flip angle 10°, TE 2.34ms, TR = 4.4ms, VENC 420 cm/s, temporal resolution 35.1 ms, FOV 402x226x60 mm, and 2.1 mm isotropic resolution.
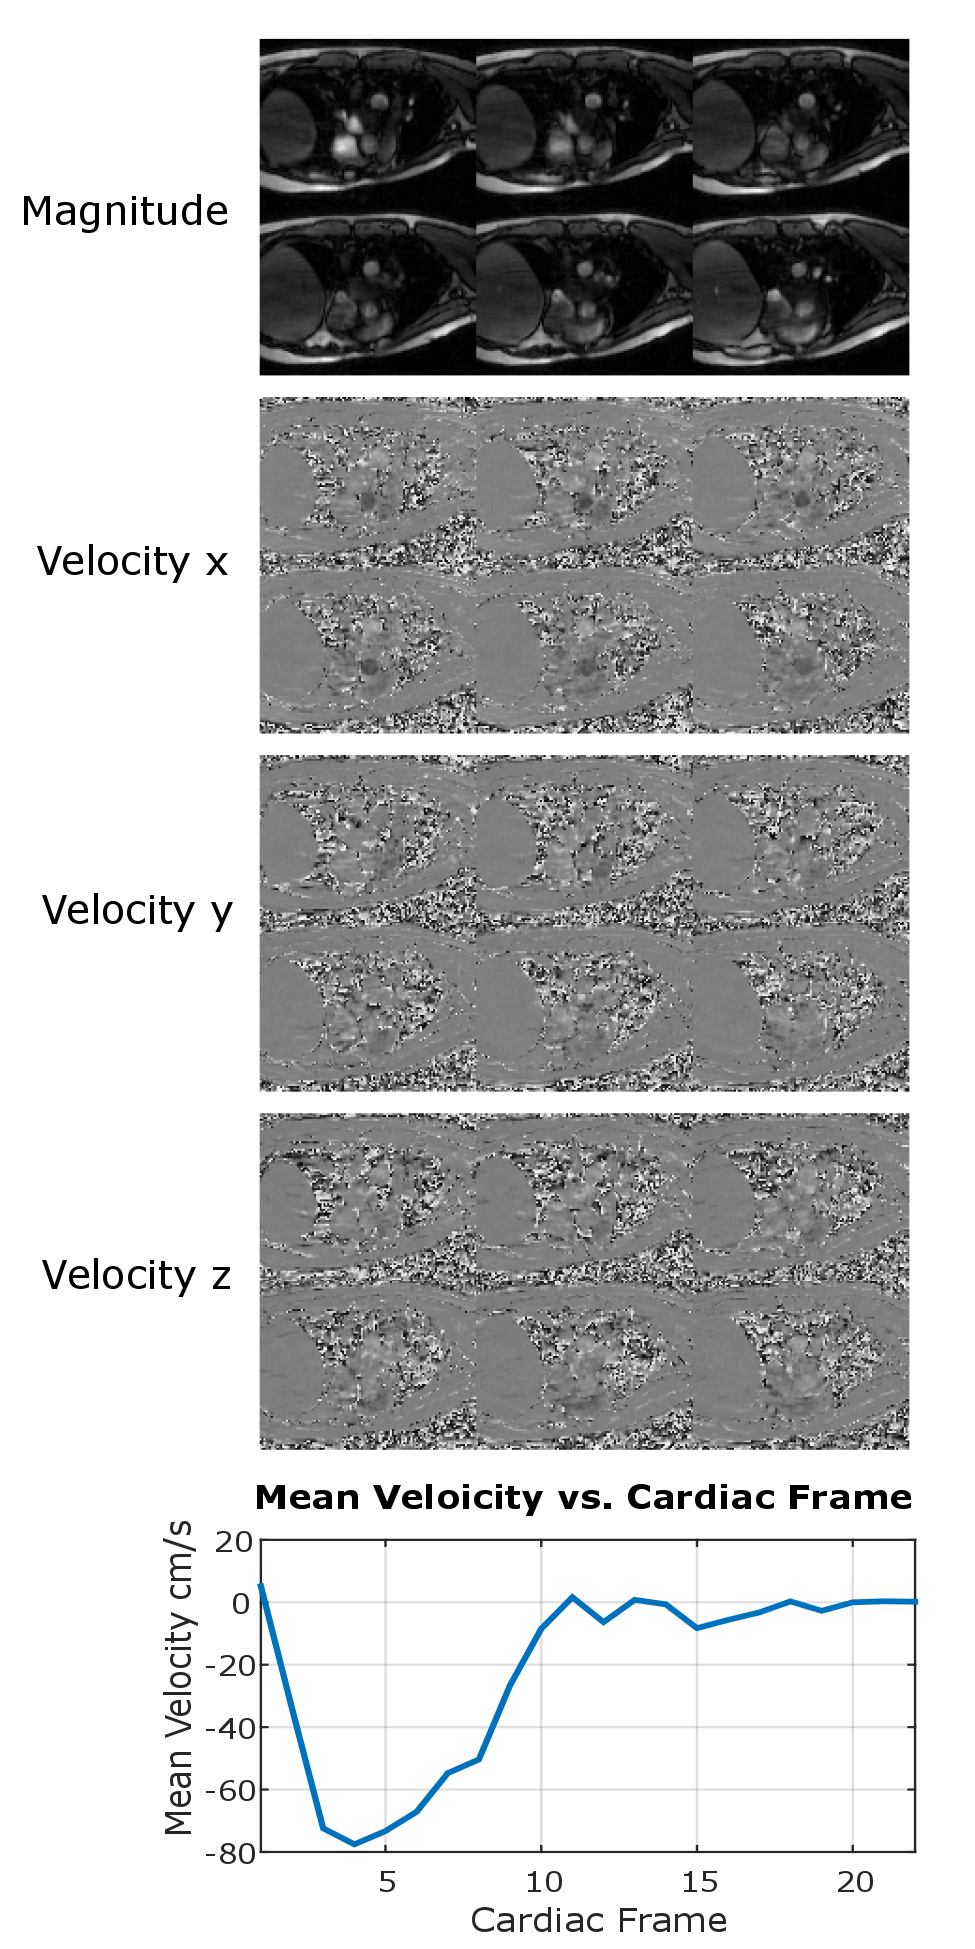
Single breath-hold In vivo study: Prospectively accelerated (R=22) in vivo data were collected from a healthy volunteer in a single 24 second long breath-hold. The 48 mm imaging slab was centered at the aortic valve and oriented approximately perpendicular to the main direction of the flow through the valve. Pertinent scan parameters were flip angle 15°, TE 2.5ms, TR = 4.65ms, VENC 200 cm/s, temporal resolution 37.2 ms, FOV 330x237x48 mm, and 2.6x2.6x6 mm spatial resolution.
Results
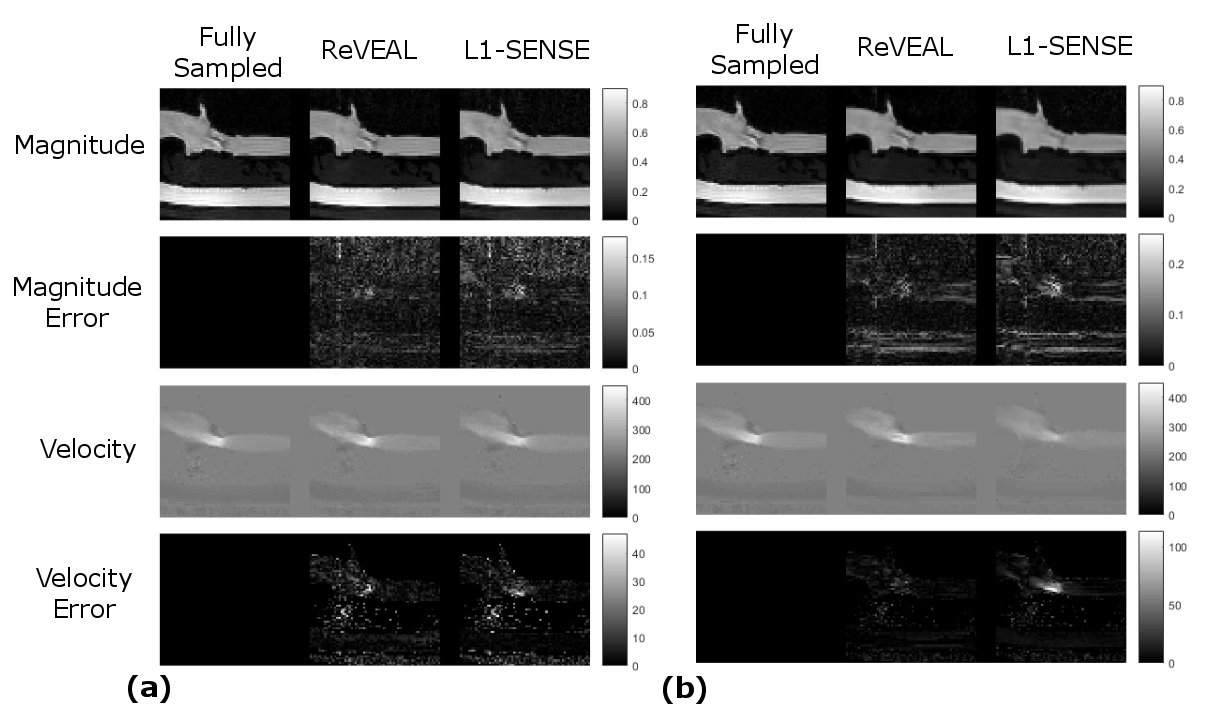
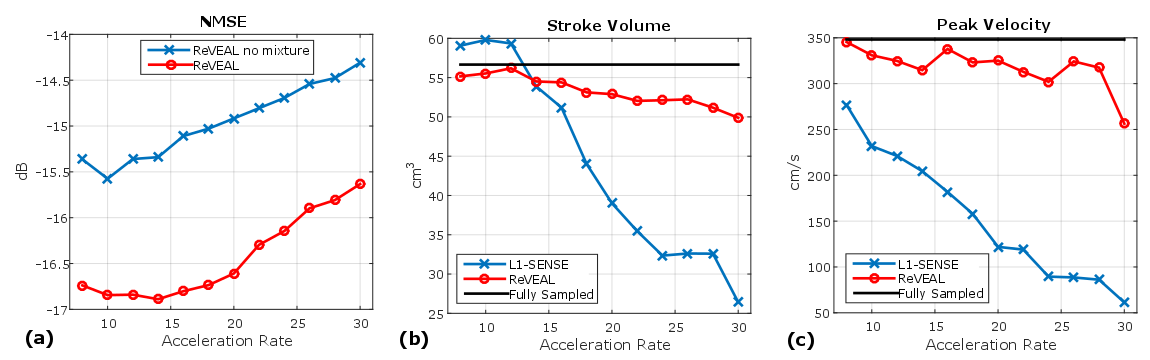
In Figure 3 (a)-(b), flow phantom reconstructed images using ReVEAL and L1-SENSE are compared to fully sampled data. In Figure 4, quality metrics for flow phantom data are presented. The normalized mean squared error, peak velocity (PV), and stroke volume (SV) are displayed versus acceleration rate. Magnitude and velocity images for single breath hold in vivo data are given in Figure 5.Discussion and Conclusions
ReVEAL enables highly accelerated 4D flow imaging and consistently outperforms L1-SENSE, which does not exploit the rich structure across velocity encodings. The phantom data indicates that quantification of SV is within 9% and PV is within 13% for ReVEAL for R≤28. In contrast, L1-SENSE significantly underestimates PV at R≥8 and SV at R≥16. Preliminary in vivo data suggests that the acceleration afforded by ReVEAL may enable single breath-hold 4D flow imaging of patients with valvular stenosis, which requires a limited spatial coverage around the valve. Alternatively, ReVEAL can be combined with respiratory gating based free-breathing imaging to reduce the acquisition time from 20-30 minutes to 2-3 minutes. Future work includes validating ReVEAL in larger populations of healthy individuals and patients with valvular stenosis.Acknowledgements
This work was funded in part by NIH grant R21EB021655References
1. Markl et al. Comprehensive 4D velocity mapping of the heart and great vessels by cardiovascular magnetic resonance. J Cardiovasc Magn Reson. 2011;13(7):1-22. 2. Rich et al., A Bayesian model for highly accelerated phase-contrast MRI, Magn Reson Med. 2016;76(2):689–701 3. Ahmad R. et al. Variable density incoherent spatiotemporal acquisition (VISTA) for highly accelerated cardiac MRI. Magn Reson Med. 2015;74(5):1266-1278. 4 S. Rangan, Generalized approximate message passing for estimation with random linear mixing, in Proc. IEEE Int. Symp. Inform. Thy., pp. 2168–2172, Jul 2011.Figures