0420
Comparative Myelin Imaging and Multi-Shot Diffusion Tensor Imaging in Multiple Sclerosis Cervical Spinal Cord1Neuroradiology, Technische Universität Dresden, Dresden, Germany, 2Neurology, Technische Universität Dresden, Dresden, Germany, 3Pediatric Radiology Research, Children's Hospital, Colorado, University of Colorado Medical School, Boulder, CO, United States
Synopsis
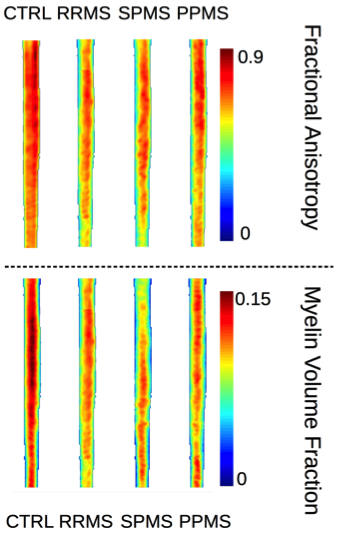
Spinal cord myelin imaging holds potential to quantify cervical spinal cord tissue myelin loss, and hence, the subtle spinal burden of demyelinating diseases, invisible for conventional magnetic resonance imaging. We present the approach of combined spinal 3D double-inversion recovery imaging with diffusion tensor imaging and myelin sensitive multicomponent driven equilibrium single pulse observation of T1 and T2, with subsequent normal spine space registration and group comparison in different multiple sclerosis courses. Whereas no significant differences were found between the different disease courses using fractional anisotropy, relapsing-remitting and primary-progressive multiple sclerosis were discriminated based on differences in relative cord myelin content.
Purpose:
Spinal
cord magnetic resonance imaging (MRI) plays an important role in the diagnostic
procedure of Multiple Sclerosis (MS) since the cervical spinal cord is the most
frequent predilection site of disease related inflammatory demyelination
outside of the brain. The inhomogeneous frequency of occurrence of spinal cord
symptoms and elusive conventional MRI lesions suggest subtle changes in even
normal appearing spinal cord tissue. However, sequences sensitive to
inflammatory spinal cord tissue signal changes, suitable to apply normal
spine space registration, and, voxel-based analysis, were available just
recently. We combined 3D spinal cord DIR, diffusion tensor imaging (DTI) with
myelin imaging using multicomponent driven equilibrium single pulse observation
of T1 and T2 (mcDESPOT)1.
Methods:
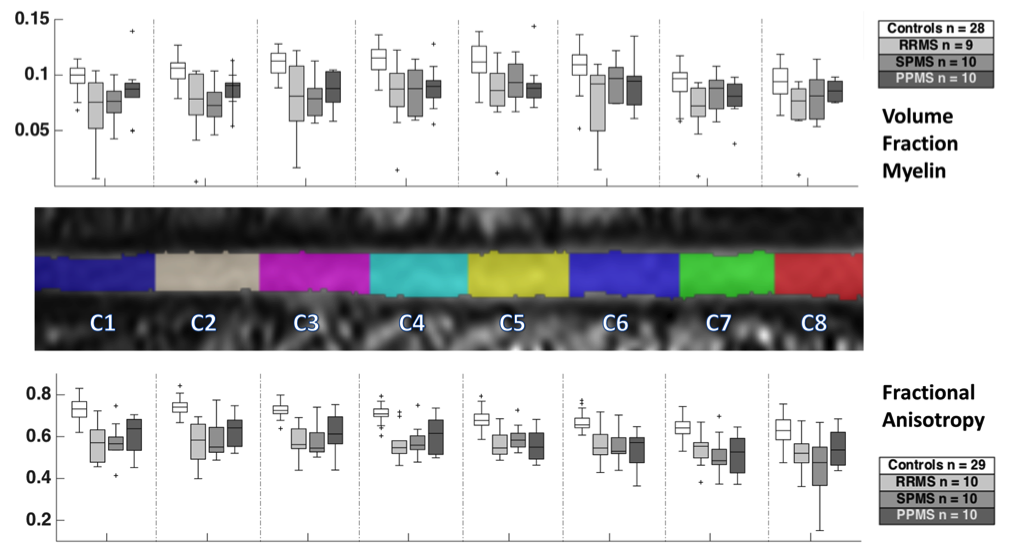
Clinically definite MS patients (n = 30; age 44.4 ± 12.1 years; F/M 17/14; averaged years since symptom onset 10 ± 13) of different courses (relapsing-remitting (RRMS); n =10, secondary (SPMS); n = 10, and, primary progressive (PPMS); n = 10) were scanned. The control group consisted of 29 subjects (age 39.9 ± 13.2, F/M 24/5. Data was acquired on a SIEMENS Verio 3T MR scanner and included mcDESPOT: FLASH (TR: 5.9ms, FA = [4, 5.3, 6.6, 8, 9.3, 12, 17.3, 24]°), trueFISP (TR 5.6ms; FA = [9.8, 13.1, 16.4, 19.7, 22.9, 29.5, 42.6, 59]°) and inversion prepared FLASH (TR 5.7ms, FA = 5°, TI [450, 700] ms, PE 72), double-inversion recovery (space DIR) 1.5mm isotropic resolution, and additional multi-shot DTI (RESOLVE) using 20 diffusion directions, b = 800/0, 1.8mm isotropic resolution. Both volume fraction of myelin (VFM) derived from mcDESPOT and fractional anisotropy (FA) from DTI were retrieved. Processing was done using the SpinalCordToolbox v2.2.02 and additional python scripts for workflow automatization. The MNI-Poly-AMU normalization reference template was used and label masks for spinal cord segments C1-C8 were generated. The MATLAB statistical toolbox was used for the analysis of group differences by means of Wilcoxon rank sum test.Results:
Mean VFM and FA of C1 through C8 were 0.104±0.016 / 0.691±0.061 for the control group, and, RRMS: 0.075±0.030 / 0.546±0.117, SPMS: 0.083±0.019 / 0.553±0.099, and, PPMS: 0.087±0.018 / 0.576±0.093, respectively. The FA of the controls and the entire patient group differed significantly (p < 0.001), but no significant difference was found between the different MS courses. Patients and controls also differed significantly in cervical spinal cord mean VFM. However, in contrast to FA, the RRMS and PPMS groups could be discriminated based on significantly different VFM values (p < 0.05).Discussion & Conclusion:
Successful spinal cord myelin imaging using mcDESPOT has recently been shown3. Our study further demonstrates that approaches established in quantitative brain imaging4 can be translated to spinal cord myelin imaging and comparative observational studies. The preliminary results revealed differences in relative myelin content in different MS courses that may provide a discriminative marker. These findings will be further refined by comparison of lesional and non-lesional MS cervical spinal cord tissue myelin loss.Acknowledgements
No acknowledgement found.References
[1] Doni et al., Magn Reson Med. 2008;6;1372-87
[2] http://www.nitrc.org/projects/sct
[3] Kolind & Deoni, Magn Reson Med. 2011;65(2):551-6
[4] Kitzler et al., NeuroImage. 2012;59(3):2670-7
Figures