0419
Column-specific demyelination in Spinal Cord Normal Appearing White Matter occurring in Multiple Sclerosis: A preliminary study using inhomogeneous Magnetization Transfer and DTI1Aix Marseille Univ, CNRS, CRMBM, Marseille, France, 2AP-HM, Pôle d'Imagerie Médicale, Hopital de La Timone, CEMEREM, Marseille, France, 3iLab-Spine International Associated Laboratory, Marseille, France, 4Aix Marseille Univ, APHM, Hopital de La Timone, Pôle de Neurosciences Cliniques, Service de Neurologie, Marseille, France
Synopsis
This preliminary study investigates the added value of the inhomogeneous Magnetization Transfer (ihMT) technique when studying Spinal Cord (SC) tissue demyelination occurring in Multiple Sclerosis (MS). DTI and MT/ihMT data collected in 9 MS patients, analyzed in specific normal appearing white matter regions, indicated significant demyelination in corticospinal and posterior sensory tracts as compared to age-matched healthy controls, with a very high sensitivity of ihMTR that appears very promising for further objective therapeutic evaluation or topographic quantification of progressive SC demyelination.
Introduction
Many studies have reported evidence of SC tissue demyelination in Multiple Sclerosis (MS) using anatomical imaging, Diffusion Tensor Imaging (DTI), or more particularly Magnetization Transfer (MT) imaging [1-6]. It is however well known that classic MT exhibits specificity limitations [7]. Hence, new advanced MT techniques were reported, among them, the emerging inhomogeneous MT (ihMT) technique [8-10] that has proven to be more specific to myelin-containing tissue than MT. This promising technique, recently used in the SC [10, 11] has nonetheless never been used in MS studies at the SC level. In this study, we used a multi-parametric (mp-) MR protocol including anatomical, DTI and MT/ihMT imaging, in order to assess the structural changes, especially demyelination, occurring within specific SC regions of interest (ROIs) and investigate the added value of ihMT in the pathological context.Material and methods
Subjects
9 remittent and secondary progressive MS patients with various degree of spinal cord related disability (59±8yo, EDSS=4.6±1.9) and 18 age-matched healthy controls (HC, 54±10yo) were scanned using a 3T scanner (Magnetom Verio, Siemens Healthcare, Erlangen, Germany) and commercial RF coils. Clinical scores for MS patients included EDSS (Expanded Disability Status Scale) and Medical Research Council (MRC) Scale.
MR Protocol
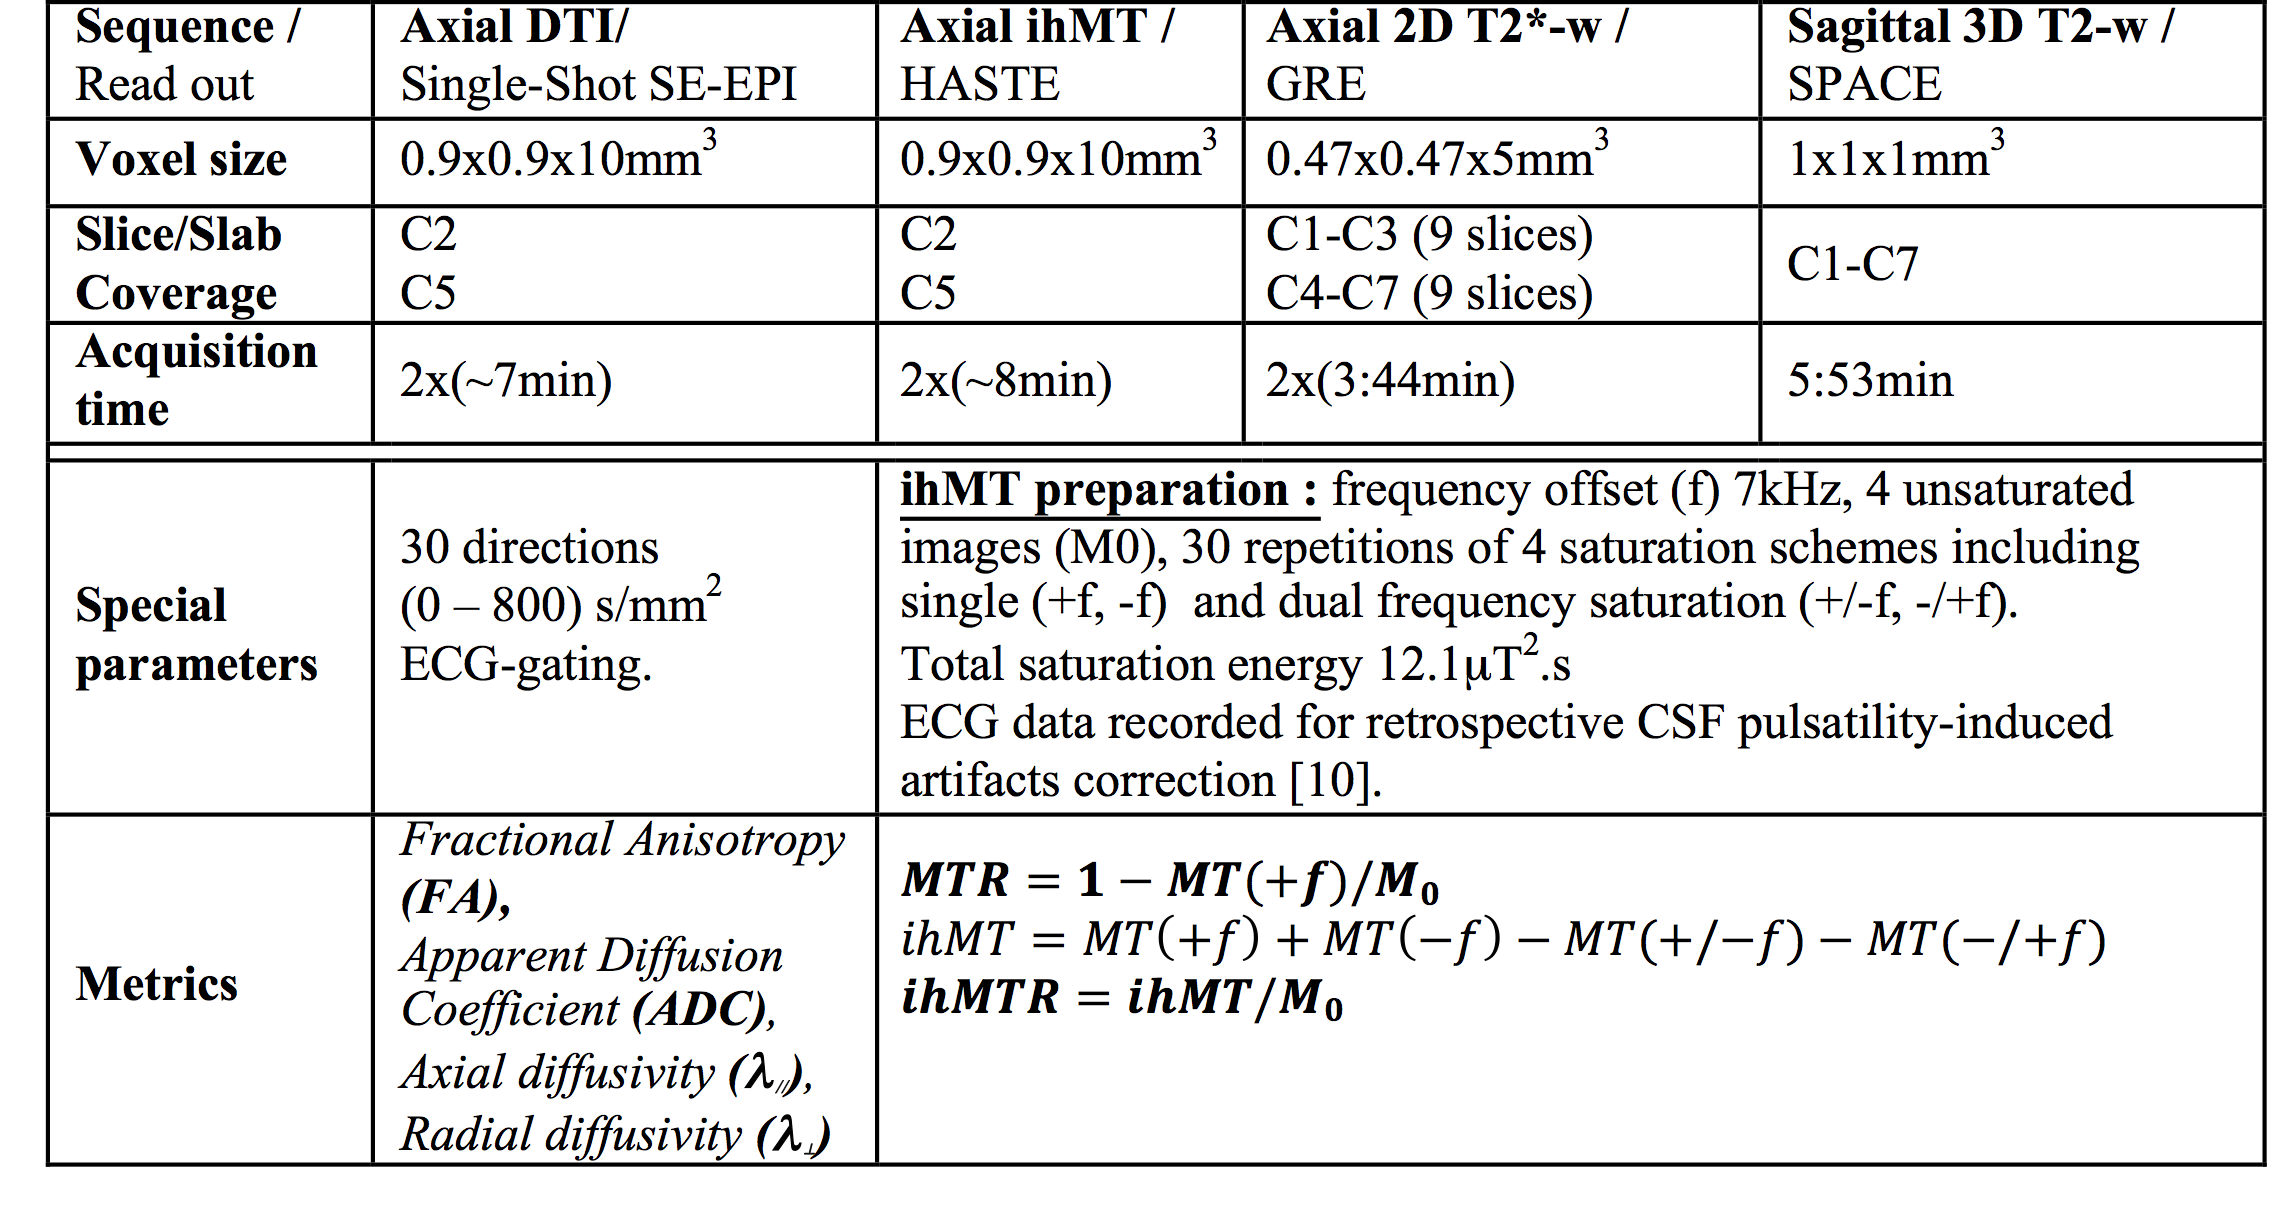
Total Scanning time was approximately 50 minutes. The main sequence parameters are presented in Figure 1.
Post-processing
Post-processing relied on a customized MATLAB pipeline based on the SC Toolbox [12] and dedicated SC MR templates and atlas (MNI-Poly-AMU[13], AMU40[14] and WM_tracts[15]) allowing automatic T2*-weighted images-based GM/WM segmentation and ROIs delimitation. DTI and MT/ihMT metrics were extracted within bilateral corticospinal tracts (CST) and posterior sensory tracts (PST) at both C2 and C5 cervical levels, in MS and HC. Regions with lesions were manually identified on T2*-w images and analyzed separately. Cross-sectional areas (CSA) were extracted from GM/WM segmentations at each cervical level from C1 to C6. Statistical analyses comparing MS and HC subjects were performed for each metric at each level. P-values less than 0.05 were considered statistically significant.
Results and Discussion
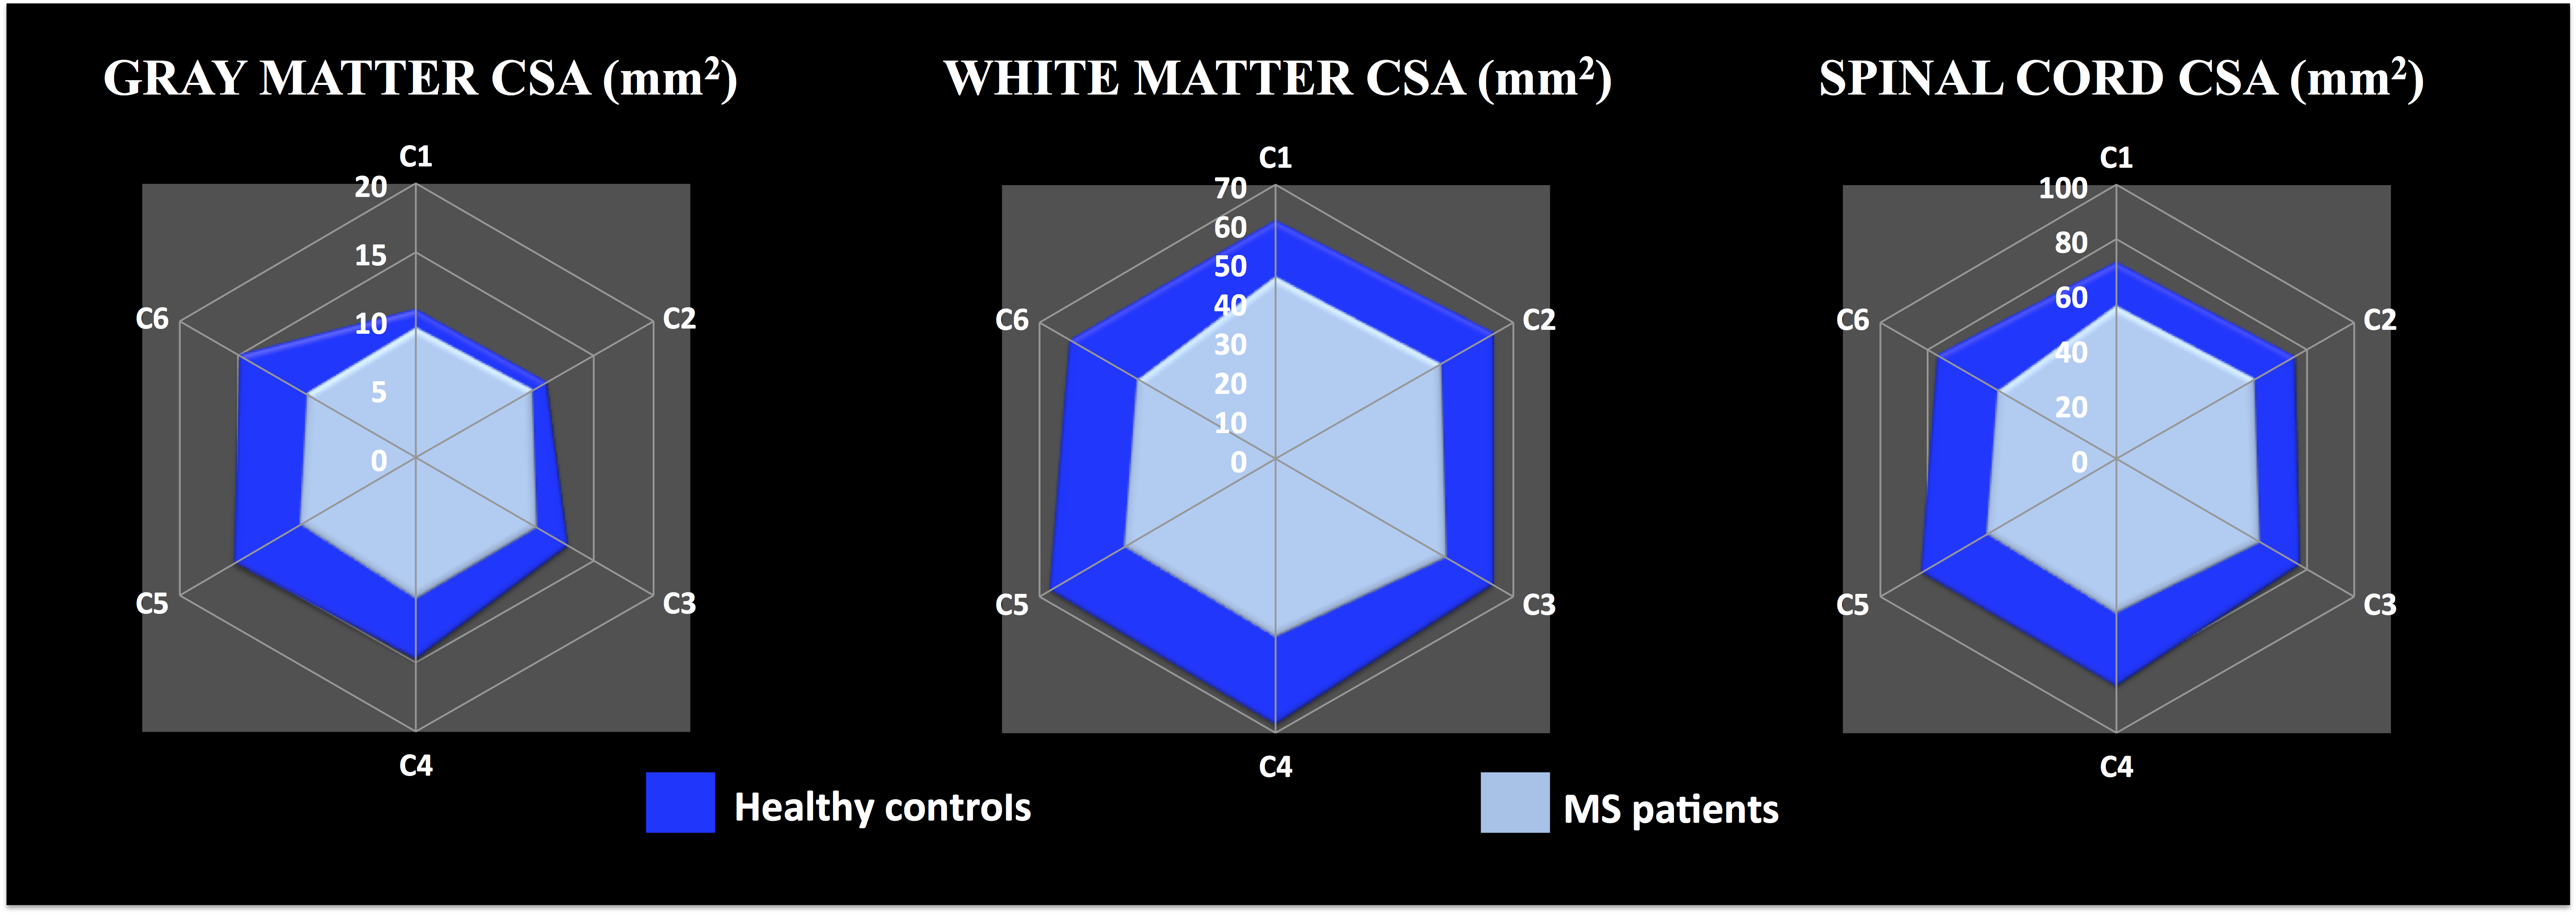
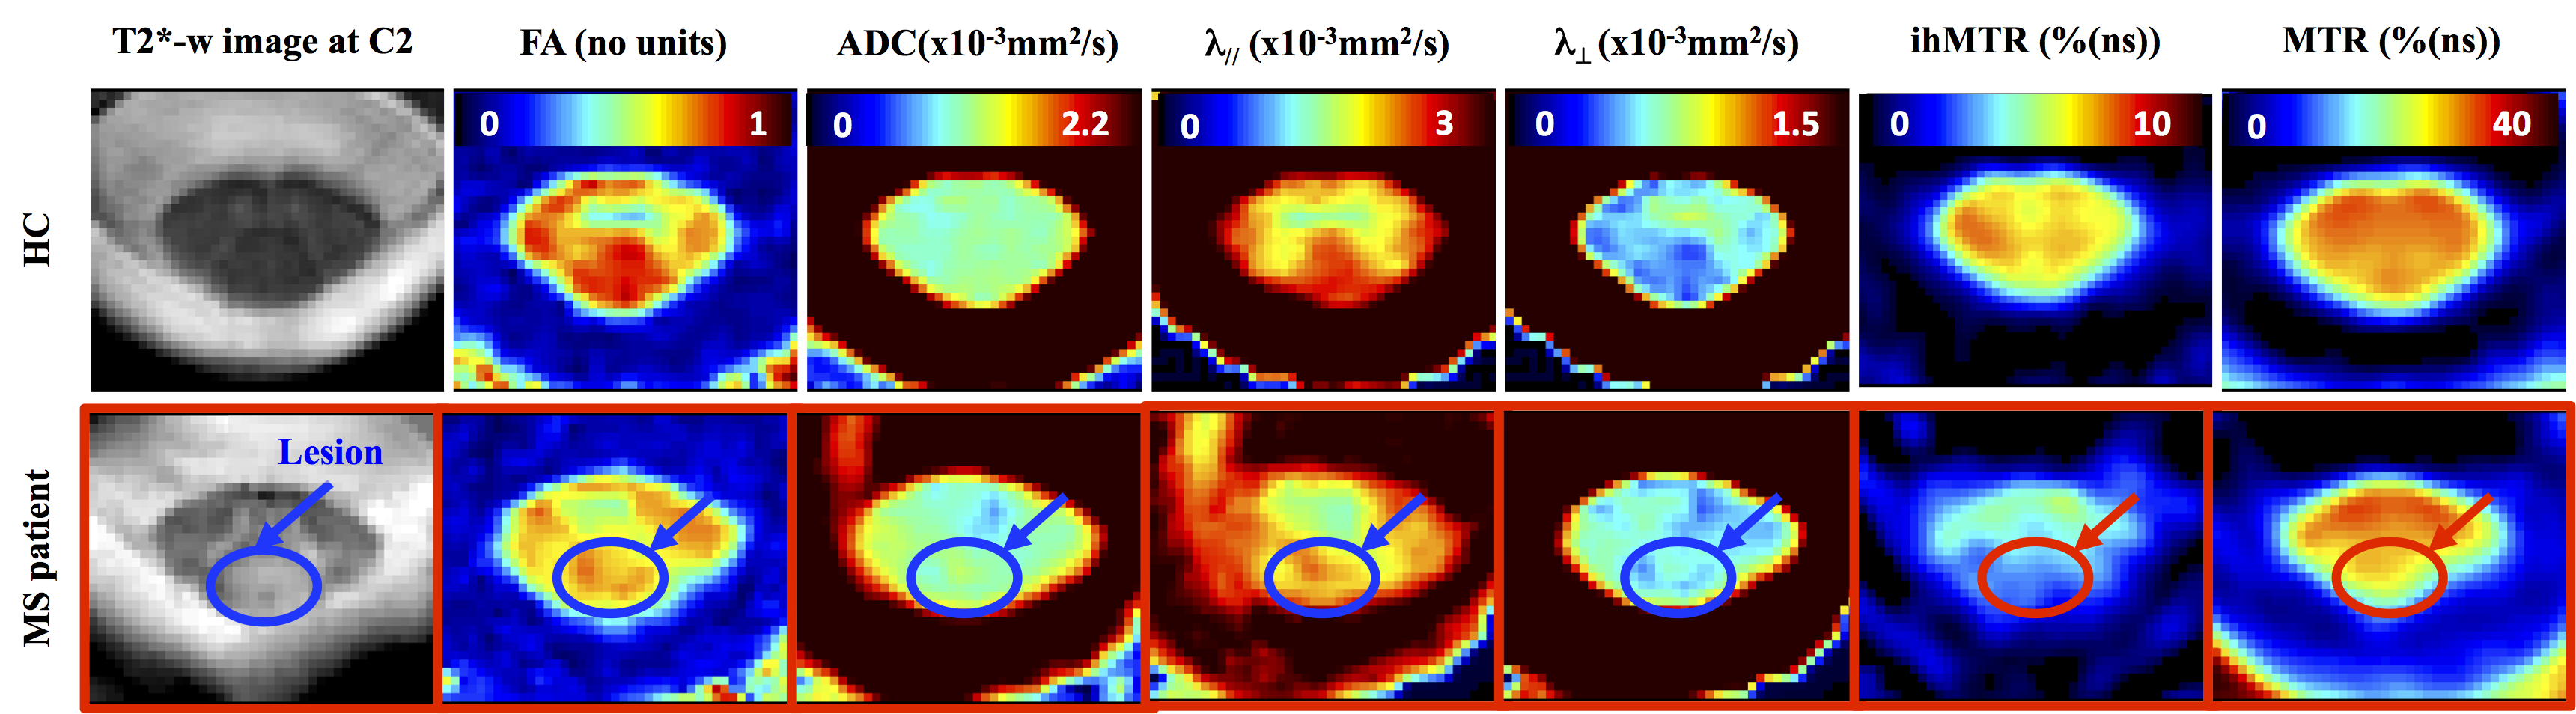
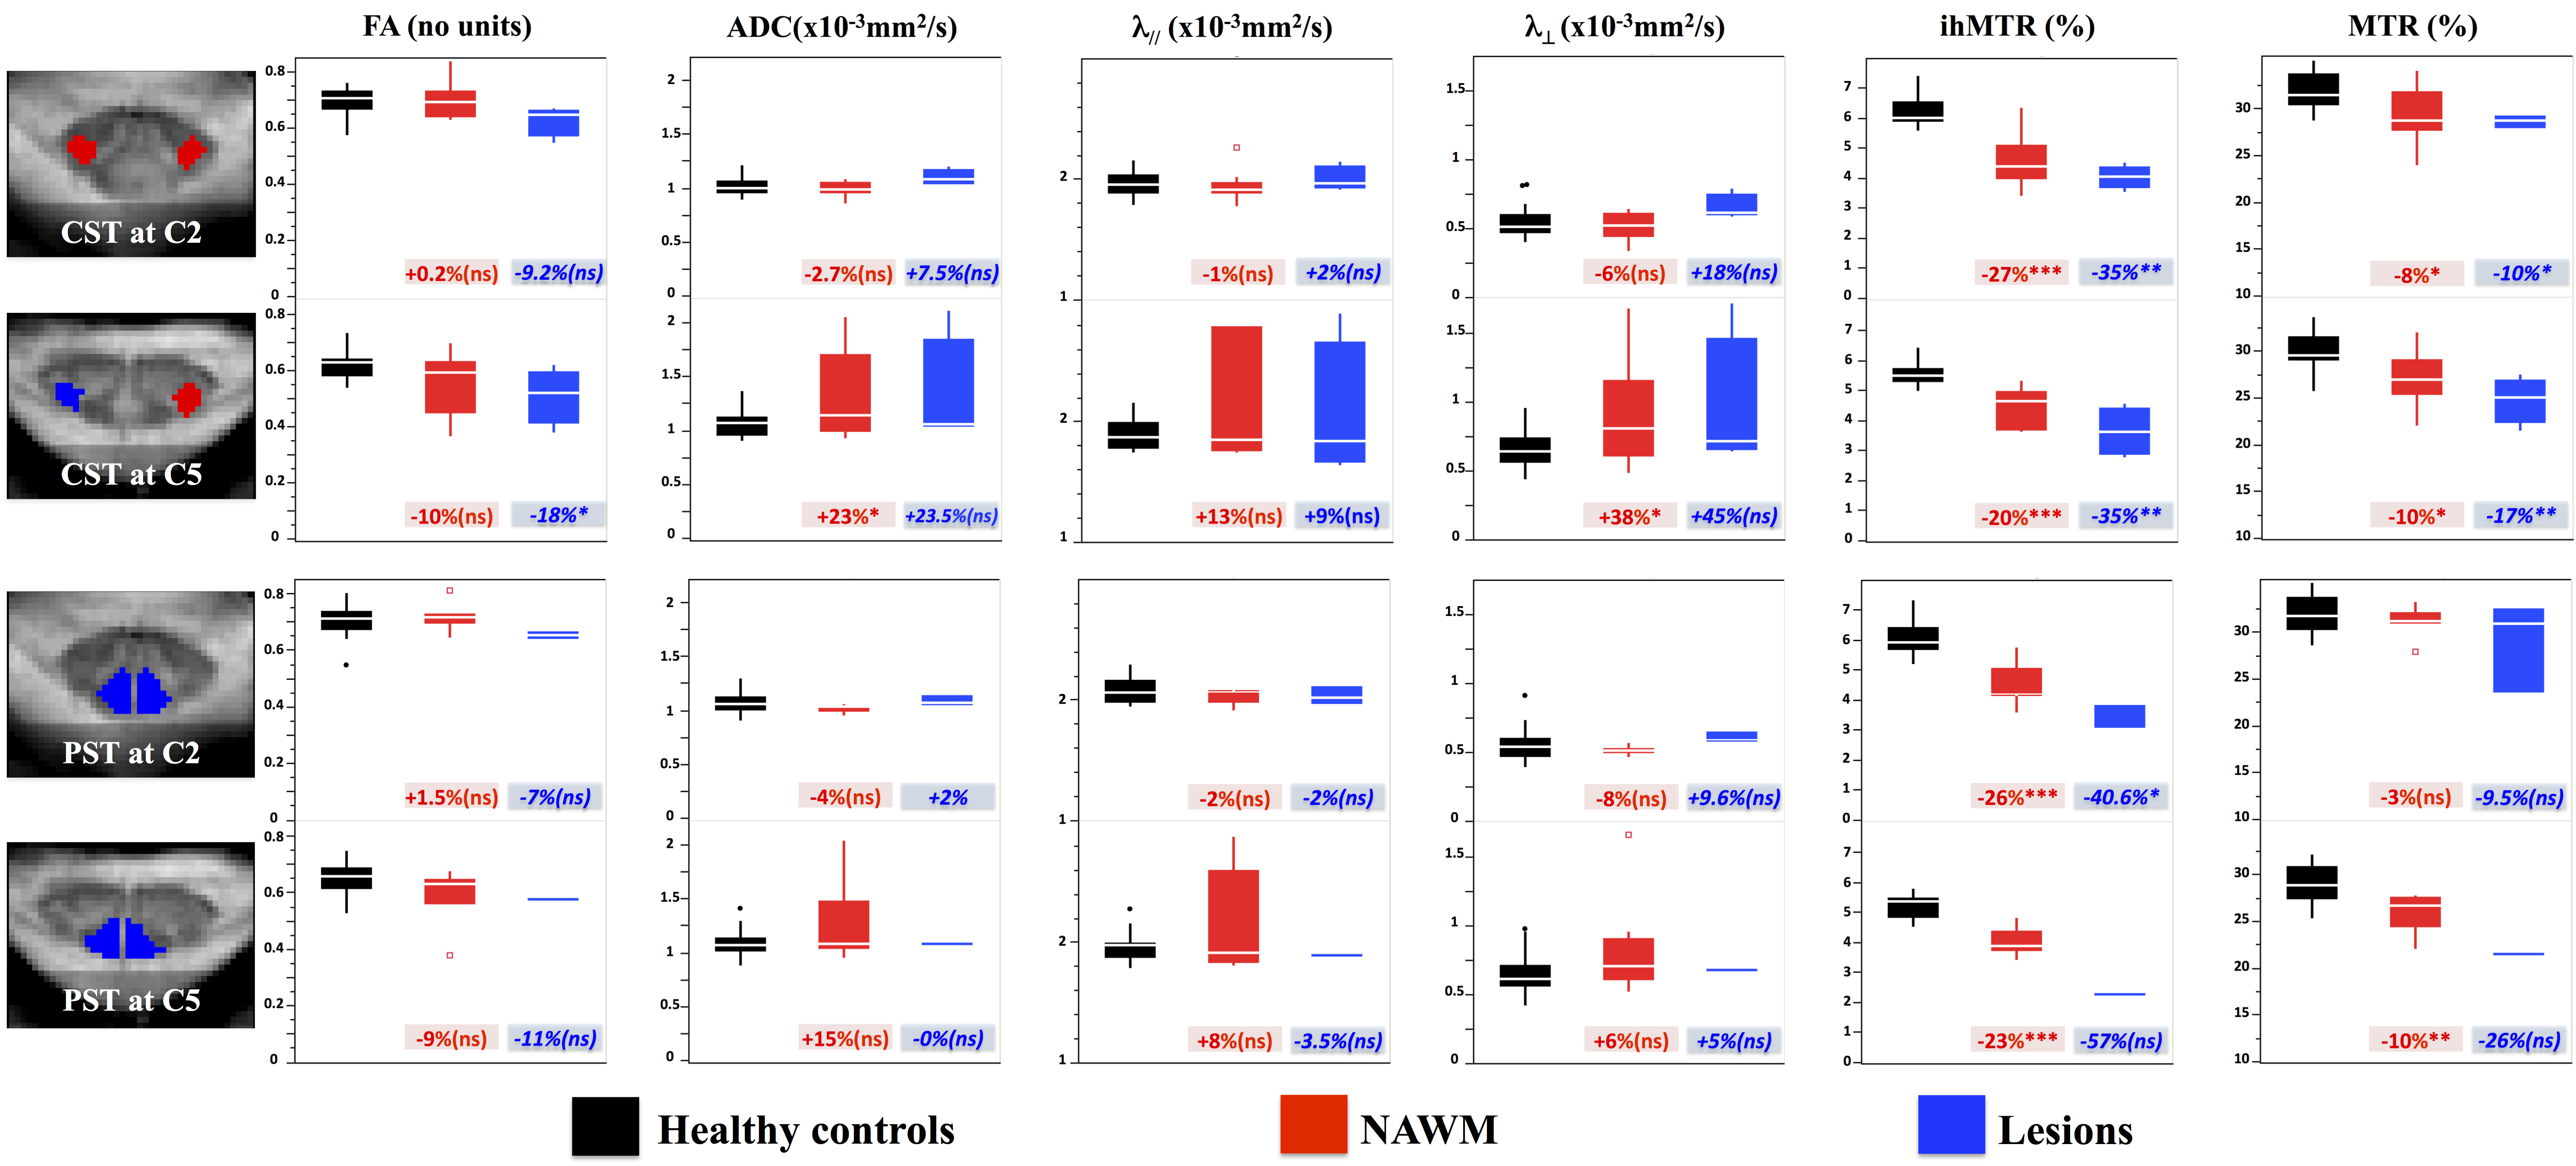
While WM CSA was significantly reduced in patients compared to healthy controls for each cervical level, GM CSA was significantly reduced mainly in the lower levels (Figure 2) suggesting different pathological mechanisms underlying GM and WM spinal cord atrophy in MS [16-19]. Characteristic mp-MRI maps collected in a MS patient and an age-matched HC subject is shown in Figure 3. Distribution for DTI and MT/ihMT metrics obtained from both groups in CST and PST NAWM and lesion ROIs are summarized in Figure 4. When comparing mp-MRI metrics extracted in NAWM of MS patients and in HC, radial diffusivity exhibited an increase at the C5 level, significant in CST only (p<0.05), MTR showed a moderate decrease (less than 10%), whereas ihMTR presented a significant high decrease (> 20% decrease rate) for both CST and PST ROIs at both cervical levels (p<0.005). These results argue for the existence of important demyelination occurring in the SC NAWM [20-22] and confirm the demyelinating aspect of MS lesions [23] (more than 35% decrease of ihMTR and 15% average decrease of MTR in lesions, as compared to controls). Preliminary evaluation of correlations between MRI metrics and clinical scores (data not presented here) on this small sample size showed tendency of positive correlations between radial diffusivity/EDSS and ihMTR/MRC scale suggesting a significant clinical impact of demyelination occurring in the NAWM.Conclusion
In this preliminary study, DTI and more importantly MT/ihMT metrics variation in spinal corticospinal and posterior sensory tracts collected in MS patients suggested important demyelination in normal appearing white matter, consistent with MS pathophysiology, and overall highlighted the sensitivity and specificity of ihMT technique toward myelin. This marker may therefore be of great interest to further objectively quantify the topography and progression of SC demyelination in MS. Further methodological developments directed toward investigation of whole cervical SC and longitudinal follow-ups on a larger cohort of patients are under consideration and are expected to allow a better characterization of MS spatial and temporal pattern in the SC.Acknowledgements
No acknowledgement found.References
1. Zackowski, K.M., et al., Sensorimotor dysfunction in multiple sclerosis and column-specific magnetization transfer-imaging abnormalities in the spinal cord. Brain : a journal of neurology, 2009. 132(Pt 5): p. 1200-9.
2. Smith, A.K., et al., Rapid, high-resolution quantitative magnetization transfer MRI of the human spinal cord. Neuroimage, 2014. 95: p. 106-16.
3. Kearney, H., et al., Improved MRI quantification of spinal cord atrophy in multiple sclerosis. Journal of magnetic resonance imaging : JMRI, 2014. 39(3): p. 617-23.
4. Kearney, H., et al., Spinal cord grey matter abnormalities are associated with secondary progression and physical disability in multiple sclerosis. Journal of neurology, neurosurgery, and psychiatry, 2015. 86(6): p. 608-14.
5. Schlaeger, R., et al., Association Between Thoracic Spinal Cord Gray Matter Atrophy and Disability in Multiple Sclerosis. JAMA neurology, 2015. 72(8): p. 897-904.
6. Cohen, Y., D. Anaby, and D. Morozov, Diffusion MRI of the spinal cord: from structural studies to pathology. NMR Biomed, 2016.
7. Stroman, P.W., et al., The current state-of-the-art of spinal cord imaging: methods. Neuroimage, 2014. 84: p. 1070-81.
8. Alsop, D.C., et al. Inhomogeneous Magnetization Transfer Imaging: A Potentially Specific Marker for Myelin. in Proceedings of the 13th annual meeting of ISMRM. 2005. Miami, USA.
9. Varma, G., et al., Magnetization transfer from inhomogeneously broadened lines: A potential marker for myelin. Magn Reson Med, 2015. 73(2): p. 614-22.
10. Girard, O.M., et al., Magnetization transfer from inhomogeneously broadened lines (ihMT): Improved imaging strategy for spinal cord applications. Magn Reson Med, 2016.
11. Taso, M., et al., Tract-specific and age-related variations of the spinal cord microstructure: a multi-parametric MRI study using diffusion tensor imaging (DTI) and inhomogeneous magnetization transfer (ihMT). NMR Biomed, 2016. 29(6): p. 817-32.
12. De Leener, B., et al., SCT: Spinal Cord Toolbox, an open-source software for processing spinal cord MRI data. Neuroimage, 2016.
13. Fonov, V.S., et al., Framework for integrated MRI average template of the spinal cord white and gray matter: the MNI-Poly-AMU template. Neuroimage, 2014. 102P2: p. 817-827.
14. Taso, M., et al., A reliable spatially normalized template of the human spinal cord - Applications to automated white matter/gray matter segmentation and tensor-based morphometry (TBM) mapping of gray matter alterations occurring with age. Neuroimage, 2015. 117: p. 20-28.
15. Levy, S., et al., White matter atlas of the human spinal cord with estimation of partial volume effect. Neuroimage, 2015. 119(0): p. 262-271.
16. Calabrese, M., et al., Exploring the origins of grey matter damage in multiple sclerosis. Nat Rev Neurosci, 2015. 16(3): p. 147-158.
17. Gilmore, C.P., et al., Spinal cord gray matter demyelination in multiple sclerosis-a novel pattern of residual plaque morphology. Brain Pathol, 2006. 16(3): p. 202-8.
18. Gilmore, C.P., et al., Spinal cord atrophy in multiple sclerosis caused by white matter volume loss. Arch Neurol, 2005. 62(12): p. 1859-62.
19. Vercellino, M., et al., Demyelination, inflammation, and neurodegeneration in multiple sclerosis deep gray matter. J Neuropathol Exp Neurol, 2009. 68(5): p. 489-502.
20. Agosta, F., et al., In vivo assessment of cervical cord damage in MS patients: a longitudinal diffusion tensor MRI study. Brain, 2007. 130(Pt 8): p. 2211-9.
21. Benedetti, B., et al., A diffusion tensor MRI study of cervical cord damage in benign and secondary progressive multiple sclerosis patients. J Neurol Neurosurg Psychiatry, 2010. 81(1): p. 26-30.
22. Kearney, H., et al., Investigation of magnetization transfer ratio-derived pial and subpial abnormalities in the multiple sclerosis spinal cord. Brain, 2014. 137(Pt 9): p. 2456-68.
23. Hagiwara, A., et al., Utility of a Multiparametric Quantitative MRI Model That Assesses Myelin and Edema for Evaluating Plaques, Periplaque White Matter, and Normal-Appearing White Matter in Patients with Multiple Sclerosis: A Feasibility Study. AJNR Am J Neuroradiol, 2016.
Figures