0417
On the Relationship between Tissue Damage in Cervical Spinal Cord and Brain in Multiple Sclerosis.1Department of Chemistry, Washington University in St. Louis, Saint Louis, MO, United States, 2Department of Radiology, Washington University in St. Louis, St. Louis, MO, United States, 3Department of Neurology, Washington University in St. Louis, St. Louis, MO, United States
Synopsis
We examined quantitative relationships between tissue damage in the cervical spinal cord (characterized by cross-sectional area (CSA)) and cortical gray matter (GM) (characterized by thickness and tissue specific R2* values) in multiple sclerosis (MS) patients, and determined relative contributions of these to neurologic disability. We found correlations between CSA and GM R2* values and thickness of several cortical regions. Compared with cortical R2* and thickness, cervical spinal cord CSA correlated better with neurological impairment status. CSA, thickness and age-corrected R2* values all differentiated MS subjects from healthy Controls. CSA and GM thickness could further distinguish MS clinical subtypes.
Purpose
Spinal cord damage, along with brain tissue damage, plays an important role in the development of physical disability in patients with multiple sclerosis (MS)1. The goal of this study was to provide new quantitative information on the inter-relationships between MS tissue damage in the upper spinal cord (characterized by the cervical cross-sectional area (CSA)) and cortical gray matter (GM) (characterized by thickness and tissue specific R2* values2-5), and to determine relative contributions of these measures to disability.Method
Forty-four MS patients with relapsing remitting (RRMS, n=15), secondary progressive (SPMS, n=16) and primary progressive (PPMS, n=13) clinical courses were recruited. The healthy control volunteers (n=19, 5 males, 14 females) ranged in age from 23 to 76 years. Studies were approved by the Washington University IRB. All subjects provided informed consent. MRI scans were collected using a 3.0T Trio MRI scanner (Siemens, Erlangen, Germany) equipped with a 32-channel phased-array head coil. High resolution GEPCI datasets2, 4, 6 with a voxel size of 1×1×2 mm3 were acquired using a 3D multi-gradient-echo sequence with a flip angle of 30, TR=50 ms and total acquisition time of 11 min 30 s. For each acquisition, 11 echoes were collected with first echo time TE1=4 ms and echo spacing ΔTE=4 ms. The multi-echoes datasets were used to calculate R2* values corrected for background gradients7 and physiological fluctuations8. MPRAGE9 images with high resolution (voxel size: 1×1×1 mm3) were collected for segmentation and measuring CSA of the spinal cord. Brain segmentation was based on FreeSurfer software (Martinos Center for Biomedical Imaging, MGH/HST, US). Spinal cord segmentation was based on PropSeg (Spinal Cord Toolbox version 2.0).Results and Discussion
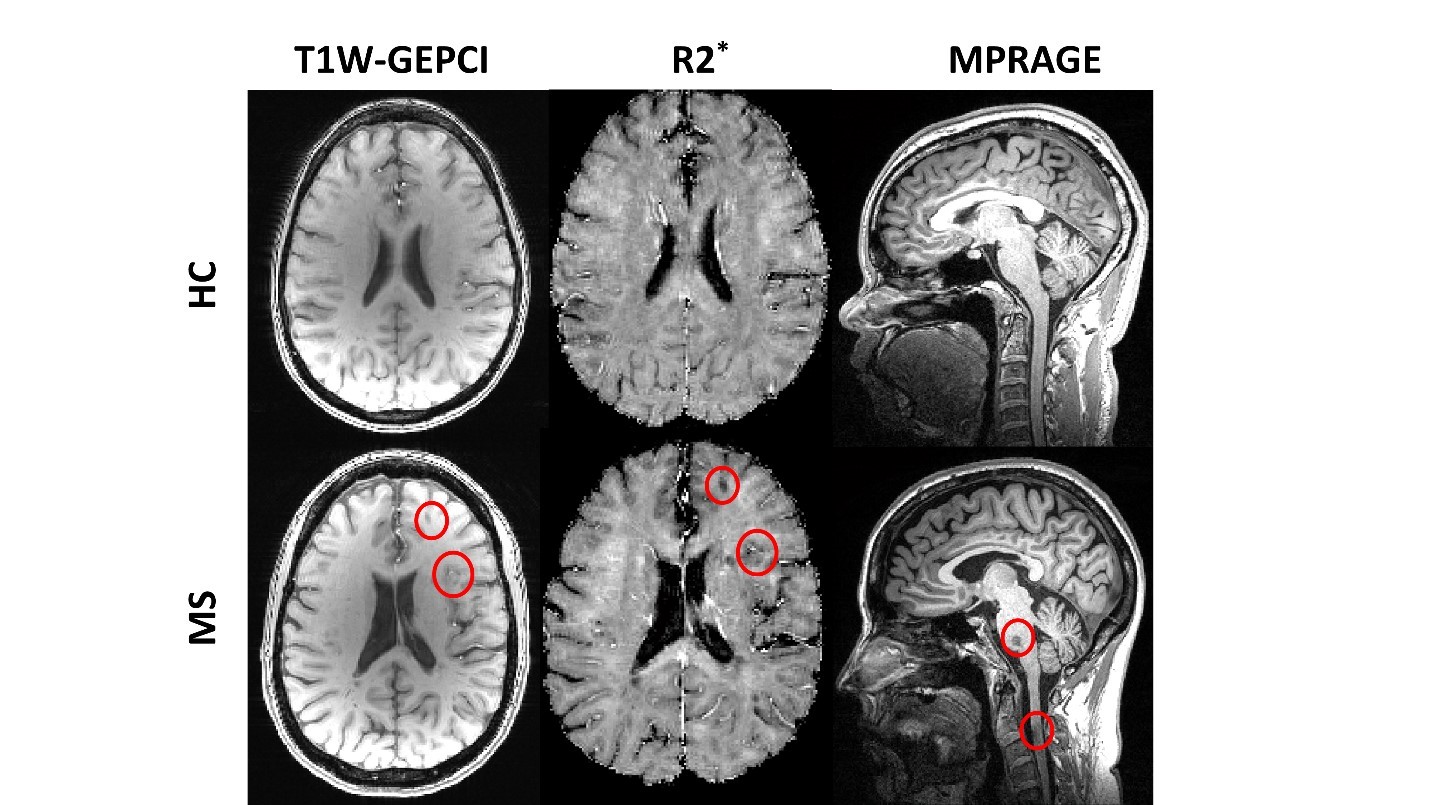
Examples of GEPCI T1W images and R2* maps, and MPRAGE images of one healthy control and one MS patient are shown in Fig.1. In all images, several lesions could be identified in MS patient as hypointense signal on T1W GEPCI.
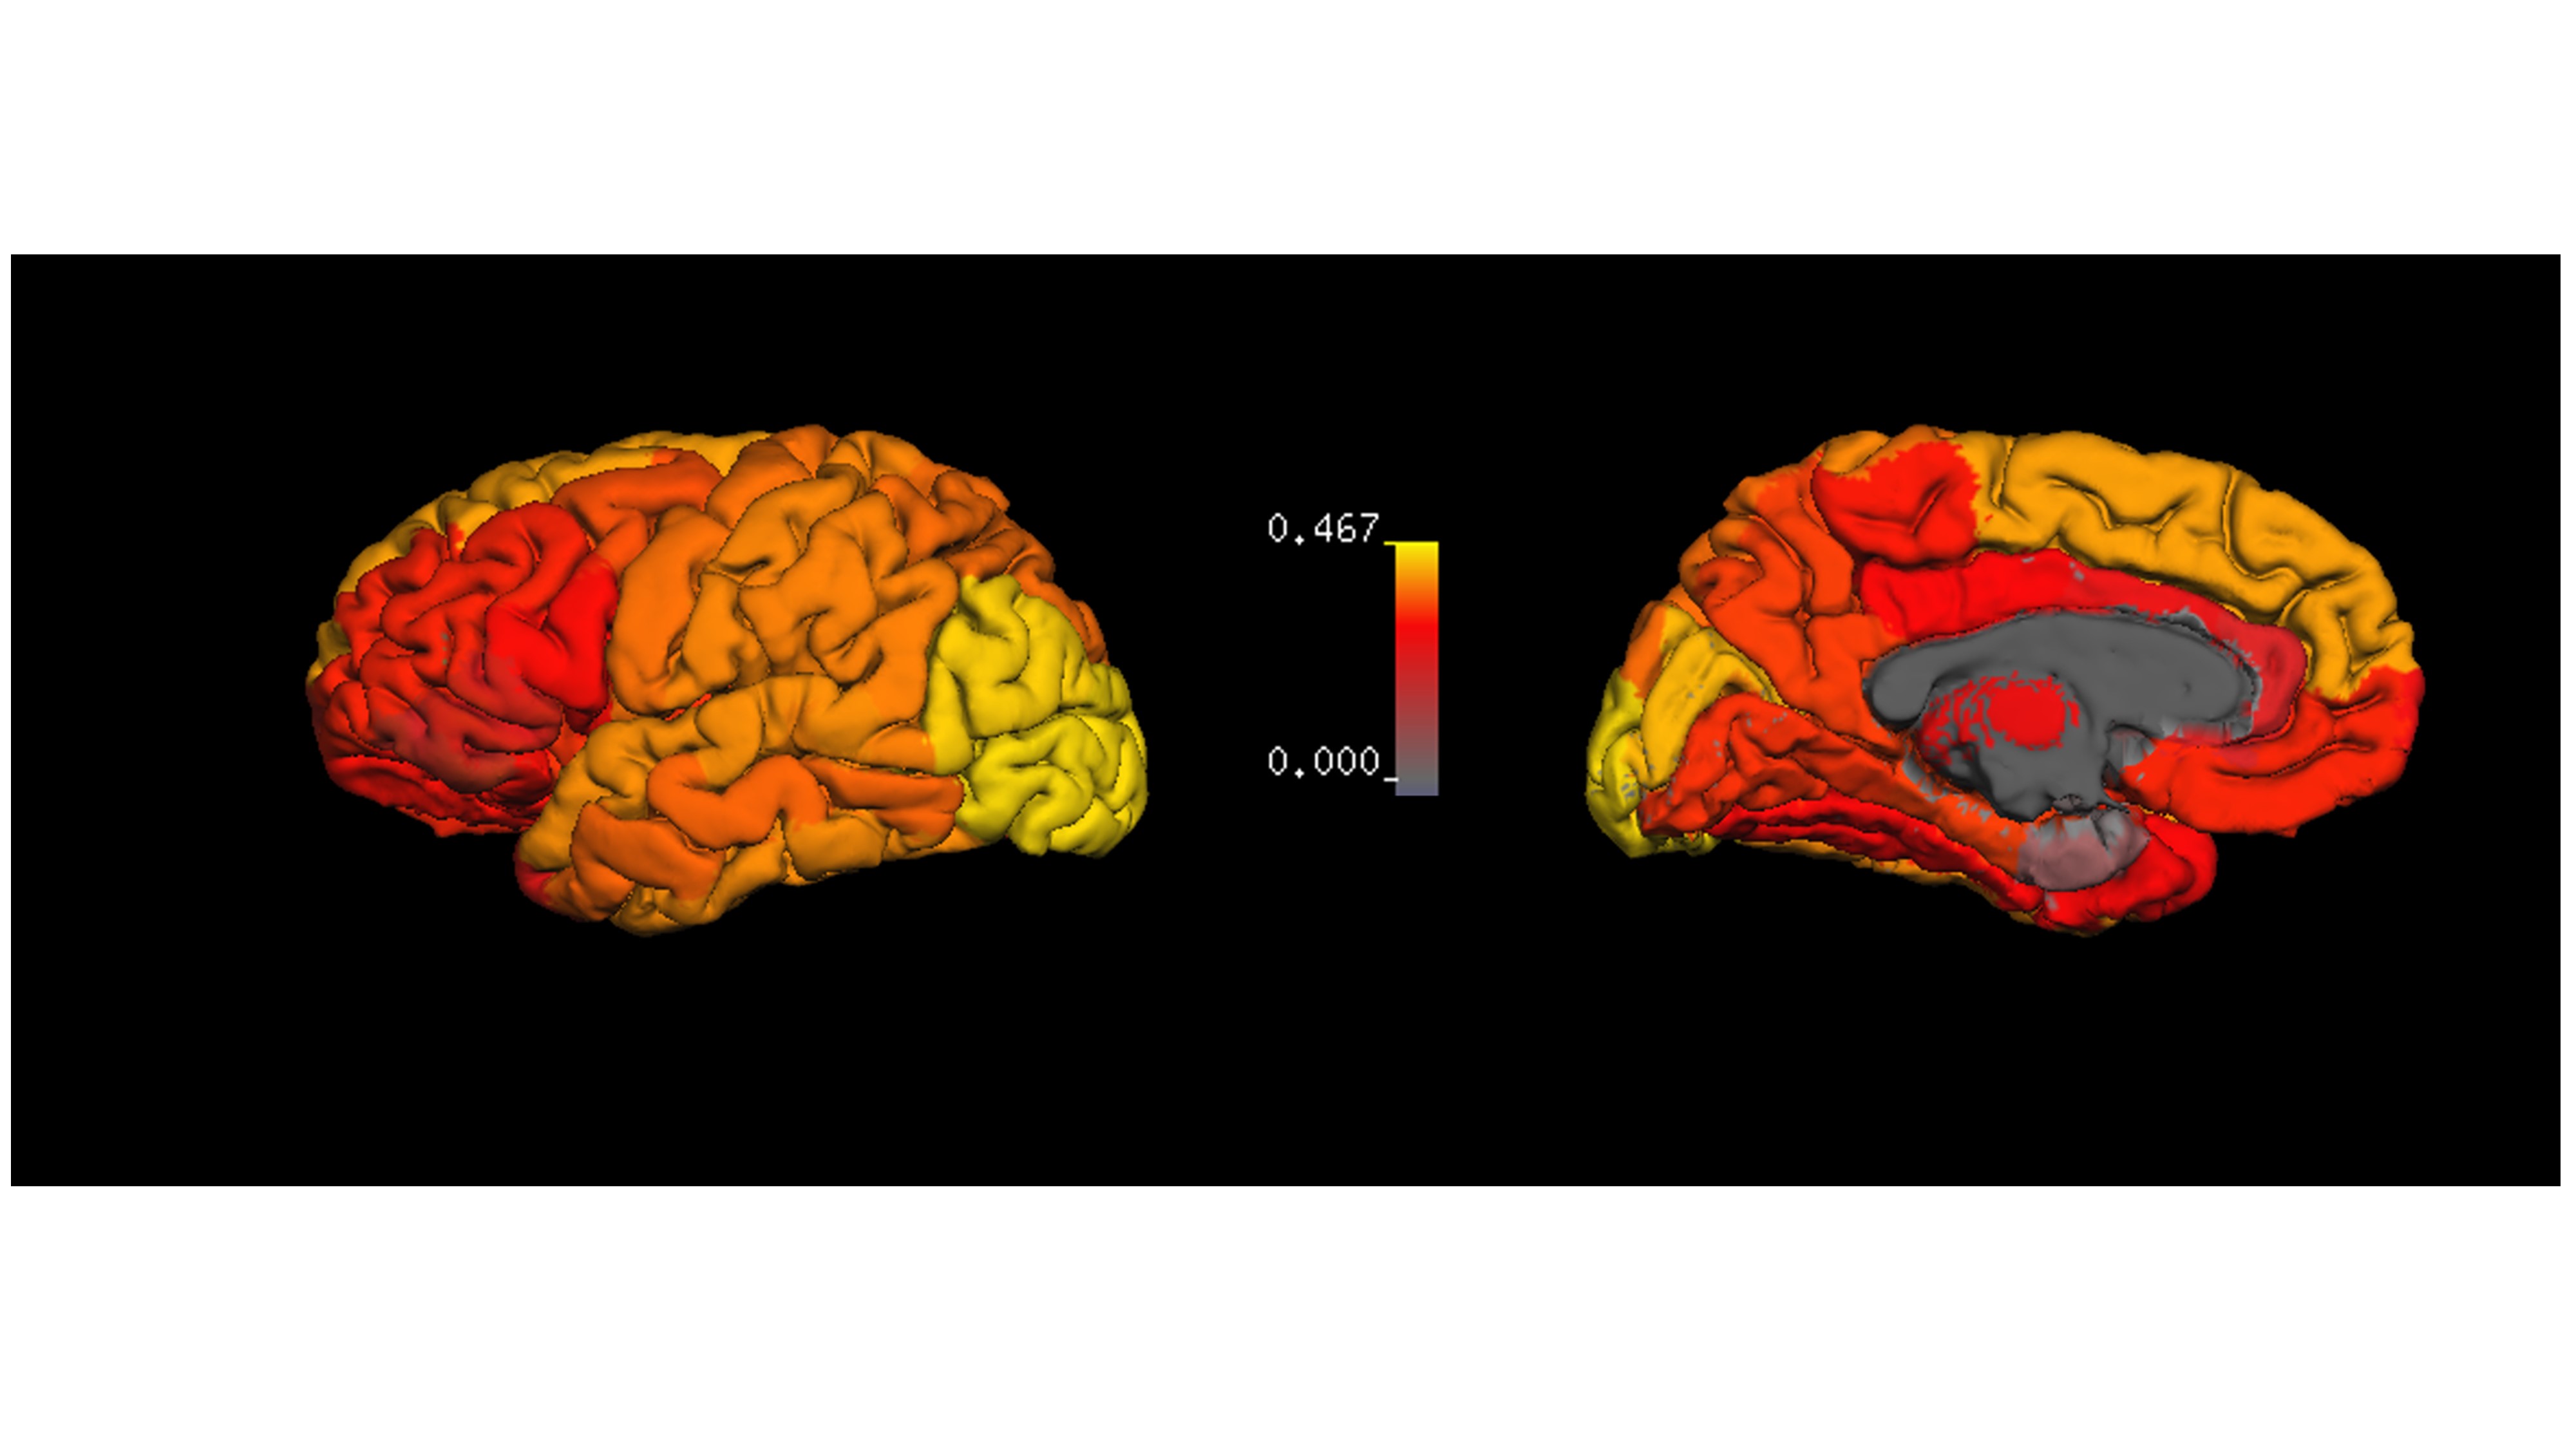
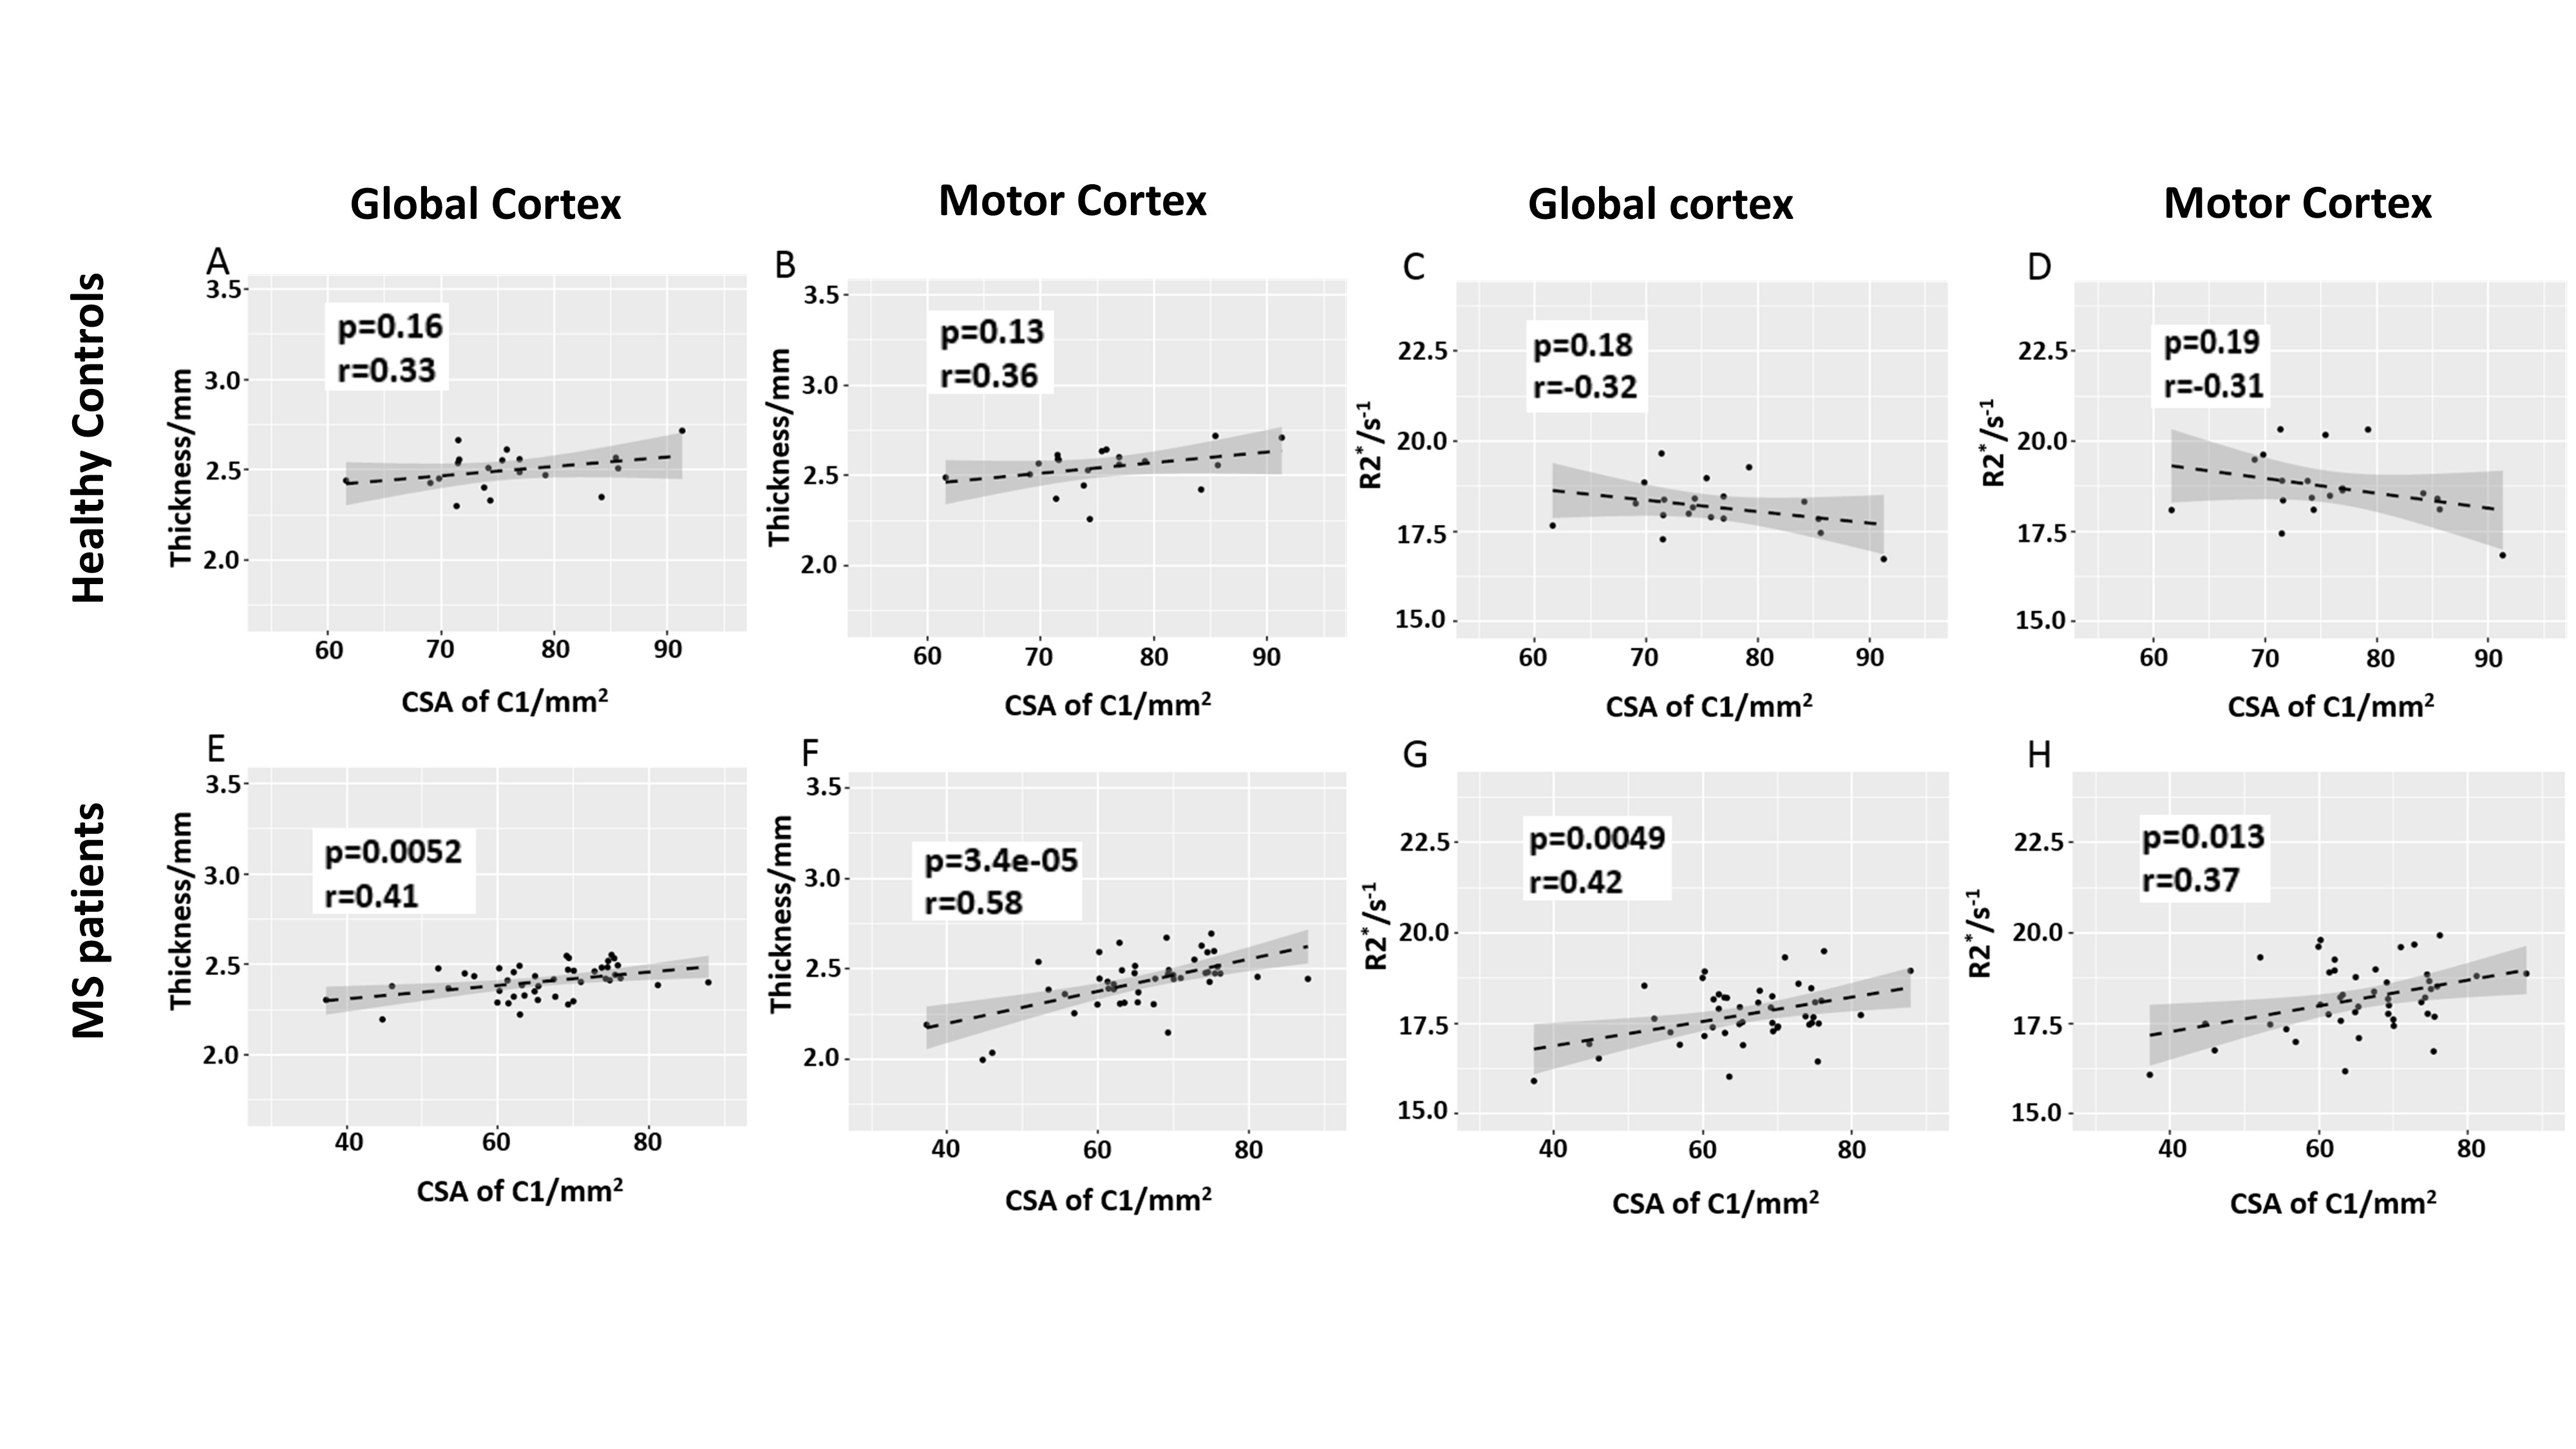
Since MS is considered to be a disease affecting the entire CNS, we examined the correlation between the spinal cord CSA and brain tissue damage. The r values for correlations between CSA of C1 and R2* in all cortical and deep gray matter regions are shown in Fig.2. The surface map shows that the R2* values in motor cortex, somatosensory cortex and occipital regions have strong correlations with the cross-sectional size of the spinal cord. Motor and global cerebral cortex were studied in detail because cortical MS lesions and motor dysfunction are common in MS patients. Moderate to strong linear correlations were found between CSA of C1 and GM thickness and R2* in MS patients, but not in healthy controls (Fig. 3). Our data also show that MS subjects with smaller CSA of spinal cord are more likely to have thinner cerebral cortex.
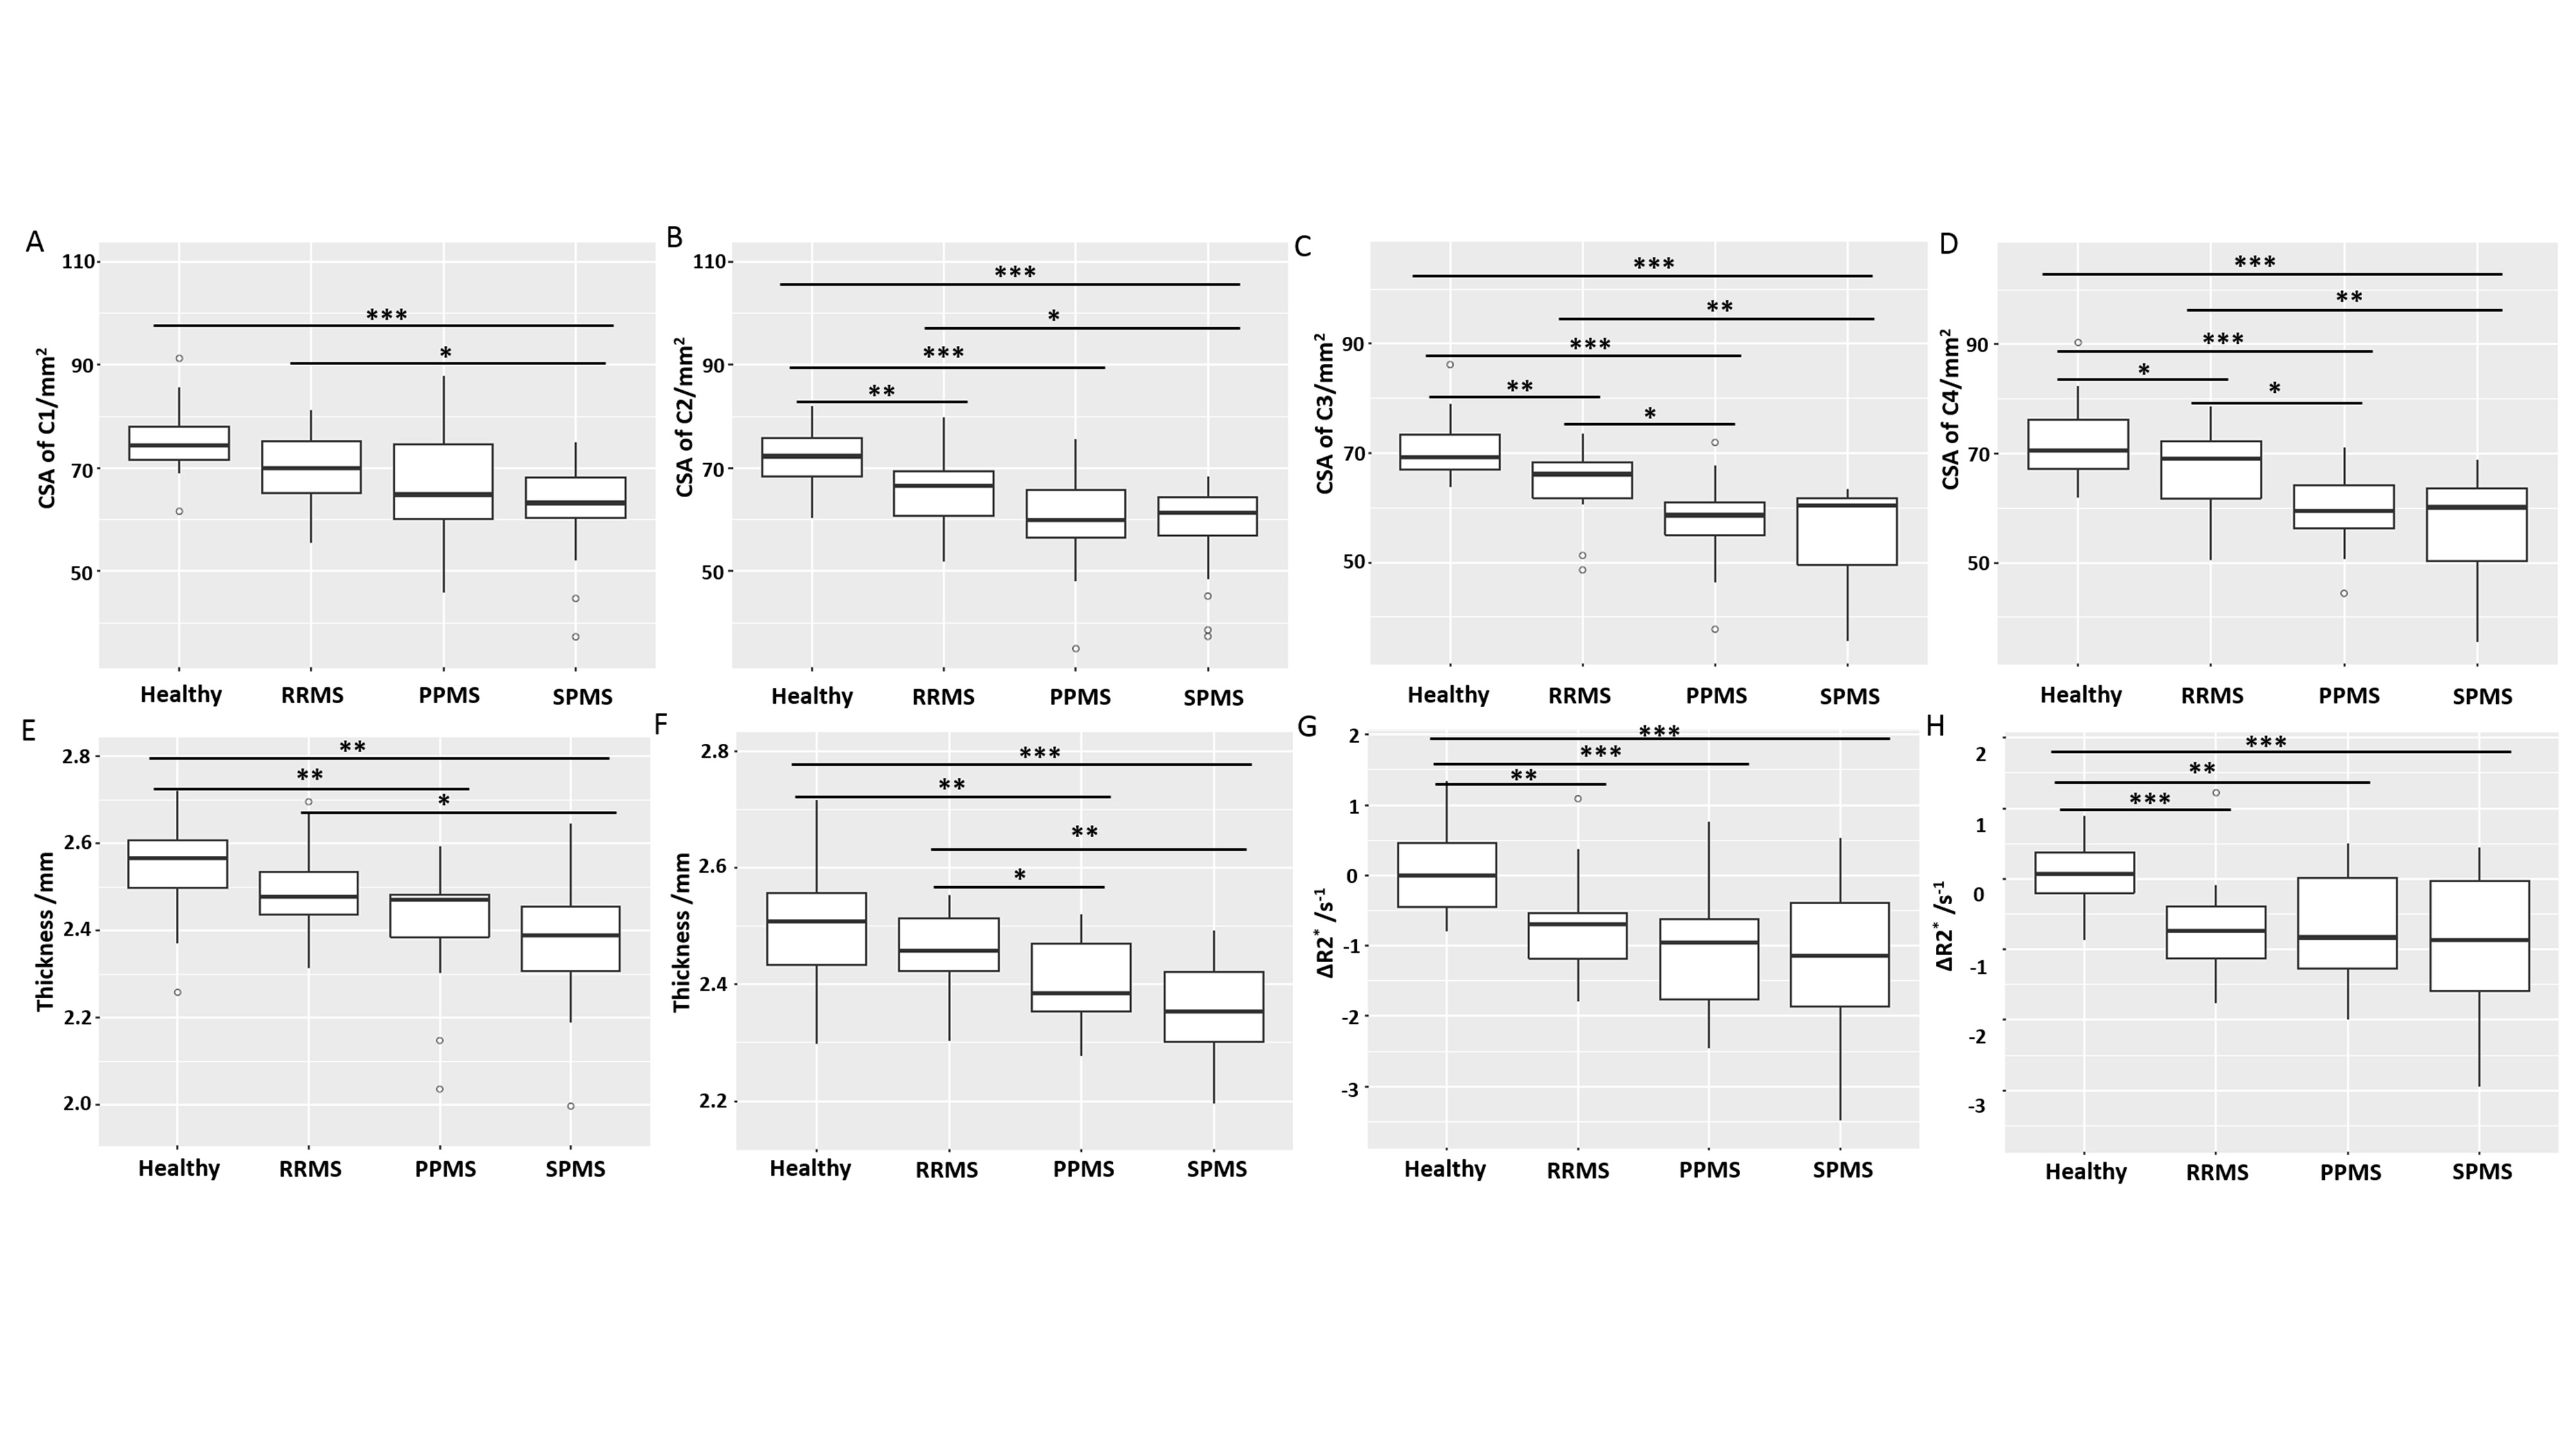
In terms of group difference, CSA of the spinal cord, thickness and ΔR2* (age corrected R2*) of cortex all distinguished healthy controls from MS patients, although there was some individual patient overlap between groups (Fig.4). In general, MS patients had smaller CSA and thinner cortex than healthy controls. MS patients also had negative ΔR2* which means that they had lower R2* than the age-matched healthy controls. Within different MS subtypes, the SPMS and PPMS patients had significantly smaller CSA and thinner cortex than the RRMS patients, probably due to the more advanced disease stages. Statistically, cord CSA and cortical thickness can better distinguish the MS subtypes in most cases than ΔR2*. This finding suggests that R2* measures tissue characteristics that might be distinct from tissue damage causing cortical atrophy.
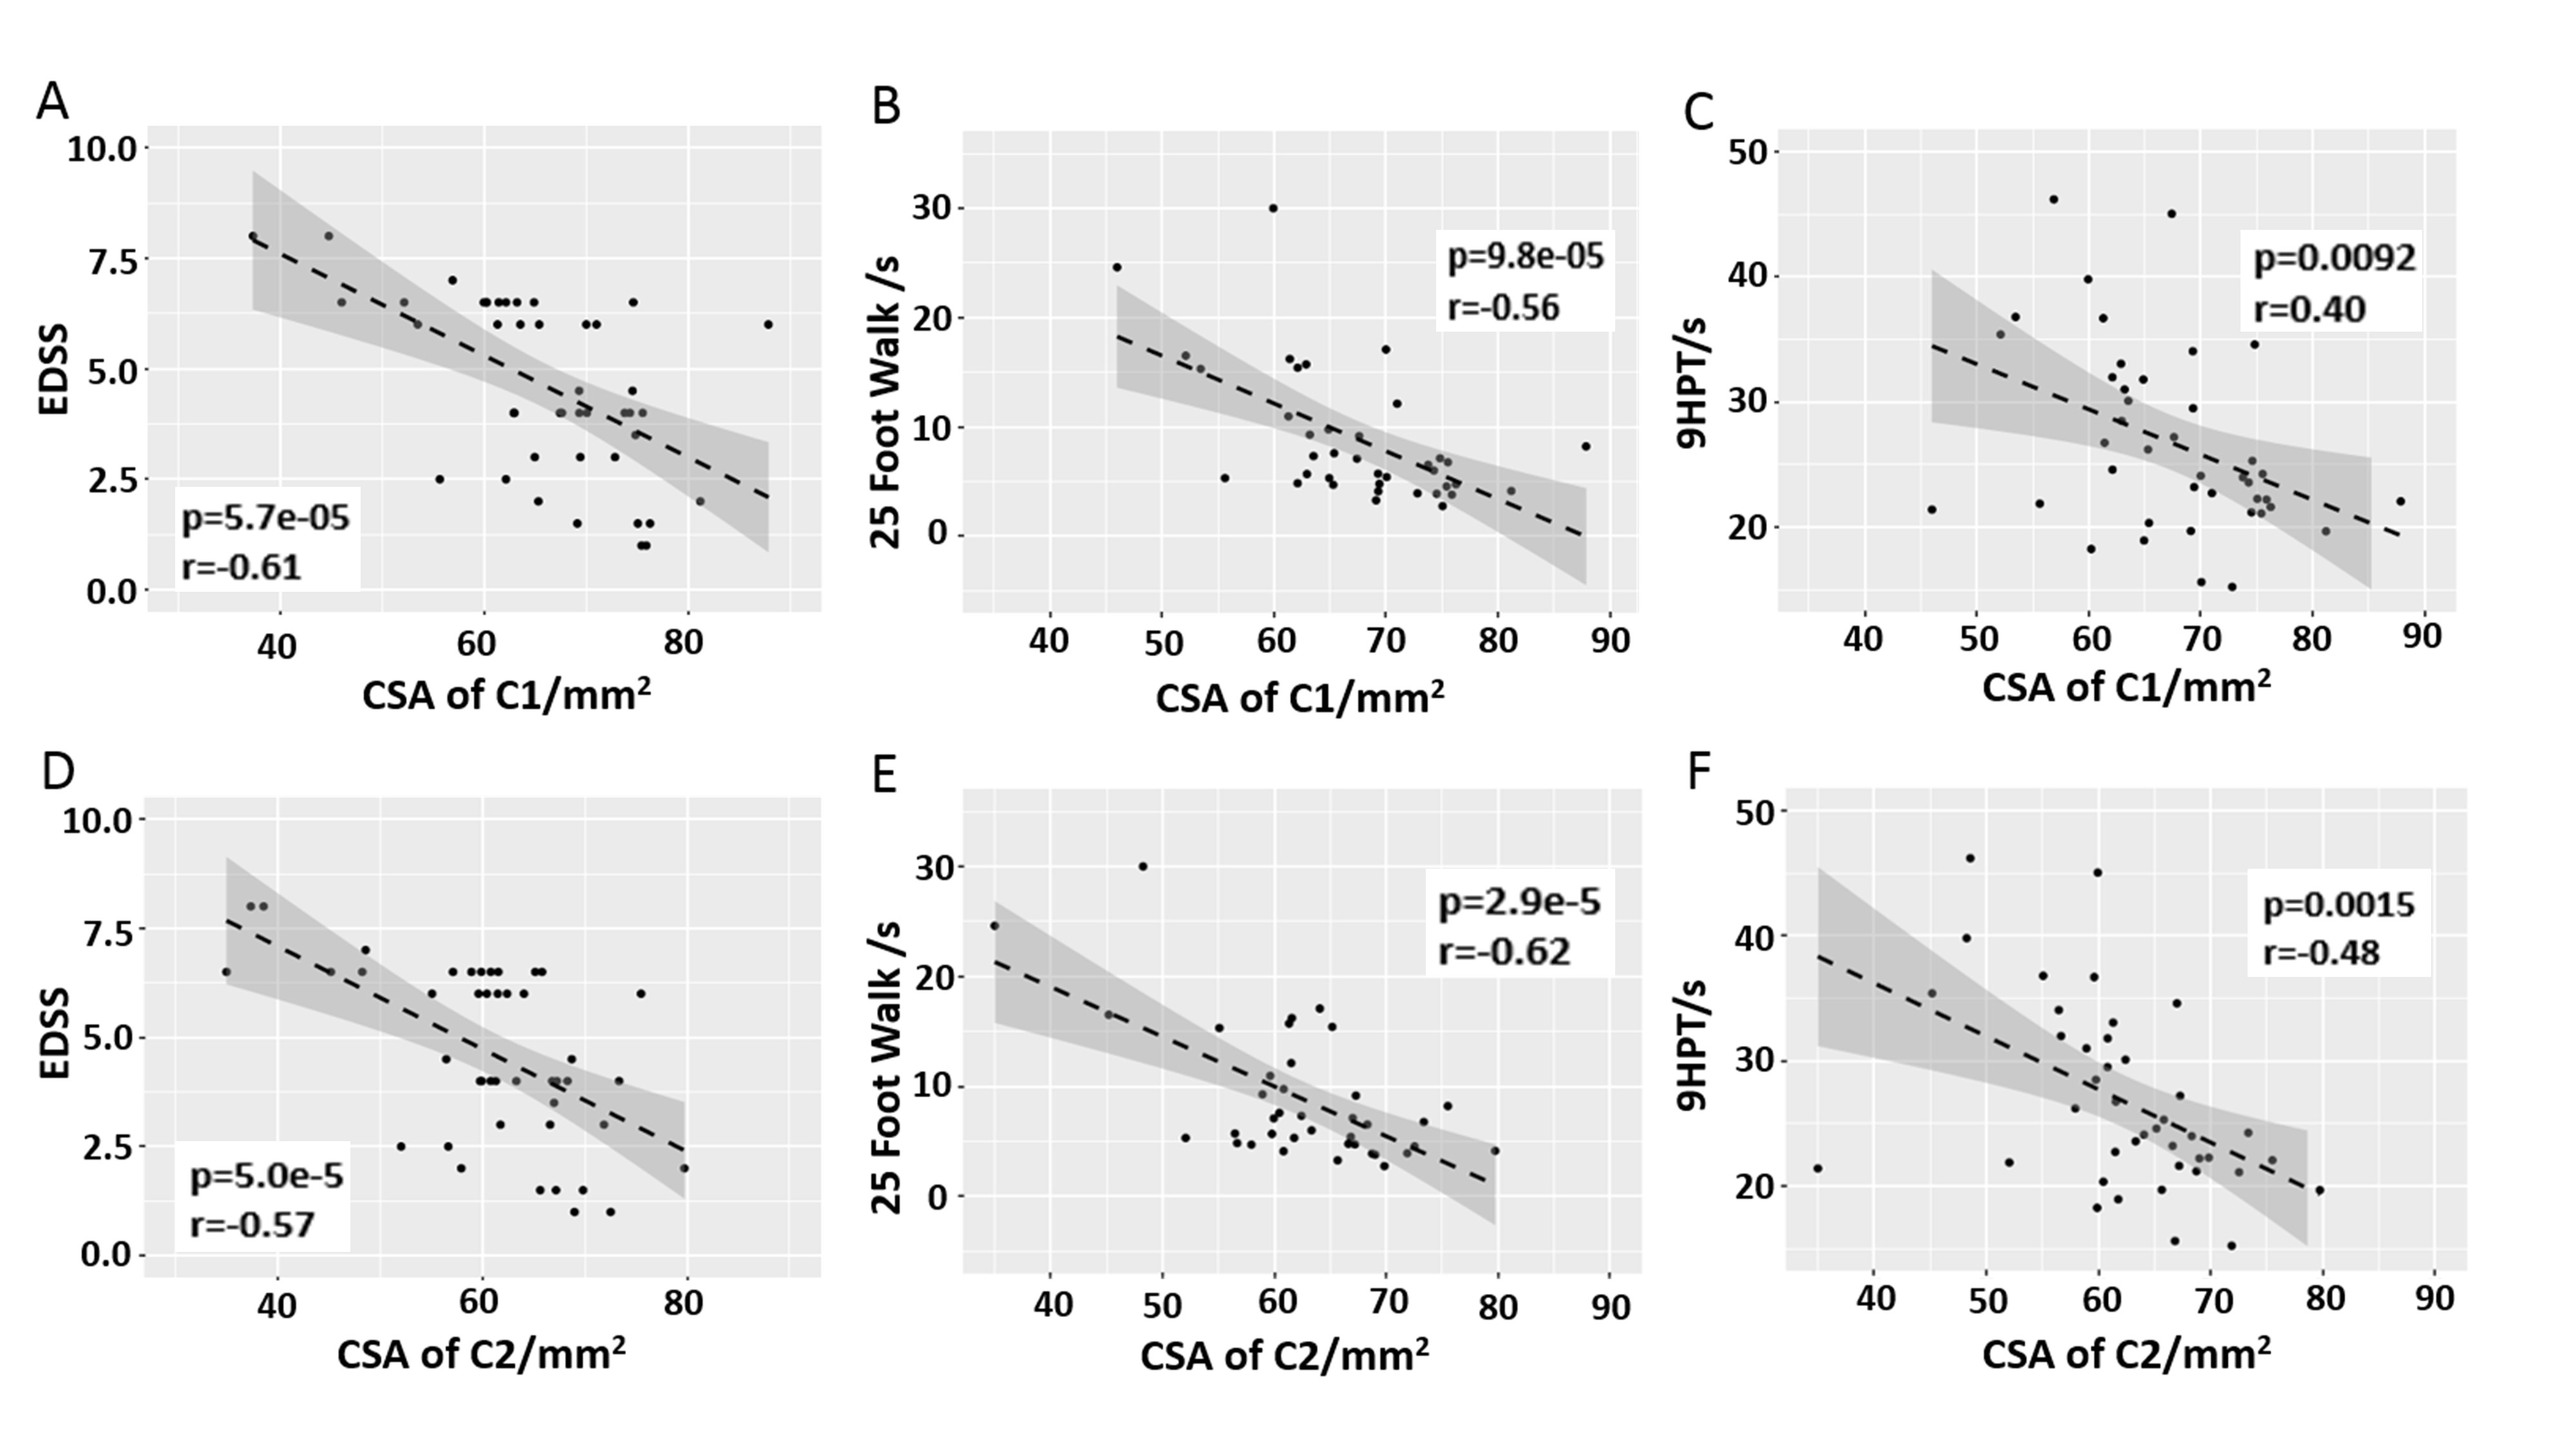
Our data also showed the correlation between tissue damage in the brain and spinal cord with clinical tests. We found that CSA of the spinal cord correlated better with physical impairment status, compared with R2* and thickness of the cortex (Fig. 5). This was not unexpected, given the crucial importance of signals traversing the upper spinal cord for physical performance using arms and legs.
Conclusion
Our results show moderate to strong correlations between cervical spinal cord CSA and GM R2* values and thickness of several brain cortical regions. This finding supports the well-known idea that MS is a global CNS disease, affecting both spinal cord and brain. Cervical cord CSA correlated better with physical impairment status, compared with R2* and thickness of brain cortex. CSA of the spinal cord, thickness and ΔR2* values of the cortex all differentiated MS patients from healthy controls. Additionally, upper cervical cord CSA and GM thickness demonstrated significant differences between MS clinical subtypes.Acknowledgements
The studies were funded by grants from
the University of Missouri Columbia (SCIR 14-01), Conrad N. Hilton
Foundation (20140257) and National MS Society USA (NMSS RG 4463A182). Jie Wen is a Fellow of the National MS Society USA. Anne H.
Cross was funded in part by the Manny and Rosalyn Rosenthal-Dr. John L. Trotter
MS Center Chair of Barnes-Jewish Hospital Foundation.
References
1. Bot JC, Barkhof F, Polman CH, et al. Spinal cord abnormalities in recently diagnosed MS patients: added value of spinal MRI examination. Neurology 2004;62:226-233.
2. Luo J, Jagadeesan BD, Cross AH, Yablonskiy DA. Gradient echo plural contrast imaging--signal model and derived contrasts: T2*, T1, phase, SWI, T1f, FST2*and T2*-SWI. NeuroImage 2012;60:1073-1082.
3. Luo J, Yablonskiy DA, Hildebolt CF, Lancia S, Cross AH. Gradient echo magnetic resonance imaging correlates with clinical measures and allows visualization of veins within multiple sclerosis lesions. Mult Scler 2014;20:349-355.
4. Sati P, Cross AH, Luo J, Hildebolt CF, Yablonskiy DA. In vivo quantitative evaluation of brain tissue damage in multiple sclerosis using gradient echo plural contrast imaging technique. NeuroImage 2010;51:1089-1097.
5. Wen J, Yablonskiy DA, Luo J, Lancia S, Hildebolt C, Cross AH. Detection and quantification of regional cortical gray matter damage in multiple sclerosis utilizing gradient echo MRI. NeuroImage Clinical 2015;9:164-175.
6. Yablonskiy DA. Gradient echo plural contrast imaging (GEPCI) - New fast magnetic resonance imaging technique for simultaneous acquisition of T2, T1 (or spin density) and T2*-weighted images. Radiology 2000;217:204-204.
7. Yablonskiy DA, Sukstanskii AL, Luo J, Wang X. Voxel spread function method for correction of magnetic field inhomogeneity effects in quantitative gradient-echo-based MRI. Magnetic resonance in medicine : official journal of the Society of Magnetic Resonance in Medicine / Society of Magnetic Resonance in Medicine 2013;70:1283-1292.
8. Wen J, Cross AH, Yablonskiy DA. On the role of physiological fluctuations in quantitative gradient echo MRI: implications for GEPCI, QSM, and SWI. Magnetic resonance in medicine : official journal of the Society of Magnetic Resonance in Medicine / Society of Magnetic Resonance in Medicine 2015;73:195-203.
9. Mugler JP, 3rd,
Brookeman JR. Three-dimensional magnetization-prepared rapid gradient-echo
imaging (3D MP RAGE). Magnetic resonance
in medicine : official journal of the Society of Magnetic Resonance in Medicine
/ Society of Magnetic Resonance in Medicine 1990;15:152-157.
Figures