0416
Outer spinal cord rim visualization using magnetization-prepared 3D T1w TFE at 3T: Application to multiple sclerosis.1UCL Institute of Neurology, Queen Square MS Centre, University College London, London, United Kingdom, 2Philips Healthcare, Guildford, United Kingdom, 3Medical Physics and Biomedical Engineering, University College London, London, United Kingdom, 4Translational Imaging Group, CMIC, Dep. of Medical Physics and Biomedical Engineering, University College London, London, United Kingdom, 5UCL-UCLH NIHR Biomedical Research Centre, London, United Kingdom, 6Department of Brain and Behavioural Sciences, University of Pavia, Pavia, Italy, 7Brain MRI 3T Mondino Research Center, C. Mondino National Neurological Institute, Pavia, Italy
Synopsis
Neuropathological studies in multiple sclerosis (MS) have suggested that meningeal inflammation in the brain and spinal cord (SC) may be associated with disease progression. However, the use of structural imaging protocols to depict meningeal tissues has not been reported. Herein, we investigate the feasibility of obtaining sufficiently high image contrast to resolve the SC rim that we speculate corresponds to the SC pia mater (SCPM) using the magnetization-prepared 3D T1w TFE sequence. Preliminary results show that it is possible to resolve SCPM, and that significant differences in signal intensity values within SCPM exist between healthy controls and people with MS.
INTRODUCTION
Neuropathological studies in multiple sclerosis (MS) have demonstrated the presence of meningeal inflammation in the brain1,2 and spinal cord (SC)3 from an early stage in the disease 4. The use of imaging methods to study meningeal abnormalities in vivo would therefore seem to be relevant, albeit technically challenging. The ability to directly visualize the SC pia mater (SCPM) using 3T could potentially provide new diagnostic information accessible with clinical systems and/or facilitate quantitative research investigations. The magnetization-prepared 3D T1w TFE sequence has been used traditionally to study the brain and SC because of the excellent contrast it offers between grey/white matter (GM/WM) and cerebrospinal fluid 5. In this work, the potential of this sequence to provide sufficiently high image contrast to identify an outer SC rim, therefore potentially resolving the SCPM directly, was investigated using a 3T system, firstly in a pilot investigation in the healthy cervical SC and subsequently in cases with secondary progressive MS (SPMS).METHOD
1) Pilot investigation
a) Participants: The optimisation of the 3D T1w TFE for SCPM depiction involved repeated acquisitions of a single volunteer, and variation of the MR parameters each time to determine the most appropriate WM/SCPM and CSF/SCPM contrast (GM/SCPM contrast was less relevant here and therefore not investigated); b) MR imaging: Using a Philips Achieva 3T and the product NV-16 coil, the standard implementation of the 3D T1w TFE for brain imaging was adapted for imaging the cervical SC axially with 16 slices, and with the centre of the imaging volume positioned at the C2/C3 level, using: TR/TE=12/6.1ms, FOV=256x128mm2, voxel size=0.5x0.5x3mm3, flip angle (FA) of the TFE readout pulse=8°, TFE factor=128, linear phase encoding, shot interval delay (SID)=3s and inversion delay time (TI)=840ms. Since image contrast is mostly governed by TI, SID and FA, data was acquired by incrementally varying these parameters, albeit within the constraints of the system software, using: i) TI: 840, 880, 920, 960, 1000, 1040ms ii) FA: 6°, 7°, 8°, 9°, 10°, 11° iii) SID: 1650, 2000, 3000, 4000, 5000, 6000ms; c) Image analysis: For each dataset, the relative contrast-to-noise ratio (CNR) between WM/SCPM and CSF/SCPM was calculated from the signal intensity (SI) and standard deviation (SD) values within each tissue type using,
$$CNR=\frac{\mid\ SI1-SI2\mid } {\sqrt{SD1^2+SD2^2}}$$
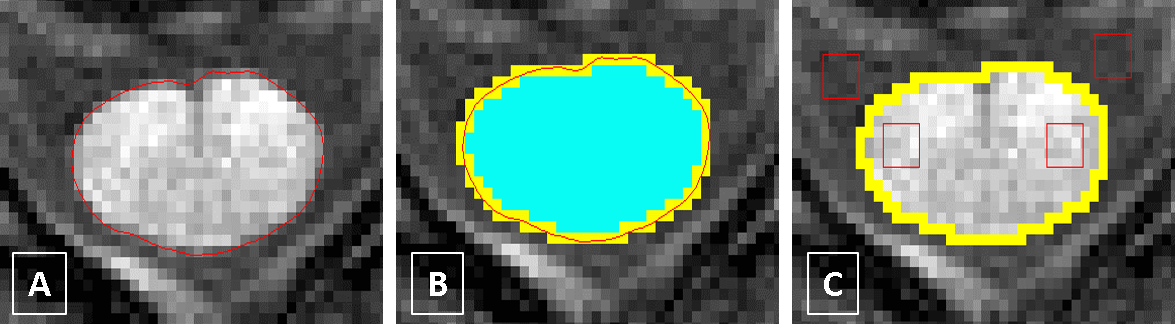
The SI values for the SCPM were obtained using the ‘cord finder’ option available with Jim 6 (www.xinapse.com) as follows: The cord boundary was first identified in all cases (Fig. 1A); using the wired mask from Jim 6, two binary masks were subsequently created, one including the pixels with partial volume and one excluding them, and the difference of the two defined the SCPM mask (Fig. 1B). This mask, when applied to the original image, contained the SI values corresponding to the SCPM. Furthermore, regions of interest (ROIs) were positioned within WM and CSF to obtain the corresponding SI values (Fig. 1C).
2) Investigation in MS
a) Participants: The optimised protocol was used to obtain SI values within SCPM in 23 healthy controls (HC) and 23 people with SPMS; b) Image analysis: 5 slices were extracted centred at the C2/C3 level in all cases and SCPM SI values were obtained as previously described; however, to remove any acquisition-related signal modulations (such as rf pulse spatial variations), normalised SCPM SI values were obtained (n-SCPM) from a division by the CSF SI values (Fig. 2); c) Statistical analysis: Differences in the mean n-SCPM SI values between HC and SPMS were investigated using an independent samples t test after checking the normality of distribution.
RESULTS
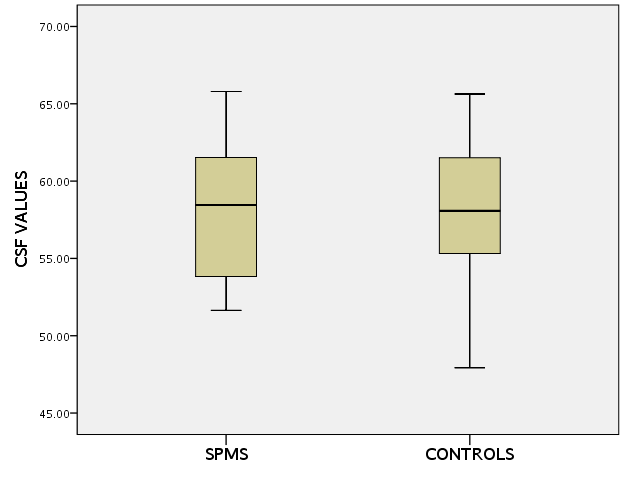
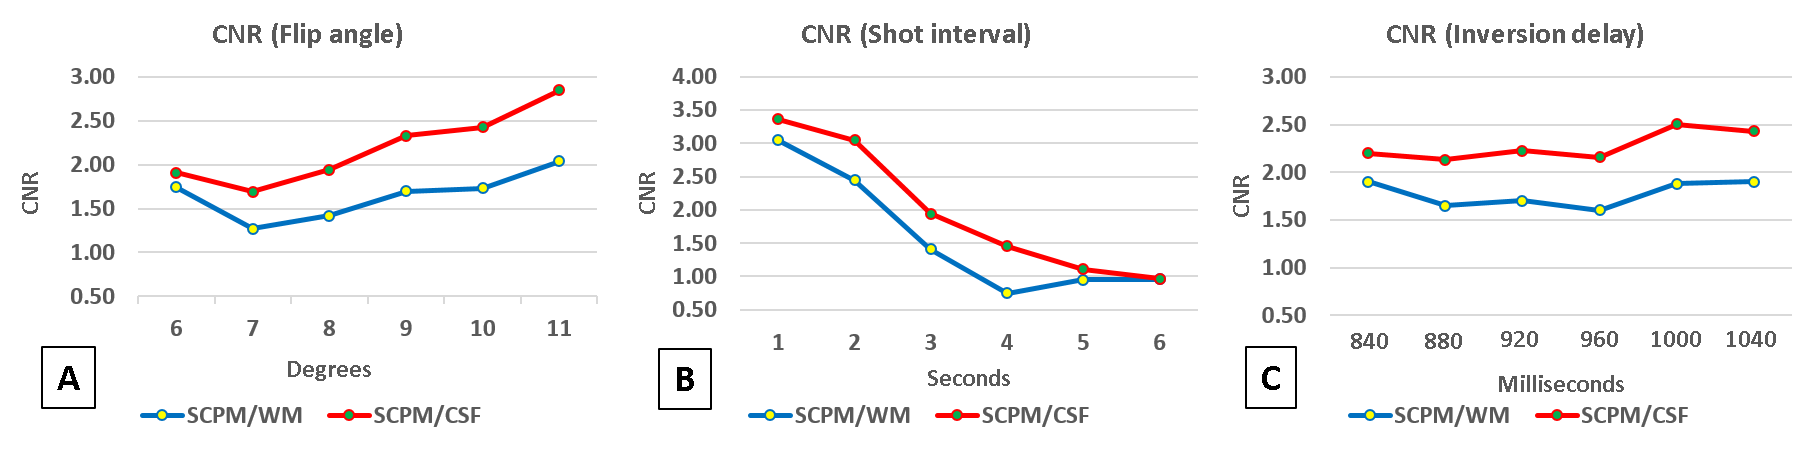
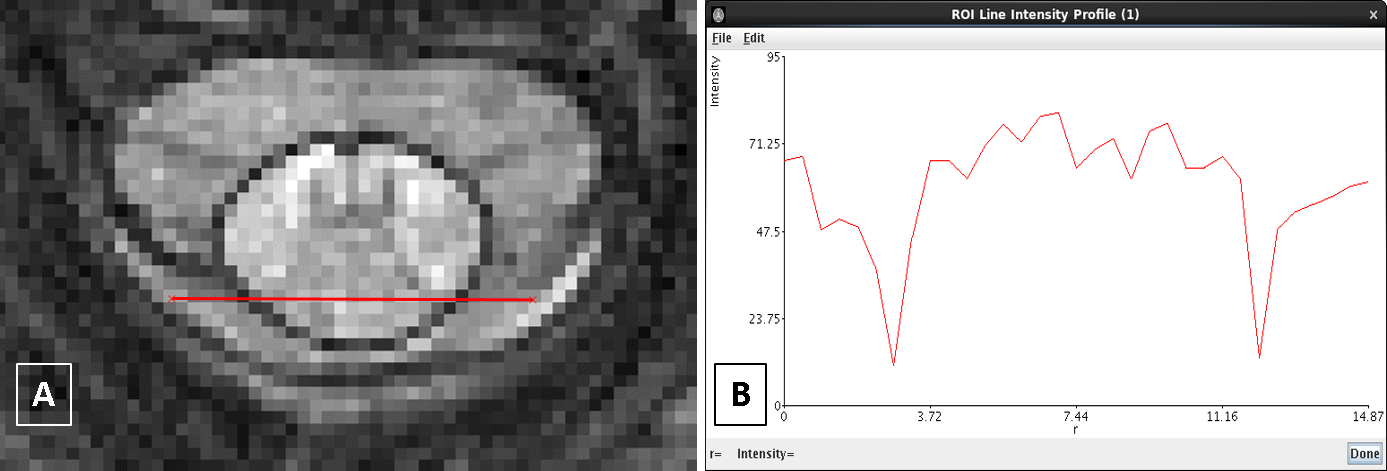
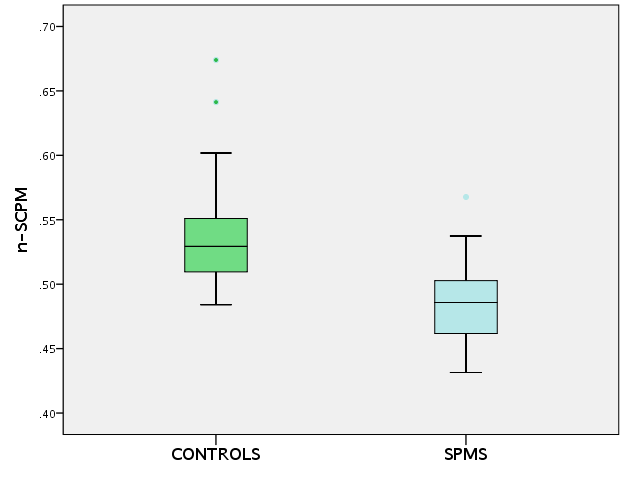
Fig. 3 shows CNR calculations between SCPM/WM and SCPM/CSF as a function of FA, SID and TI. Optimal SCPM depiction was achieved when the CNR values between SCPM/WM and SCPM/CSF were identical (see Fig. 4). Using these parameters for optimal SCPM depiction, significant differences in n-SCPM SI values were identified between HC and people with SPMS (p<0.001). The distribution of n-SCPM SI values in HC and people with SPMS is shown in Fig. 5.DISCUSSION AND CONCLUSION
In this work, the feasibility of resolving an outer SC rim is demonstrated using the magnetization-prepared 3D T1w TFE sequence on a clinical 3T system. We speculate that this rim is highly coincident with the SCPM due to different relaxation properties of the tissue from the high abundance of collagenous fibres within it6. Furthermore, the estimation of n-SCPM SI values has revealed significant differences between HC and people with SPMS in the upper cervical SC, possibly reflecting subtle changes within WM and/or the SCPM itself, which is in line with previous studies using quantitative imaging methods7.Acknowledgements
The UK MS Society and the UCL-UCLH Biomedical Research Centre for ongoing support.References
1) Magliozzi R, Howell O, Vora A et al. Meningeal B-cell follicle in secondary progressive multiple sclerosis associate with early onset of disease and severe cortical pathology. Brain 2007;130:1089-104.
2) Serafini B, Rosicarelli B, Magliozzi R et al. Detection of ectopic B-cell follicles with germinal centers in the meninges of patients with secondary progressive multiple sclerosis. Brain Pathol 2004;14:164-74.
3) Androdias G, Reynolds R, Chanal M et al. Meningeal T cells associate with diffuse axonal loss in multiple sclerosis spinal cords. Ann Neurol 2010;68:465-76.
4) Lucchinetti CF, Popescu BF, Bunyan RF et al. Inflammatory cortical demyelination in early multiple sclerosis. N Engl J Med 2011;365:2188-97.
5) Mugler JP, Brookeman JR. Three-dimensional magnetization-prepared rapid gradient echo imaging (3D MP RAGE). Magn Reson Med. 1990;15(1):152-7.
6) Reina MA, De León Casasola Ode L, Villanueva MC et al. Ultrastructural findings in human spinal pia mater in relation to subarachnoid anesthesia. Anesth Analg 2004;98:1479-85.
7) Kearney H, Yiannakas MC, Samson RS et al. Investigation of magnetization transfer ratio-derived pial and subpial abnormalities in the multiple sclerosis spinal cord. Brain 2014;137(Pt 9):2456-68.
Figures