0415
Improved Visualization of the Spinal Cord Lesions in Multiple Sclerosis using MP2RAGE at 3T1TNS/NIB/NINDS, National Institutes of Health, Bethesda, MD, United States, 2CENIR, UPMC-Inserm U1127, CNRS 7225, Institut Cerveau Moelle, Paris, France, 3HC NAM USA DI MR COLLAB, Siemens Medical Solutions, Bethesda, MD, United States, 4HC NAM USA DI MR COLLAB, Siemens Medical Solutions, Boston, MA, United States, 5Advanced Clinical Imaging Technology, Siemens Healthcare AG, Lausanne, Switzerland, 6Department of Radiology, Centre Hospitalier Universitaire Vaudois, Lausanne, Switzerland, 7Signal Processing Laboratory (LTS 5), Ecole Polytechnique Fédérale de Lausanne, Lausanne, Switzerland
Synopsis
Spinal cord lesions are known to be prevalent and contribute to disability in multiple sclerosis (MS). We explored the use of the MP2RAGE sequence for better delineation of spinal cord lesions in a clinical setting, and compared it with standard sequences used in MS. A more accurate measurement of lesion load and better visualization of the lesion location within the spinal cord can help improving MS diagnosis and may be developed to an imaging biomarker of disease burden.
Introduction
The detection of spinal cord (SC) abnormalities is important for the diagnosis of multiple sclerosis (MS), with 75-90% of patients1 presenting SC lesions. However, imaging the thoracic spinal cord (t-spine) is especially challenging due to smaller cross sectional size, respiratory motion, flow and susceptibility artifacts. Improved visualization of the SC lesions in MS may help better explain disability in patients with MS. Toward this end, we have previously reported better lesion conspicuity with MPRAGE (Magnetization Prepared Rapid Acquisition Gradient Echoes)) as compared to the standard T2-TSE, STIR, or GRE sequences at 3T2. The recently developed MP2RAGE sequence3, has been proven to be useful in brain imaging, especially in the presence of receive and transmit RF inhomogeneities and to cancel residual T2*/PD contrast. In this study, we applied the MP2RAGE sequence for SC imaging at 3T for routine clinical use, and compared it with the previously optimized MPRAGE aiming at improving MS lesion conspicuity.Methods
Cervical spine (c-spine) and t-spine were imaged in 9 subjects with MS (5 women, average 44 + 11 SD y.o.) using the spine array coil on 3T system (MAGNETOM Skyra, Siemens, Erlangen, Germany). Previously optimized protocols were used, including STIR (2D TSE, TR/TE/TI/FA: 8130/63/210ms/120˚, 0.5 mm2 isotropic in plane, 1.4 mm slice thickness) in the sagittal plane as well as T2*-MEDIC (2D GRE, TR/TE/FA: 560/17ms/20°, 0.8 mm2 isotropic in plane, 3 mm slice thickness) and T1-MPRAGE (3D TFL, TR/TE/TI/FA: 3000/4.5/900 ms/9°, TA:9m45s) in both sagittal (1 mm3 isotropic) and axial (0.8 mm2 isotropic in plane, 3-4 mm slice thickness) planes. These sequences were compared to the MP2RAGE sequence (3D, TR/TE/TI1/TI2/FA1/FA2: 3500/3.5/900/1440 ms/9˚/9˚ with 1-1 binomial water excitation, TA:10m50s) in the sagittal and axial planes. The resolution for the sagittal and axial MP2RAGE sequences matched, respectively, with the MPRAGE and the MEDIC resolutions. SC lesions were visualized on uniform3 and denoised (UNI-DEN) images, generated in the MP2RAGE by normalized complex division, and are shown to reduce the background noise significantly4. Two metrics were used to compare the performance of the sequences – signal-to-noise ratio (SNR) (S1/SDnoise) and contrast-to-noise ratio (CNR) (SNR1-SNR2).Results and Discussion
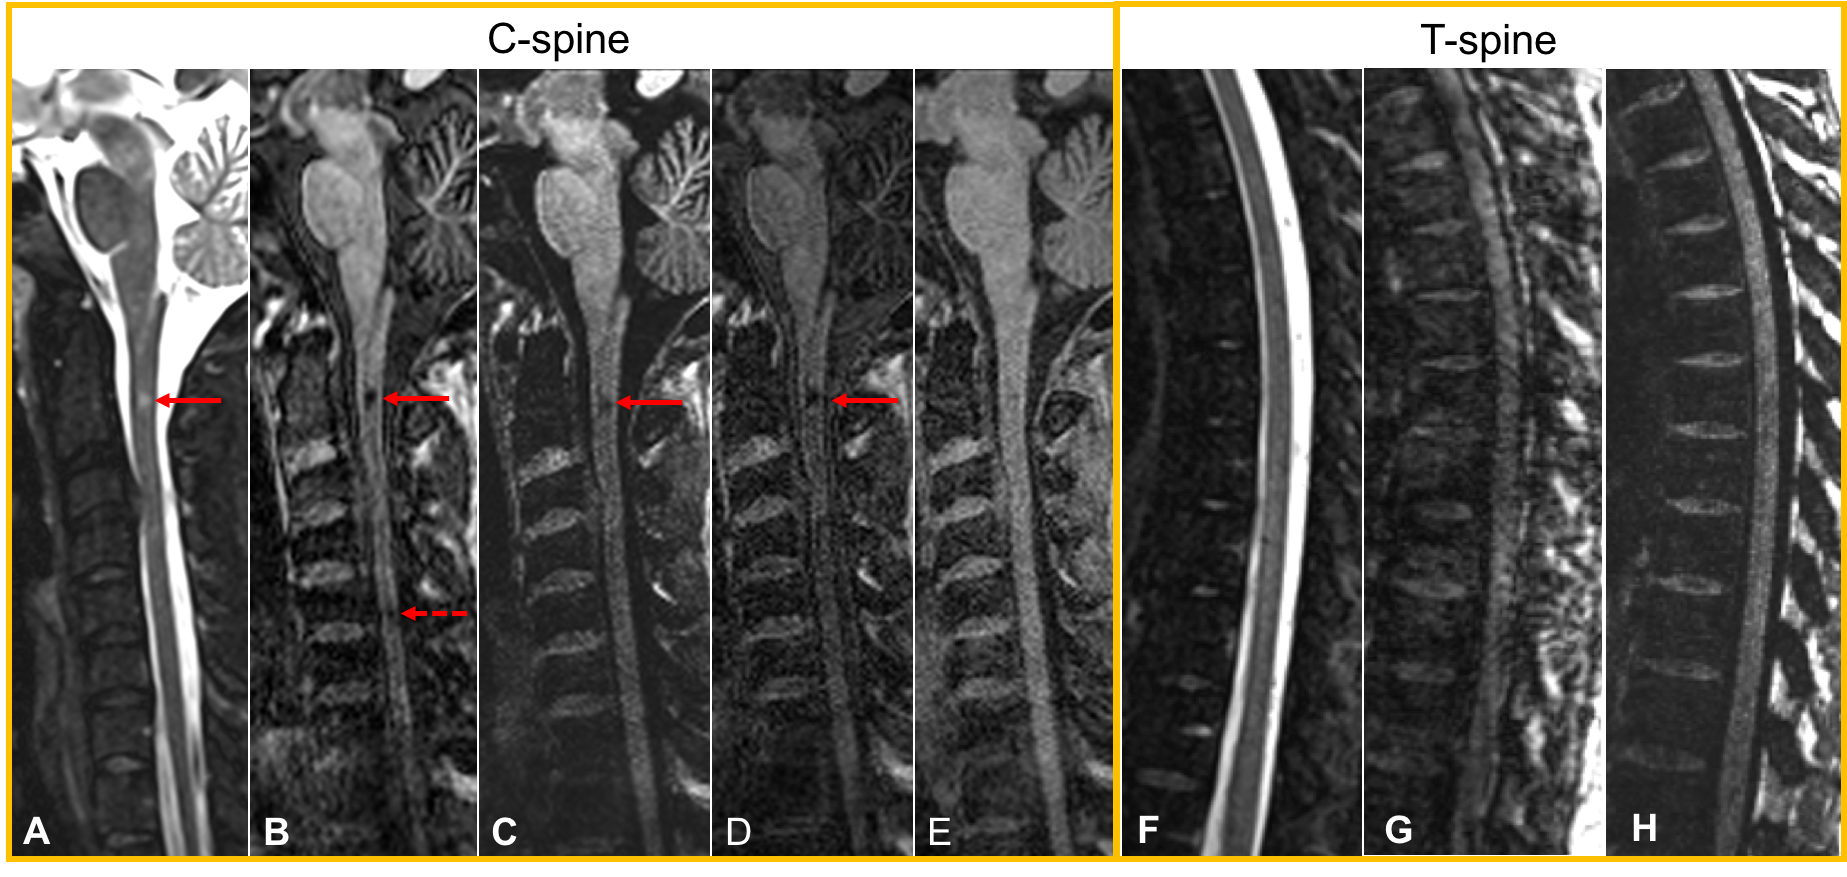
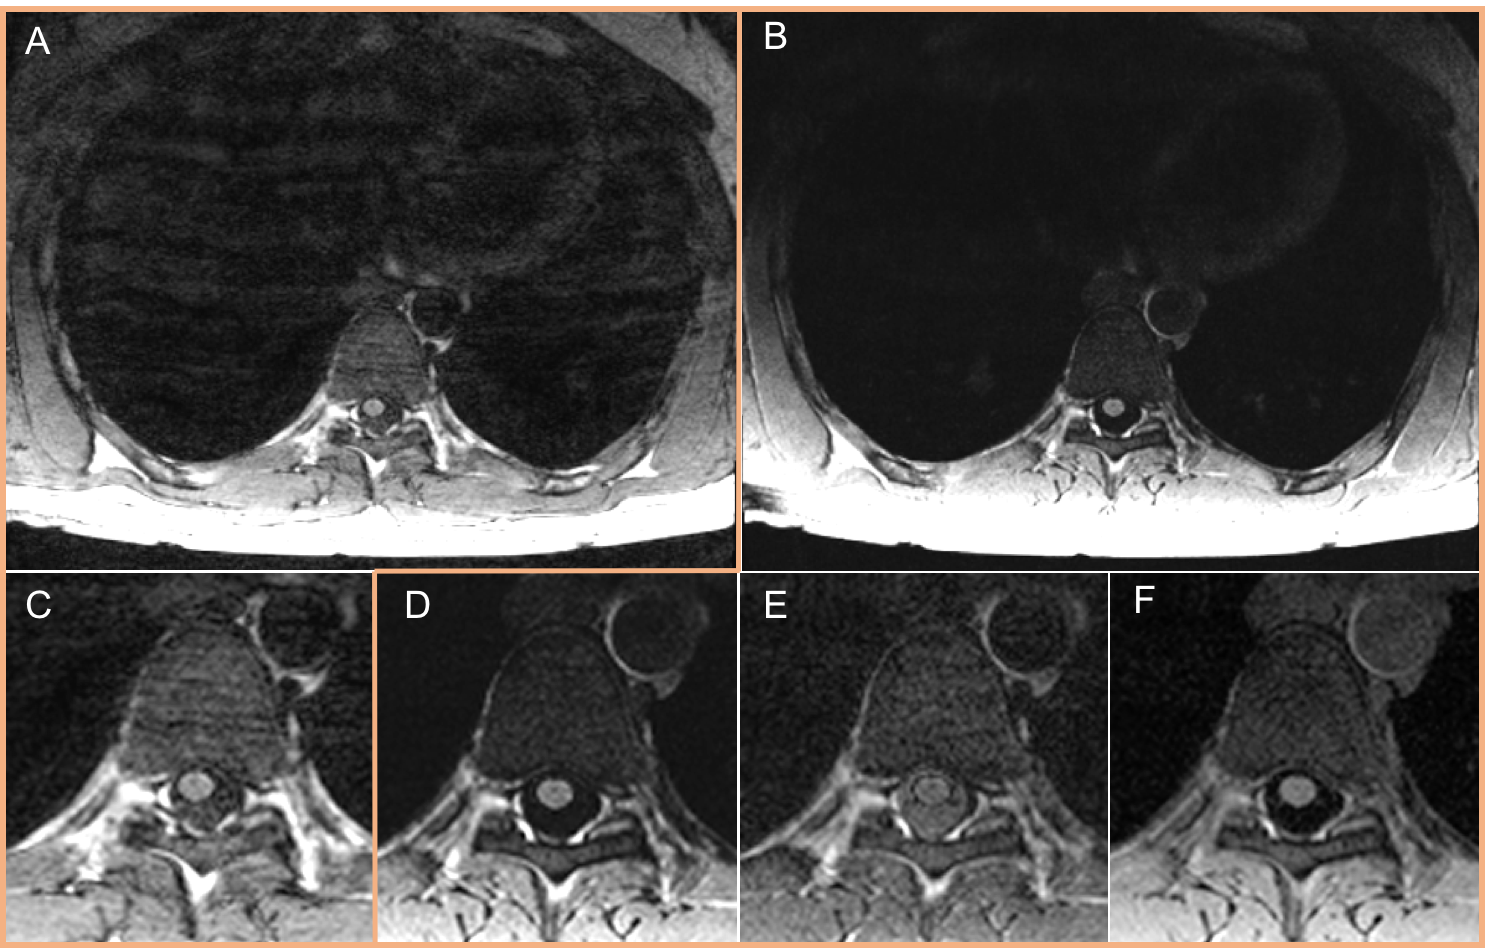
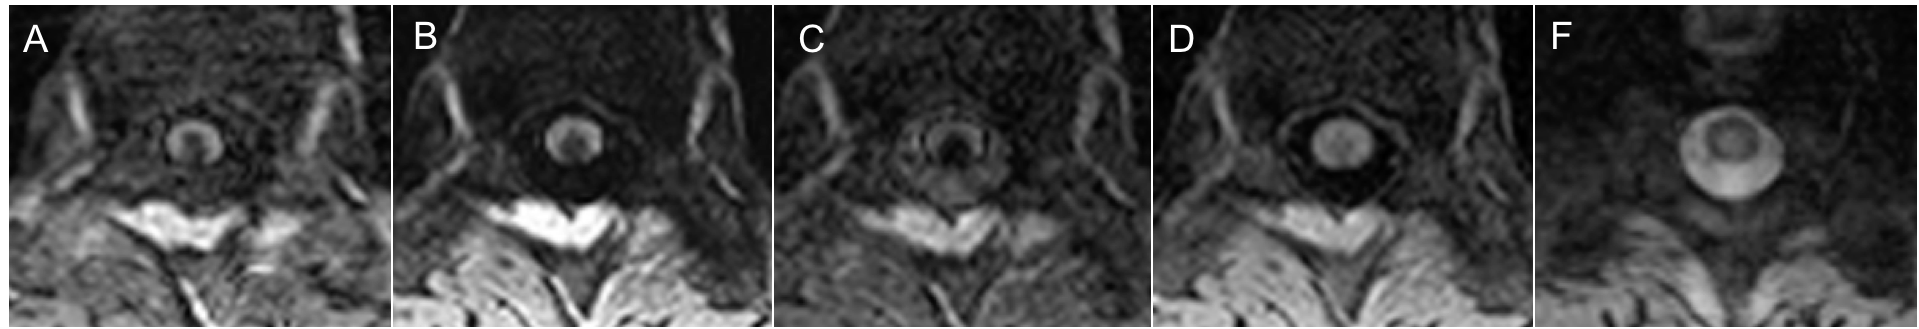
Figure 1 shows exemplary images comparing the MPRAGE and MP2RAGE in the c/t-spine section. The sagittal MP2RAGE UNI-DEN images showed reduced artifacts and more homogenous signal through the cord compared to the MPRAGE images. This allowed improved visualization of the cord and of lesion tissue, especially in the t-spine, and discrimination of artifacts from lesions, compared to STIR sequence. On axial, MP2RAGE shows a better delineation of the cord edge, more consistency across slices, and an improved contrast between cord and CSF as well as between cord and lesion. Figure 2 shows better image quality with fewer artifacts (bias field related as well as reduced motion) in MP2RAGE (Fig. 2B,D) compared to the MPRAGE (Fig. 2A,C). The denoise-filter in MP2RAGE boosts the SNR from the cord by a factor of about 3.5 in comparison with MPRAGE. The observed MS cord lesion was better delineated in the MP2RAGE UNI-DEN (Fig. 3B) images than in the MPRAGE (Fig. 3A). Preliminary results of CNR calculation between lesion, normal appearing cord (NAC) and, CSF from MP2RAGE and MPRAGE images are shown in Table 1. While the MPRAGE gives optimal CNR for visualization of cord and lesion, the individual inversion contrast images of MP2RAGE do not (Fig. 3C,D). However, after the regularized “denoised” normalized complex division the CNR of MP2RAGE is 4-5 times higher than MPRAGE, thereby providing excellent visualization of both NAC and lesions. Axial orientation was chosen so as to be able to increase the SNR through the use of thicker slices. Thick axial slices also allow more efficient coverage of the entire SC. In order to assess the accuracy of lesion detection with MP2RAGE, more lesions have to be compared with MPRAGE. With a better contrast and sensitivity, MP2RAGE could be used to follow the lesions evolution over the course of the disease.Conclusion
The use of MP2RAGE allowed better visualization of the SC and lesions as compared to MPRAGE, primarily due to reduction in receive bias fields, RF transmit field inhomogeneity but also reduction in motion artifacts and B0 inhomogeneity. Further improvements to axial MP2RAGE using phase encoding reordering will allow for efficient coverage of the entire SC in about 15 minutes, which could lead to easy clinical adoption for MS disease assessment. Addition of spatial saturation pulses as well as navigator correction for further improvement in image quality is under investigation.Acknowledgements
No acknowledgement found.References
1: Spinal cord abnormalities in recently diagnosed MS patients: added value of spinal MRI examination. Neurology 2004; 62: 226–33.
2: Nair G, Absinta M, Reich DS. Optimized T1-MPRAGE Sequence for Better Visualization of Spinal Cord MS Lesions at 3T. AJNR American journal of neuroradiology. 2013;34(11):2215-2222.
3: Marques J.P. et al. MP2RAGE, a self bias-field corrected sequence for improved segmentation and T1-mapping at high field. NeuroImage 2010; 49: 1271-1281.
4: O’Brien K, Krueger G, Lazeyras F, Gruetter R, Roche A, “A simple method to denoise MP2RAGE”, Proceedings of ISMRM 2013 (Salt Lake City), abstract #269
Figures