0414
Boundary shift integral to compute brain and cervical spinal cord longitudinal volume changes using the same 3DT1w volumetric scans in multiple sclerosis1Translational Imaging Group, CMIC, Dep. of Medical Physics and Biomedical Engineering, University College London, London, United Kingdom, 2UCL Institute of Neurology, Queen Square MS Centre, University College London, London, United Kingdom, 3Department of Neurology, University Hospital Basel, Switzerland, 4Medical Image Analysis Center Basel, Switzerland, 5Radiology & Nuclear Medicine, VU University Medical Centre, Netherlands, 6Department of Brain and Behavioural Sciences, University of Pavia, Italy, 7Brain MRI 3T Mondino Research Center, C. Mondino National Neurological Institute, Italy
Synopsis
Brain atrophy is considered to be the net accumulative irreversible disease burden as the ultimate consequence of different pathological processes found in the multiple sclerosis brain. A recent cross-sectional study demonstrated the possibility to assess atrophy of the spinal cord using 3DT1w brain volumetric scans. However, to date, no unified technique has been presented to longitudinally assess brain and spinal cord atrophy using the same MRI acquisition. Here we present a proof-of-concept data from a pipeline that uses the boundary shift integral to compute both brain and cervical spinal cord atrophy rates using the same 3DT1w brain volumetric scans.
Introduction
Brain and cervical spinal cord (SC) atrophy are important magnetic resonance imaging (MRI) biomarkers of neurodegeneration in multiple sclerosis1,2. In MS clinical trials, brain and SC atrophy are typically measured using different techniques. For example, Structural Image Evaluation using Normalisation of Atrophy (SIENA)10 is a standard tool to asses atrophy in the brain, while the cross-sectional area (CSA)2 is used to measure SC atrophy, and normally, they are computed using separate MRI acquisitions. Recent work4,5 showed the feasibility to use volumetric 3DT1w brain images to measure spinal cord volume, potentially enabling retrospective analyses of existing datasets and potential reduction in scan times. However, to date, there is no unified technique to longitudinally assess brain and SC atrophy using the same MRI acquisition.
Here we present for a first time a proof-of-concept results from a pipeline that applies the boundary shift integral (BSI) for simultaneous computation of brain3 and cervical SC6 atrophy measures using the same 3DT1w brain volumetric MR images that cover the upper cervical SC.
Methods
We analysed brain T1 MPRAGE images (1x1x1 mm3) with coverage of the upper cervical SC from 10 MS patients scanned at baseline and 5 years [1 clinically-isolated syndrome, 5 relapsing-remitting, 3 secondary-progressive and 1 primary progressive MS patients; mean disease duration 11.1±5.8 years, median EDSS at baseline 3.5 (range 1.5-6.5) and follow-up at 5 years 4.0 (range 2-6.5)]. The disease course did not change over the 5 years. Ten healthy people scanned at baseline and 12 months served as controls (HCs).
Mean cervical SC area (CSA) was assessed by an experienced rater who manually outlined the cervical SC on 10 contiguous slices with the most inferior slice passing centrally through the C2/C3 vertebral disk. Masks were independently drawn at both time-points for all the participants using JIM v6 (Xinapse Systems, UK). MS lesions were manually drawn using JIM, and images were in-painted using a recent longitudinal patch-based technique7 that introduces less intensity bias, artefacts and spurious edges than previous techniques.
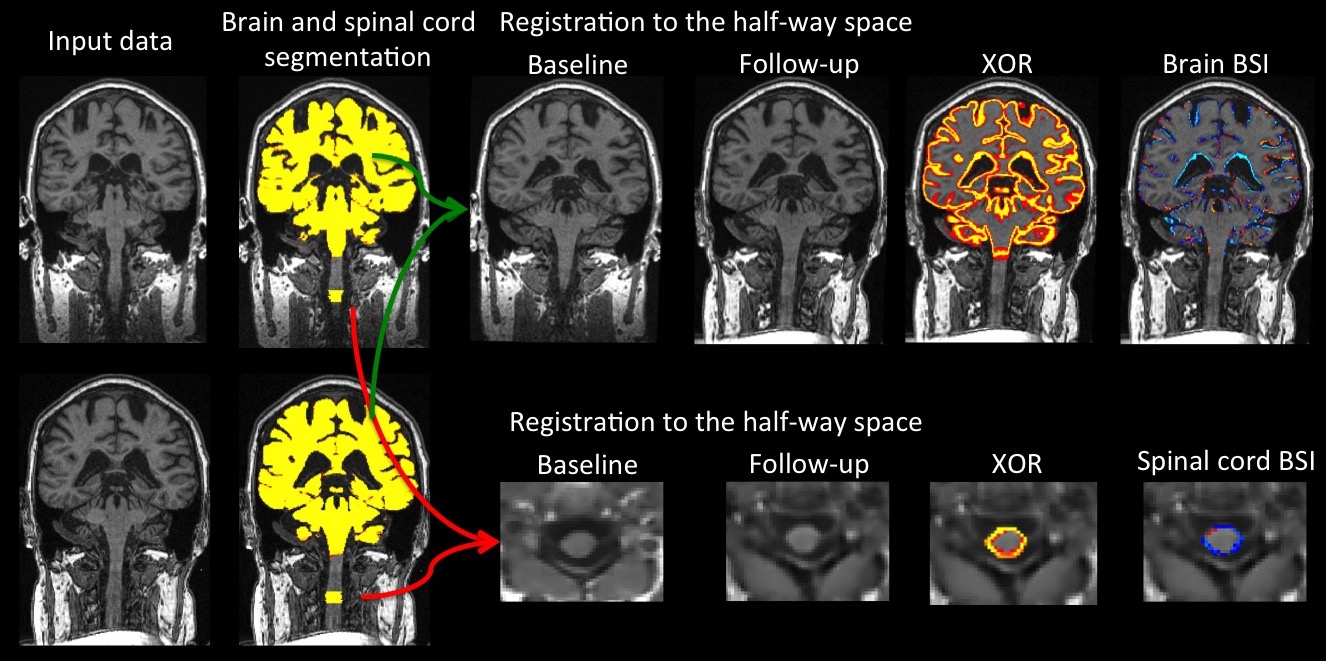
To compute brain atrophy3, images were bias field corrected using N4, automatically segmented using STEPS8, affine registered to the half-way space using NiftyReg9 and symmetrical bias field corrected. For the SC analysis, images were de-noised using non-local means filter, bias field corrected using N4; cords were then straightened moving the center-of-mass to the center of the image, rigid registered to the half-way space using NiftyReg9 and symmetrical bias field corrected. Finally, both pipelines estimated the degree of atrophy in the vicinity of the tissue/CSF boundary using a non-binary XOR region-of-interest of the aligned probabilistic segmentations of baseline and repeat scans. This symmetric technique ensures that findings are not be biased by the registration process. Figure 1 schematically summarizes both pipelines.
To assess brain and cervical SC atrophy we measured the annualized percentage brain volume change (aPBVC) and the annualized cervical spinal cord volume change (aPCVC) using the BSI. For comparison, cervical SC atrophy rates were also determined as the annualized percentage cervical SC area change (aPCSAC) using the manual segmentations at each time-point. Sample size calculation was based on two group t-test for differences between independent means. Stata 12.1 was used for all statistical analysis.
Results
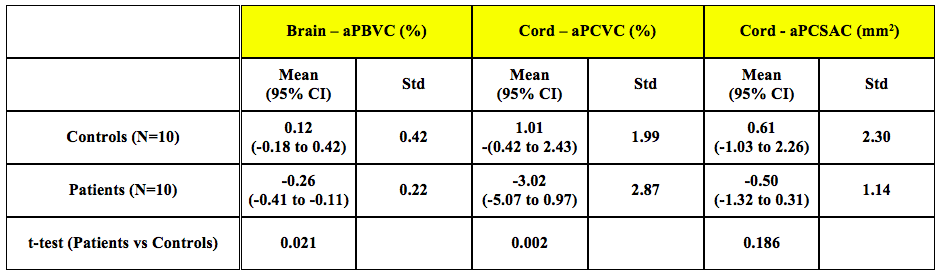
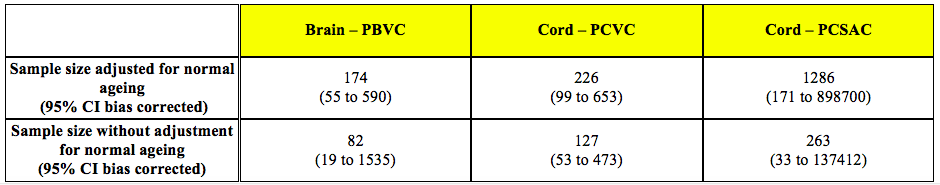
As expected aPBVC was higher in patients than HCs (p=0.02). In the entire study group, there was no significant difference in cervical SC atrophy assessed using the BSI versus manual segmentation (p=0.116). However, in contrast to the manual segmentation technique, we found a significant difference in aPCVC between patients and HCs when using BSI (p=0.002). Based on 5-year data in the MS group, sample size calculations estimate that 226 patients per arm are required to detect a treatment difference of 25% for percent cervical spinal volume change with a power of 80% (alpha: 0.05).Conclusions
We successfully used, for the first time, the same image biomarker for computing longitudinal atrophy in two clinically relevant central nervous system (CNS) areas (brain and SC) using the same 3DT1w brain volumetric scans. While the segmentation based technique (CSA) failed to detect a significant difference in cervical SC atrophy between patients and controls, the registration-based method using BSI detected significant differences between patients and controls. Future studies will aim to reproduce these results in larger cohorts.Acknowledgements
NIHR BRC UCLH/UCL High Impact Initiative (BW.mn.BRC10269), EPSRC (EP/H046410/1,EP/J020990/1,EP/K005278), MRC (MR/J01107X/1), H2020-EU.3.1 CDS-QUAMRI grant (ref: 634541), ISRT, WfL & CHNF (INSPIRED), UK MS Society and Brain Research Trust.References
1) Miller, DH et al. Measurement of atrophy in multiple sclerosis: pathological basis, methodological aspects and clinical relevance. Brain 125, 1676-1995 (2002)
2) Losseff, N. et al. Spinal cord atrophy and disability in multiple sclerosis. A new reproducible and sensitive MRI method with potential to monitor disease progression. Brain 119, 701–708 (1996).
3) Prados, F. et al. Measuring brain atrophy with a generalized formulation of the boundary shift integral. Neurobiology of aging. 2015 Volume 36, Supplement 1, Pages S81–S90
4) Freund, P. et al. Method for simultaneous voxel-based morphometry of the brain and cervical spinal cord area measurements using 3D-MDEFT. J Magn Reson Imaging. 2010 Nov;32(5):1242-7.
5) Liu, Z. et al. Cervical cord area measurement using volumetric brain magnetic resonance imaging in multiple sclerosis. Multiple Sclerosis and Related Disorders (2015) 4, 52–57.
6) Prados, F. et al. Atrophy computation in the spinal cord using the Boundary Shift Integral. In Proceedings of the 24th Annual Meeting of ISMRM, Singapore, 850 (ISMRM, 2016).
7) Prados, F. et al. A multi-time-point modality-agnostic patch-based method for lesion filling in multiple sclerosis. NeuroImage, 139 (2016), pp. 376-384
8) Cardoso, M.J. et al. STEPS similarity and truth estimation for propagated segmentations and its application to hippocampal segmentation and brain parcelation. Med. Image Anal., 17 (2013), pp. 671–684
9) Modat, M. et al. Global image registration using a symmetric block-matching approach. JMI 2014
10) Smith, S.M. et al. Normalized accurate measurement of longitudinal brain change. J. Comput. Assist. Tomogr. 2001;25:466–475.
Figures