0413
Repeatability and reproducibility of spinal cord atrophy measurements in a multiple sclerosis population using the Spinal Cord Toolbox1NeuroPoly Lab, Institute of Biomedical Engineering, Polytechnique Montreal, Montreal, QC, Canada, 2Department of Clinical Science, Intervention and Technology, Karolinska Institutet, Stockholm, Sweden, 3Department of Radiology, Karolinska University Hospital, Stockholm, Sweden, 4Department of Clinical Neuroscience, Karolinska Institutet, Stockholm, Sweden, 5Department of Neurology, Karolinska University Hospital, Stockholm, Sweden, 6Montreal Heart Institute, Montreal, QC, Canada, 7Functional Neuroimaging Unit, CRIUGM, Université de Montréal, Montreal, QC, Canada
Synopsis
Spinal cord atrophy is a major determinant of physical disability in multiple sclerosis (MS) and other diseases with neurodegeneration. The upper spinal cord cross-sectional area (CSA) is therefore a clinically important measurement reflecting global spinal cord atrophy. New image analysis software enable semi- and fully-automatic quantification of spinal cord atrophy. This study characterizes the repeatability and reproducibility of semi-automatic CSA measurements of the spinal cord in healthy subjects and in patients with multiple sclerosis, using the Spinal Cord Toolbox (SCT). Results demonstrated the high repeatability and reproducibility of CSA measures using SCT in both healthy persons and in MS.
Purpose
Assessing the repeatability and reproducibility of semi-automatic cervical spinal cord cross-sectional area (CSA) measurements using the Spinal Cord Toolbox1 (SCT) in healthy persons and patients with multiple sclerosis (MS) scanned twice on three clinical MRI scanners on the same day.Introduction
Spinal cord CSA measured over the C1-C2 vertebral levels is a good biomarker for spinal cord atrophy in multiple sclerosis (MS)2. However, measuring spinal cord CSA with high reproducibility and repeatability may be hindered by the high variability in image quality across MRI systems. The Spinal Cord Toolbox (SCT), a comprehensive software for processing and analyzing multi-parametric MRI data of the spinal cord, enables fully or semi-automatic measurements of spinal cord CSA by using automatic spinal cord detection and segmentation3. This study aims at characterizing the repeatability and reproducibility of spinal cord CSA measurements performed with SCT in healthy subjects and in persons with MS.Methods
Study participants: 9 patients with MS (6 females; age 38±13 years) and 3 healthy subjects (1 female; age 30±3.3 years) were recruited for the study. Patients were diagnosed according to the latest diagnostic MS criteria4, and represented all subtypes: 6 relapsing-remitting MS, 2 secondary progressive and 1 primary progressive MS5. Their disease duration was 7.3±5.2 years and their median Expanded Disability Status Scale score was 2.0 (range 1.0-5.5). The study was approved by the Regional ethics review board and written informed consent was obtained from all participants.
Image acquisition: Each subject was scanned twice with repositioning in three clinical MRI scanners (Siemens Aera and Avanto 1.5T and Trio 3.0T) on the same day with a 3D T1-weighted sequence (magnetization-prepared rapid gradient-echo) covering the brain and upper cervical spinal cord. Imaging parameters were: axial acquisition, 160 slices, 1.5 mm slice thickness, 1.0x1.0 mm in-plane resolution. Aera/Avanto/Trio parameters: flip angle 15/15/9°; echo time 3.02/3.55/3.39 ms; repetition time 1900 ms for all; inversion time 1100/1100/900 ms; bandwidth 160/130/250 Hz/voxel.
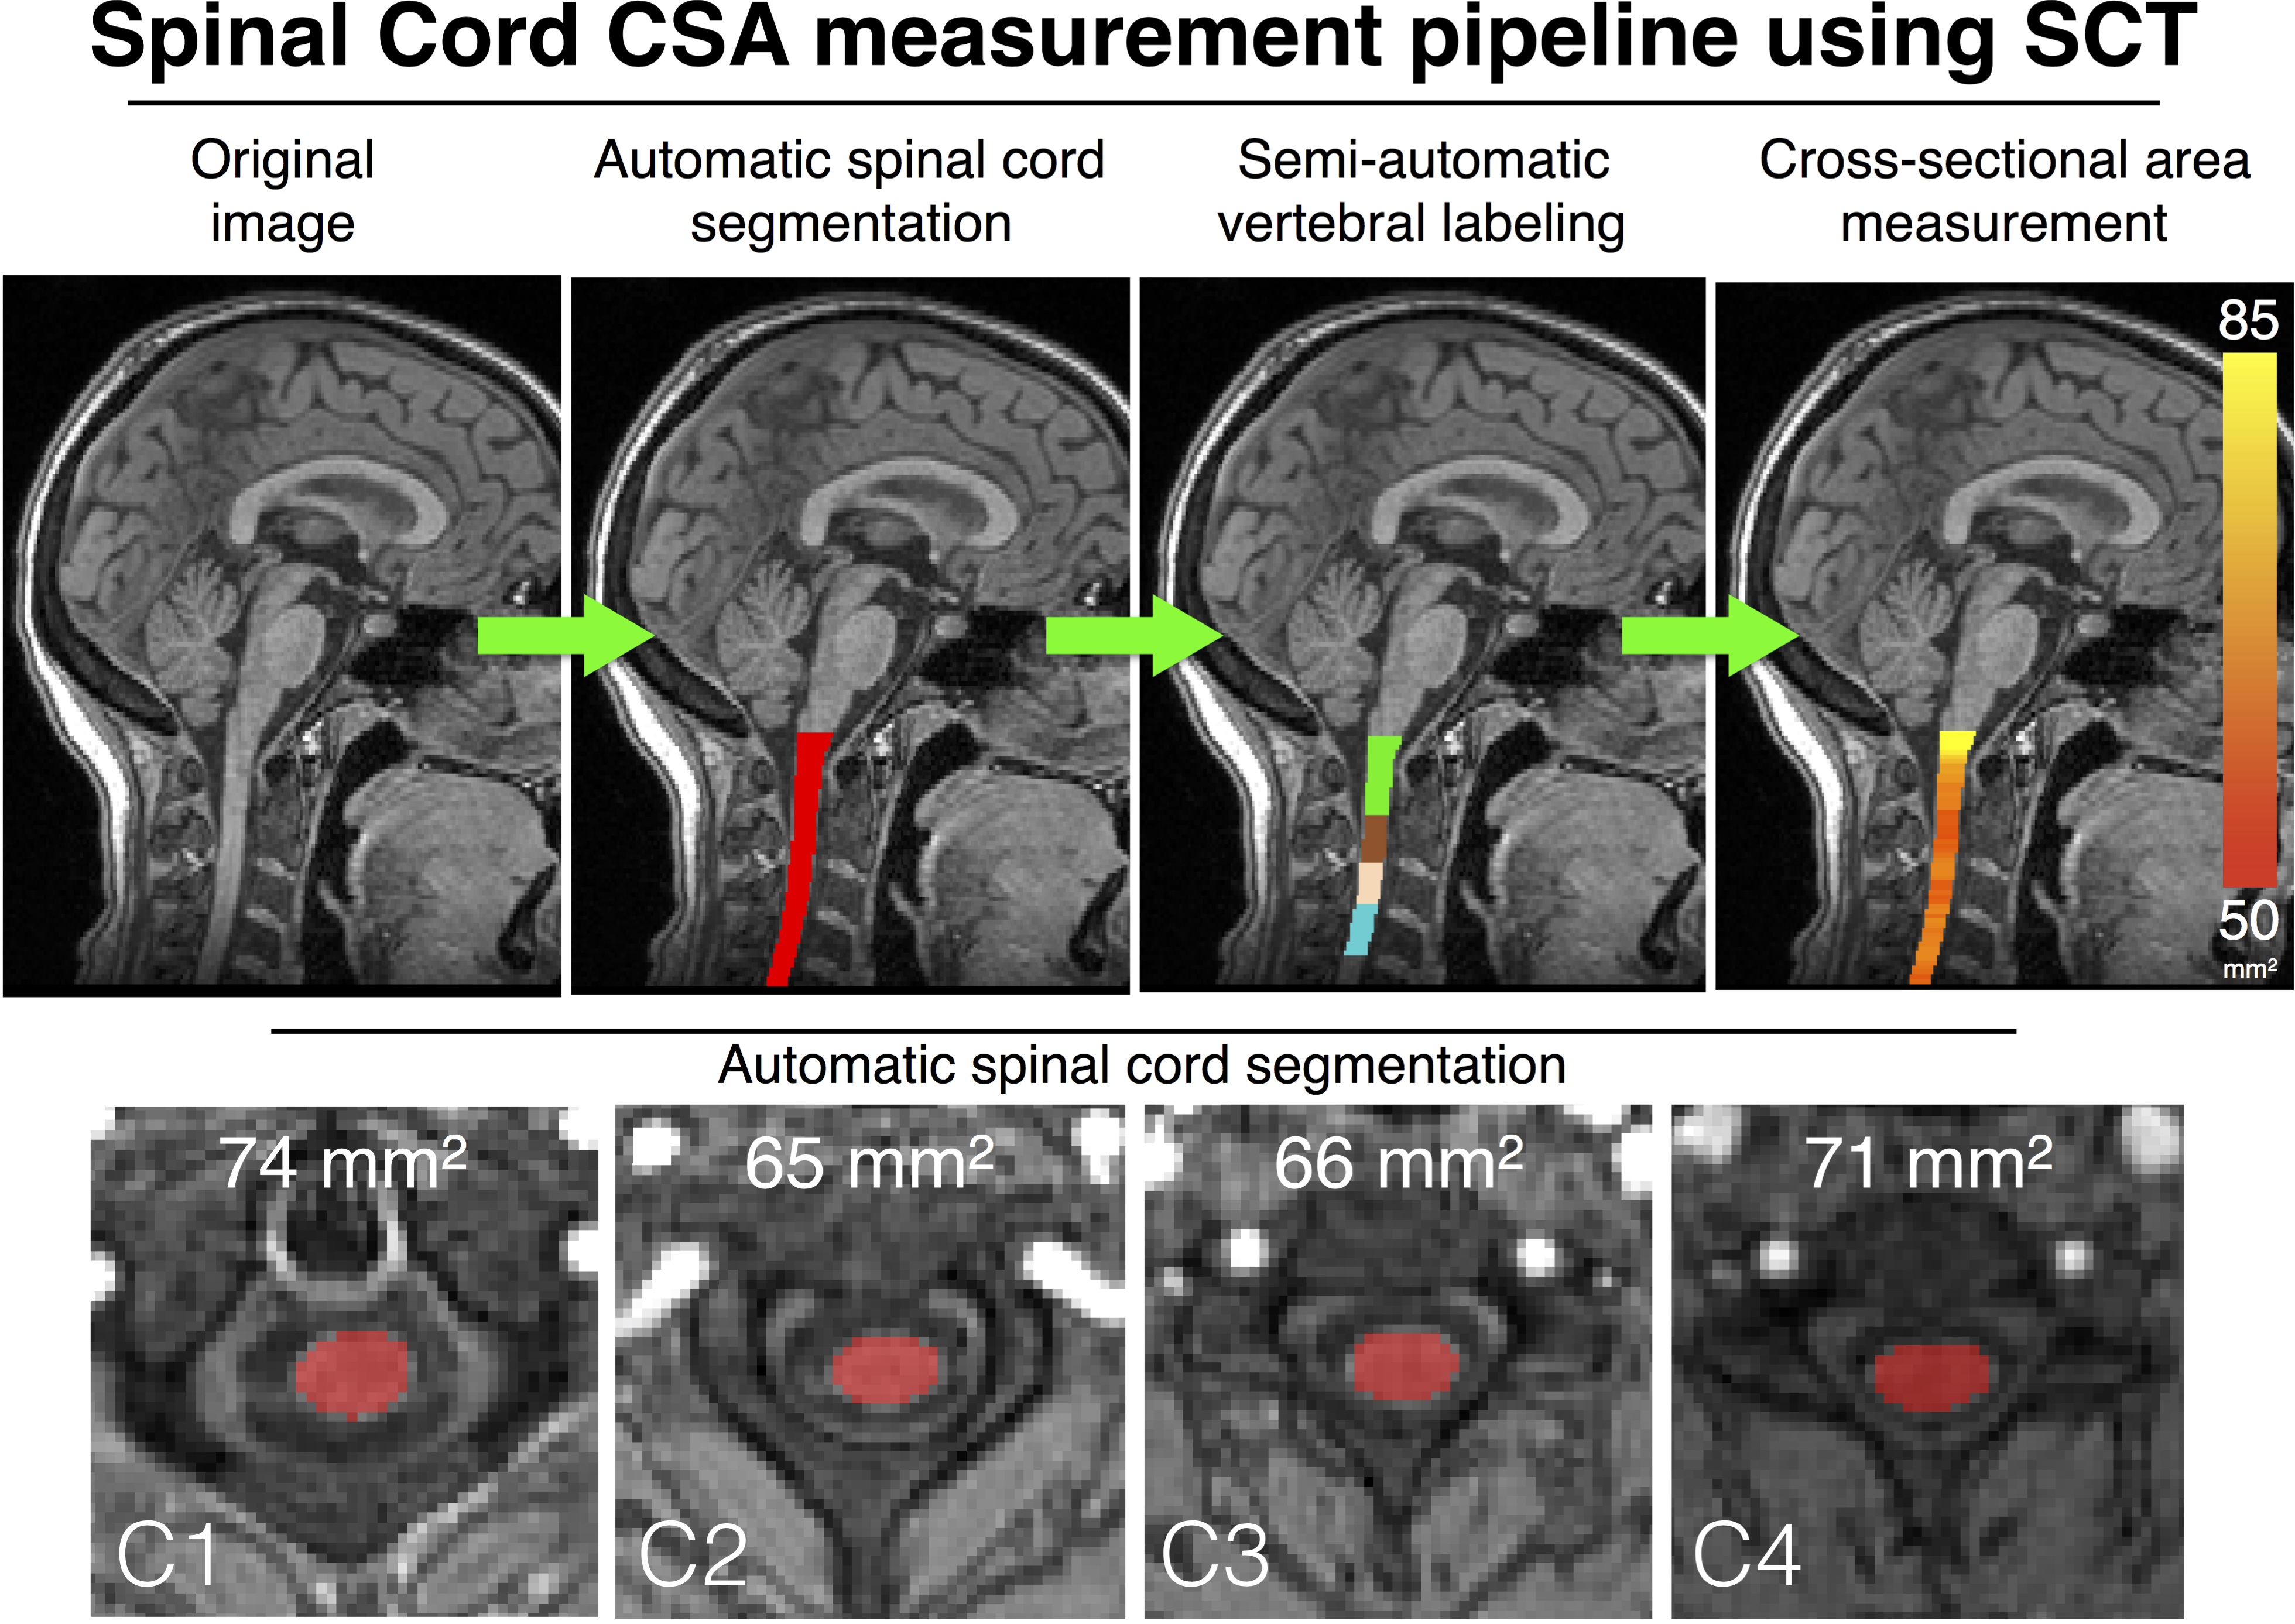
Image processing: All images were analyzed using SCT v3.0 using the following processes (Figure 1): (i) automatic spinal cord segmentation, (ii) semi-automatic vertebral labeling and (iii) cross-sectional area (CSA) measurements averaged over the C1-C2 vertebral levels. Additionally, manual segmentation and manual vertebral labeling were performed by a trained expert.
Statistical analysis: The coefficient of repeatability (same scanner), the within-subject coefficient of variance, the coefficient of reproducibility (across scanners) and the intra-class correlation coefficients (ICC) were computed as recommended by the Quantitative Imaging Biomarkers Alliance6. The repeatability and reproducibility coefficients are defined as the value under which the difference between any two CSA measurements on the same patient should fall within 95% confidence. ICC is defined as the proportion of total variation in CSA measurements explained by between-patient differences rather than variation for the same patients.
Results
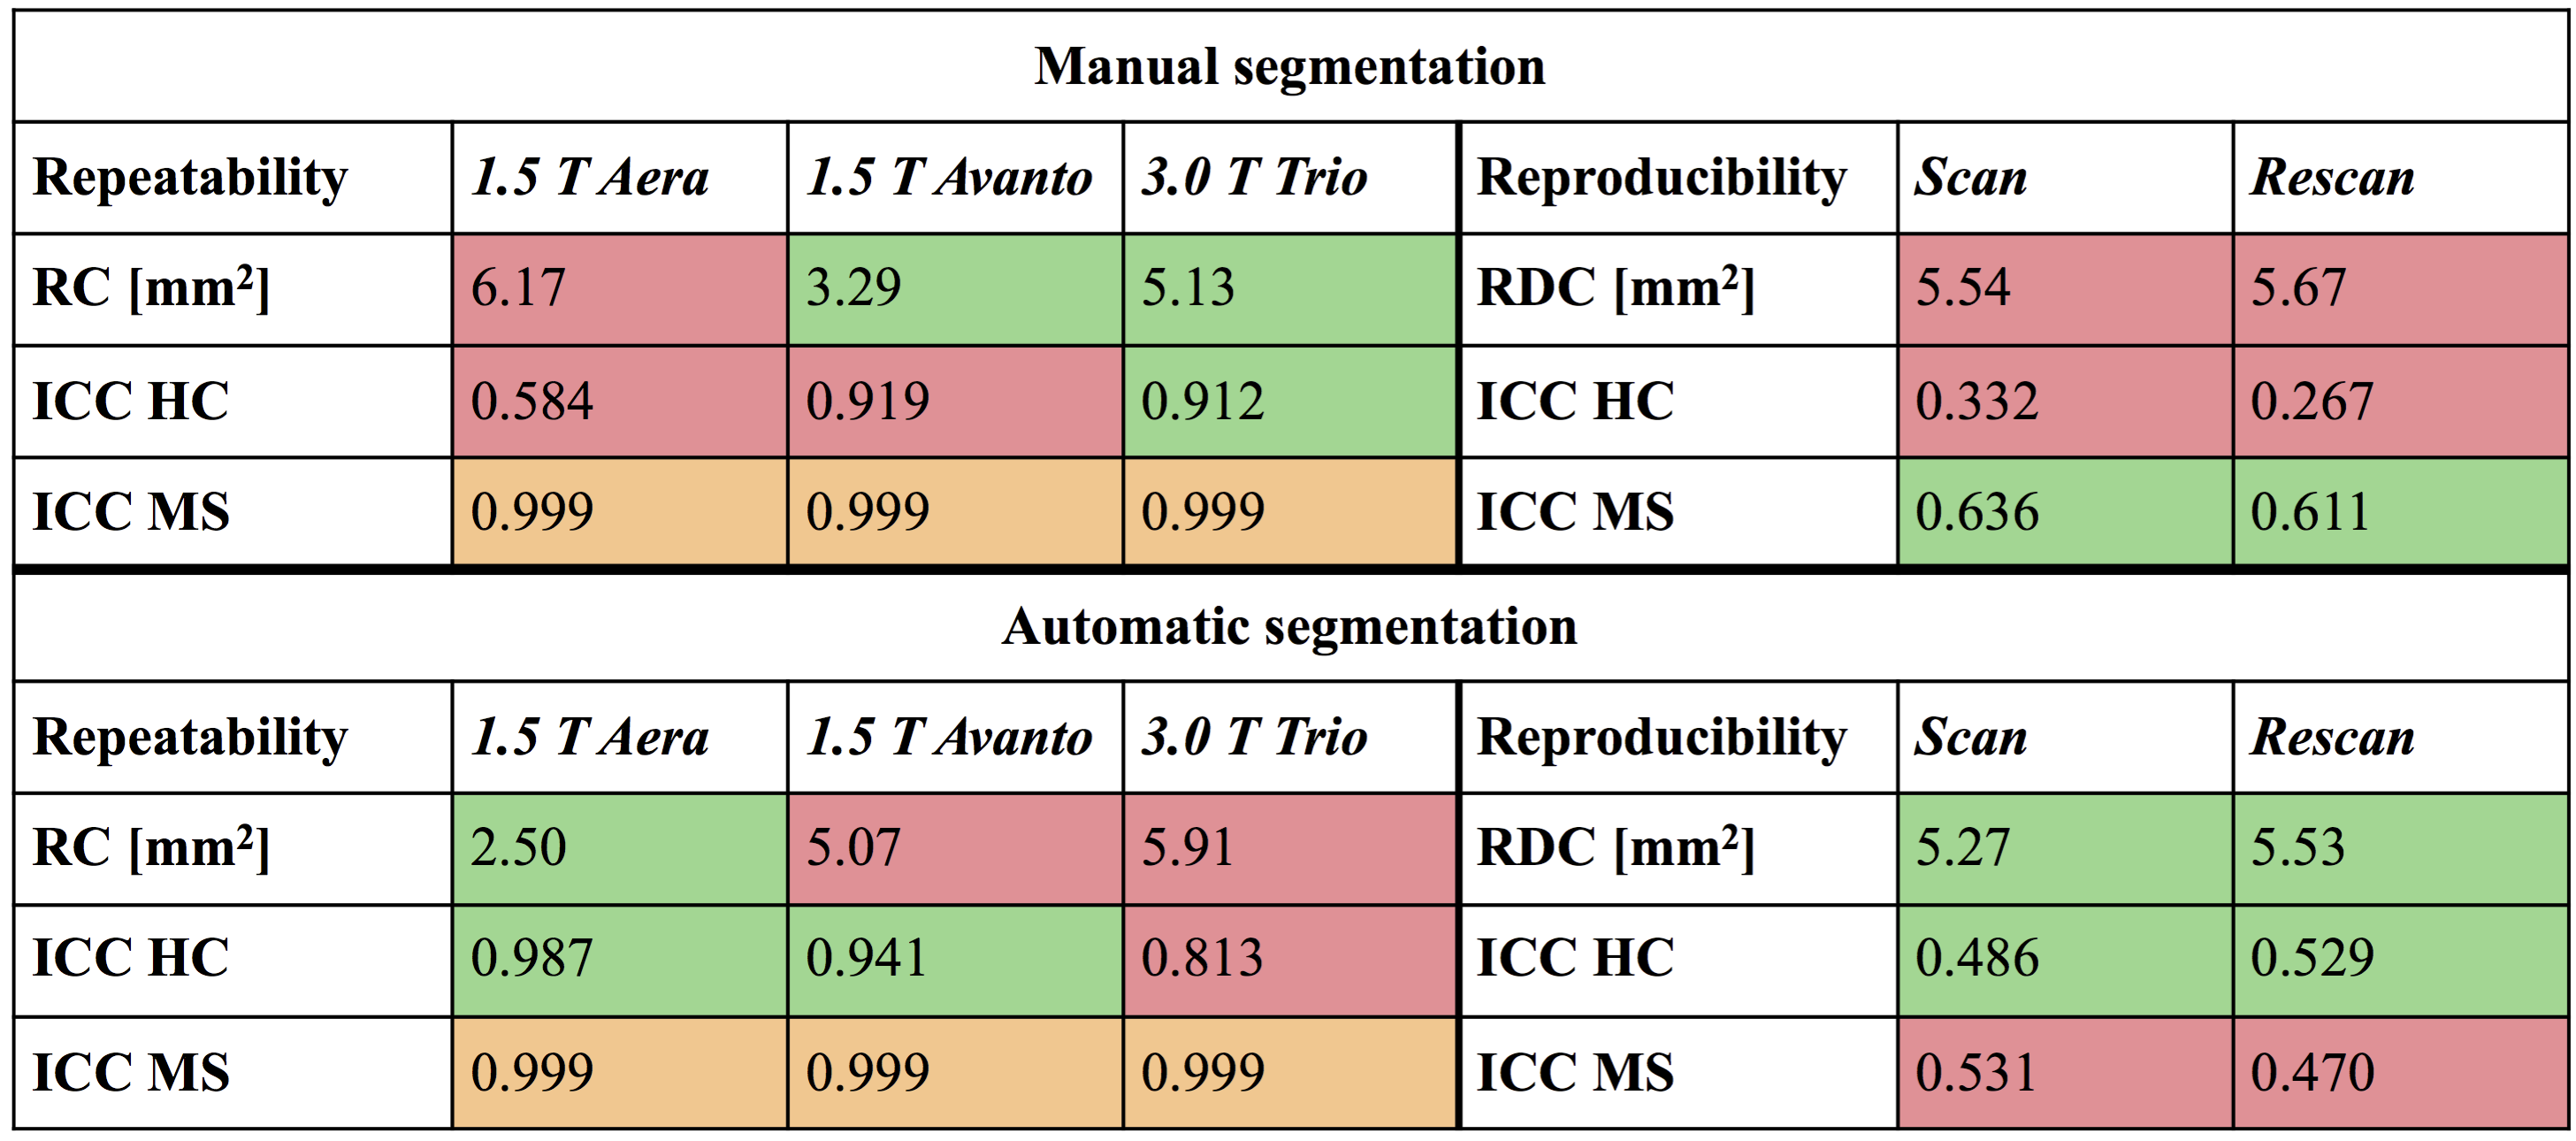
CSA measurements extracted with manual and automatic spinal cord segmentations are presented in Table 1. Significant statistical differences (paired t-tests, p<0.05) were found between field strengths for both manual and automatic CSA segmentations, while no significant differences were found between the two 1.5 T scanners. The results of the reproducibility and repeatability study are presented in Table 2. Figure 1 shows an example of segmentation, vertebral labeling and CSA measurements in an MS patient.Discussion and conclusions
The repeatability and reproducibility of cervical spinal cord CSA measurements performed by SCT were characterized. In concordance with Yiannakas et al.7, we showed high repeatability and reproducibility of CSA measurements using SCT. As suggested by Table 2, automatic CSA measurements are overall more repeatable and reproducible than manual segmentations (RC and RDC < 6 mm2). More particularly, repeatability ICCs showed that variability in measurements were mostly explained by variability within subjects/patients instead of measurement errors. As shown in Table 1, CSA measured on 1.5 T images were found to be significantly higher than CSA measured on 3.0 T images. This difference could be explained by a decrease of image SNR and increase of chemical shift (due to lower bandwidth) at 1.5 T compared to 3.0 T, therefore leading to mis-delineation of the spinal cord.
This study demonstrates the ability of semi-automated processing in SCT to quantify the spinal cord atrophy with high reproducibility and repeatability, opening the door to multi-center longitudinal studies of neurodegenerative diseases affecting the spinal cord. Future work will investigate automatic vertebral labeling in order to develop a fully automatic spinal cord CSA measurement pipeline.
Acknowledgements
This work was supported by the Canada Research Chair in Quantitative Magnetic Resonance Imaging, the Canadian Institute of Health Research [CIHR FDN-143263], the Fonds de Recherche du Québec - Santé [28826], the Fonds de Recherche du Québec - Nature et Technologies [2015-PR-182754], the Natural Sciences and Engineering Research Council of Canada [435897-2013], the Sensorimotor Rehabilitation Research Team (SMRRT), the Functional Neuroimaging Unit (CRIUGM, Université de Montréal), the MEDITIS scholarship program, the PBEEE scholarship program from the Fonds de Recherche du Québec - Nature et Technologies and the Quebec BioImaging Network. This research was also supported by the Stockholm City Council and Karolinska Institutet (ALF 20120213 and 20150166). Dr. Granberg is supported by the Swedish Society for Medical Research.References
1. De Leener B, Lévy S, Dupont SM, et al. SCT: Spinal Cord Toolbox, an open-source software for processing spinal cord MRI data. Neuroimage 2016. DOI: 10.1016/j.neuroimage.2016.10.009
2. Rocca MA, Horsfield MA, Sala S, et al. A multicenter assessment of cervical cord atrophy among MS clinical phenotypes. Neurology 2011;76(24):2096–2102.
3. De Leener B, Kadoury S, Cohen-Adad J. Robust, accurate and fast automatic segmentation of the spinal cord. Neuroimage 2014;98:528–536.
4. Polman CH, Reingold SC, Banwell B, et al. Diagnostic criteria for multiple sclerosis: 2010 revisions to the McDonald criteria. Ann. Neurol. 2011;69(2):292–302.
5. Lublin FD, Reingold SC, Cohen JA, et al. Defining the clinical course of multiple sclerosis: the 2013 revisions. Neurology 2014;83(3):278–286.
6. FMRI Biomarker Committee. Indices of Repeatability, Reproducibility, and Agreement [Internet]. Quantitative Imaging Biomarkers Alliance (QIBA); 2013.Available from: http://qibawiki.rsna.org/images/e/e3/FMRITechnicalPerformanceIndices042613.pdf
7. Yiannakas MC, Mustafa AM, De Leener B, et al. Fully automated segmentation of the cervical cord from T1-weighted MRI using PropSeg: Application to multiple sclerosis. Neuroimage Clin 2016;10:71–77.
Figures