0412
SPINAL CORD SODIUM AND AXONAL LOSS IN MULTIPLE SCLEROSIS1UCL Institute of Neurology, Queen Square MS Centre, University College London, London, United Kingdom, 2Translational Imaging Group, Centre for Medical Image Computing, Department of Medical Physics and Biomedical Engineering, University College London, London, United Kingdom, 3UCL Institute of Neurology, University College London, London, United Kingdom, 4Department of Brain and Behavioural Sciences, University of Pavia, Pavia, Italy, 5Brain MRI 3T Mondino Research Center, C. Mondino National Neurological Institute, Pavia, Italy
Synopsis
Increased sodium concentration in the normal appearing brain of multiple sclerosis (MS) patients has recently been reported, which may be a consequence of axonal loss or an accumulation of intracellular sodium. Here we investigated spinal cord total sodium concentrations in MS patients and healthy controls. Spinal cord atrophy, as a result of axonal loss, often presents in MS, therefore we also tested for the association of sodium with SC area. We found increased total sodium levels in the SC, but no correlation with the decrease in SC cross sectional area in the MS cohort.
Introduction
Previous studies have reported increased total sodium concentrations in the lesional brain and normal-appearing tissue in multiple sclerosis (MS) patients when compared with healthy controls1,2,3. Furthermore, an increase in sodium has been found to correlate with the severity of disease2,3, indicating sodium as a marker of disease progression. The spinal cord (SC) is also known to be involved in MS, and pilot studies indicate that SC sodium in MS patients may also be elevated4. For the first time we report on sodium in the SC of MS patients, together with measures of SC atrophy, to ascertain: a) if a significant difference in cervical SC sodium in relapsing-remitting MS (RRMS) patients exists and b) if a correlation between SC cross sectional area (CSA), a marker of axonal loss, and sodium exists in this cohort.Methods
12 healthy controls (HC, 31±7yrs, 4F ) and 14 RRMS patients (45±8yrs, 12F, EDSS range 1.5 to 5) were recruited. All participants gave informed written consent.
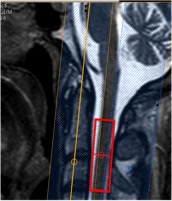
23Na-MRS: MRI scans were acquired on a 3T Achieva TX system (Philips Healthcare, Best). Sodium data were acquired using fixed tuned transmit-receive sodium coil (Rapid, Germany). Using the Q-Body coil 1H images were taken in the sagittal and coronal planes for MRS planning. Using ISIS (Image-Selected In Vivo Spectroscopy), a voxel (9x12x35mm3) centered on the C2-3 intervertebral disc was planned to measure sodium, TR=300ms, effective TE=0.26ms, n=800 (Figure-1). Saturation pulses were placed to extend over the edges of the voxel to suppress signal from CSF and bone5.
Immediately following this an identical 23Na-MRS scan was run on an external concentration reference containing 44.8mM 23Na for quantification.
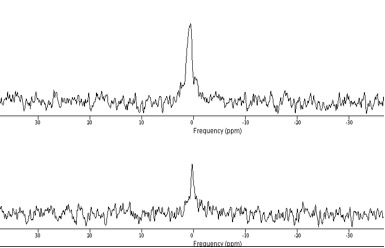
23Na Quantification: Data were processed using jMRUI, using first and second order phasing, apodisation=20Hz, and zerofilling=2048 (Figure-2). Signal amplitudes for volunteers and phantom were measured using the AMARES algorithm. Differences in the performance of the ISIS sequence due to differing T1s’ and T2s’ between phantom and tissue were also accounted for, using values from healthy brain tissue. The ratio of the two corrected signals was then used to quantify the sodium concentration for each volunteer6,7.
1H-MRI: 1H gradient echo images, covering the same area as the MRS voxel, were acquired using a 16-channel neurovascular coil for measurement of CSA. Images were acquired in the axial plane containing 10 contiguous slices, FOV=240x180mm2, TR=23ms, TE=5ms, flip angle α=7°, n=8 and 0.5x0.5x5mm3 resolution.
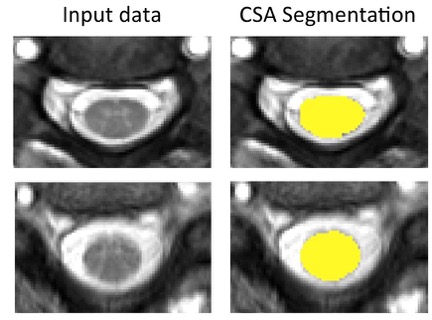
Measurement of CSA: CSA was computed automatically for each volunteer using a new SC segmentation algorithm8, which uses an external database of spinal cord images, and their associated segmentations, to fit the cord, providing a mask for each slice (Figure-3). These masks are then used to find the average CSA of the five slices covering the 23Na-MRS voxel.
Results
Differences:
Sodium was significantly increased in the RRMS cohort relative to HC (57±17mM and 39±9mM respectively, p<0.005). As expected, CSA was also significantly different, whereby the RRMS group presented a lower CSA (75±9mm2 relative to 82±7mm2 in controls, p<0.05).
Correlations between sodium and CSA:
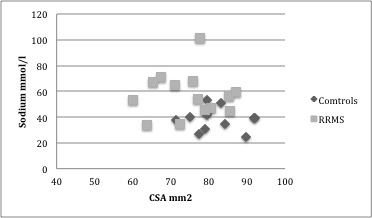
Overall no correlation was seen between sodium and CSA in this cohort (R=-0.2483, p=0.22). In the control group no correlation was present between CSA and sodium (R= -0.1184 , p= 0.7140) as was the case for the RRMS cohort (R= 0.0261, p= 0.9293, figure-4).
Discussion
We have successfully shown that the cervical SC has an increased total sodium concentration in RRMS. We have also shown that this increase does not correlate with the decrease in CSA, suggesting it is independent of spinal cord atrophy. A more detailed analysis would need to be performed taking into account lesion load within the MRS voxel, as this was variable over the patient group.
It should be noted the SC sodium concentrations reported here are higher than those reported previously in healthy controls using cardiac triggered 23Na-MRS7. Here the triggering was omitted to minimize scan time. It is possible cardiac and CSF pulsation in the cord is influencing our quantification in both groups. In addition to this a smaller voxel was also used, which could affect shim, SNR and partial volume effects.
Conclusion
Sodium MRS has shown that alterations of total sodium concentration in cervical spinal cord are present in RRMS patients, and are independent of cord atrophy. Further analysis looking into the association with clinical disability and lesion load will be carried out to ascertain the impact of lesions and normal appearing tissue independently. This is important in order to aid a better understanding of spinal cord pathology in MS.Acknowledgements
The MS Society in UK, NIHR BRC UCLH/UCL
High Impact Initiative (BW.mn.BRC10269)
EPSRC (EP/H046410/1,EP/J020990/1,EP/K005278)
MRC (MR/J01107X/1) and Brain Research Trust
CRDC fast track grant, UCLH charities (F185)
References
1) Inglese M, Madelin G, Oesingmann N, Babb JS, Wu W, Stoeckel B, Herbert J, Johnson G. Brain tissue sodium concentration in multiple sclerosis: a sodium imaging study at 3 tesla. Brain 2010;133:847-857.
2) Zaaraoui W, Konstandin S, Audoin B, Nagel AM, Rico A, Malikova I, Soulier E, Viout P, Confort-Gouny S, Cozzone PJ, Pelletier J, Schad LR, Ranjeva JP. Distribution of Brain Sodium Accumulation Correlates with Disability in Multiple Sclerosis: A Cross-sectional Na-23 MR Imaging Study. Radiology 2012;264(3):859-867.
3) Paling D, Solanky BS, Riemer F, Tozer DJ, Wheeler-Kingshott C A, Kapoor R, Golay X, Miller DH, Sodium accumulation is associated with disability and a progressive course in multiple sclerosis. Brain, 2013 Jul, 136(Pt7), 2305-17
4) Solanky BS, Riemer F, Golay X, Ciccarelli O. Wheeler-Kingshott, C A.M. Total Sodium Quantification of the Cervical Cord in Multiple Sclerosis, Proceedings 22nd ISMRM, 2014, program number 3381
5) Solanky BS, Riemer F, Golay X, Wheeler-Kingshott, C A.M., FUSS- Fast Ultrashort T2 Sensitive Sodium MRS of the Spinal Cord, Proceedings 21st ISMRM, program number 351
6) Riemer F, Solanky BS, Clemence M, Wheeler-Kingshott CAM, Golay X, Bi-Exponential 23Na T2* Components Analysis in the Human Brain ,Proc. 20th ISMRM, 2012, 2322
7) Solanky BS, Riemer F, Golay X, Wheeler-Kingshott CA, Sodium quantification in the spinal cord at 3T, Magnetic Resonance in Medicine, May 2013
8) Prados F, Cardoso MJ, Yiannakas MC, Hoy LR, Tebaldi E, Kearney H, Liechti MD, Miller DH, Ciccarelli O, Wheeler-Kingshot CAM, Ourselin S, Fully automated grey and white matter spinal cord segmentation, Scientific Reports, 2016
Figures