0410
Probing alterations of cellular metabolism and structure in CNTF-induced mouse model of astrocytic activation using in vivo MRS and diffusion-weighted MRS1Molecular Imaging Research Center (MIRCen), Commissariat à l'Energie Atomique (CEA), Fontenay aux Roses, France, 2UMS 27, INSERM, Fontenay aux Roses, France
Synopsis
In this work we use in vivo MRS and diffusion-weighted MRS (DW MRS) on a model of astrocytic activation induced by the ciliary neutrophic factor (CNTF) in mice striatum. We observe a massive metabolic remodeling in CNTF mice in comparison with control mice. We demonstrate the intrinsic potential of DW MRS to detect alterations in cellular structure by measuring substantial variations in diffusion properties of astrocytic and neuronal metabolites. Modeling suggests significantly larger astrocytic processes, consistently with astrocytic hypertrophy as observed by microscopy in the context of activation.
Purpose
Ciliary neurotrophic factor (CNTF) is known to be a neuroprotective agent and an activator of astrocytes. We use in vivo MRS and diffusion weighted MRS (DW-MRS) at various diffusion-weightings and diffusion times to detect alterations of cellular metabolic content and structure in mice overexpressing CNTF in the striatum. We report massive metabolic remodeling, as well as important changes in metabolites diffusion properties that we relate to structural modifications, in particular astrocytic hypertrophy associated with activation.Methods
Ten C57Bl/6 mice (8-week old) were co-injected bilaterally in the striatum with lentiviral vectors encoding GFP targeting astrocytes and with lentiviral vectors targeting neurons encoding either the human CNTF gene (5 animals) or the beta-galactosidase (LacZ) gene for control (5 animals). Mice were scanned using an 11.7 T Bruker scanner equipped with a cryoprobe. MRS and DW-MRS were acquired using our STE-LASER sequence1. A 56-mm3 voxel was positioned around the striatum (Fig.1A). Spectra were acquired at diffusion time td=53 ms up to very high b (50 ms/µm²) to be sensitive to short-range structure such as fiber radius2; and at longer td (from 103 to 2003 ms, at b=0 and 3 ms/µm²) to be sensitive to the long-range cellular structure3. Post-processing was performed as in1. Macromolecule spectra were acquired for each phenotype and included in the LCModel basis set. Metabolite concentrations were determined relative to tCr.Results
Metabolic alterations: Typical spectra are shown in Fig.1B-C, illustrating the striking metabolic remodeling. Significant decrease was observed for NAA (-33%) and glutamate (Glu) (-23%), and significant increase for Ins (+190%), choline compounds (+18%) and lactate (Lac) (+100%), which is consistent with a prior study on rats4. Interestingly macromolecule spectra are quite different between both types of mice, especially around 1.2 ppm. This might partly result from the larger amount of membranes required for hypertrophic astrocytes, particularly cholesterol.
Alterations of short-range structure: Signal attenuation as a function of b is stronger for Ins and tCho, usually considered as astrocytic metabolites, in CNTF mice (Fig.2). Modeling these data with an infinite cylinder model2 results in increased fiber radius for most metabolites, except for NAA and Glu which yield reduced radii (Fig.3). Free intracellular diffusion coefficient Dintra was estimated to be stable except for NAA (decrease from 0.38±0.04 to 0.34±0.03 µm²/ms, p=0.02).
Alterations of long-range structure: The apparent diffusion coefficient (ADC) as a function of td is generally quite similar between both groups, for most metabolites. Only Ins sets apart, with substantially higher ADC at longer td in CNTF mice (Fig.4). This difference suggests that Ins is diffusing in longer processes in CNTF mice. Modeling these data using the approach introduced in3 indeed yields more embranchments (from N=4±3 to N=5±3) and longer segments (from L=12±8 to L=33±8µm).
Discussion
Astrocytic activation is associated with astrocytic hypertrophy, although it is not always clear in the literature what is really changing (larger or longer fibers, alterations in complexity…). Increased estimated radius for some metabolites, in particular for Ins (+50%) as well as for tCho (+31%), which are thought to be astrocytic, is consistent with an increased radius of astrocytic processes. Interestingly, preliminary histological study of GFP-transduced astrocytes in one mouse of each phenotype (22 cells in each animal) using confocal microscopy (Fig.5) yielded a ~10% increased radius in CNTF mice (from 0.41±0.07 to 0.45±0.08 µm). It should be noted that, in terms of absolute values, modeling yields larger radii than microscopy. This overestimation might partly arise from small secondary structures (leaflets) leading to increased radial diffusivity, and from cell bodies, which might demand refined models. The decreased estimated radius for NAA and Glu, which are typically associated with neurons, suggests that axonal and dendritic radius may be reduced during activation.
Regarding alterations of long-range structure, preliminary analysis of confocal microscopy data indeed suggests the presence of some longer astrocytic processes. However it is unclear why only Ins (but not tCho) would be sensitive to these variations. It is conceivable that Ins and tCho are in different glial populations.
Conclusion
In this model of astrocytic activation, diffusion-weighted MRS revealed structural alterations, suggesting hypertrophic astrocytes (larger and longer fibers) and atrophied neurons (smaller fiber diameter). Beyond demonstrating the intrinsic potential of the method to monitor astrocytic activation, this work also casts some new light on the alteration of the biochemical profile during activation: the apparent variations in metabolic concentrations may rather be associated with variations in compartment volumes than with changes of local cytosolic concentrations, bigger compartments for tCho and Ins resulting in increased apparent concentrations, and smaller compartments for NAA and Glu resulting in decreased apparent concentrations.Acknowledgements
This work was funded by the European Research Council (grant #336331).References
1 Ligneul et al. Metabolite diffusion up to very high b in the mouse brain in vivo: revisiting the potential correlation between relaxation and diffusion properties. MRM 2016; doi: 10.1002/mrm.26217
2 Palombo et al. Modeling diffusion of intracellular metabolites in the mouse brain up to very high diffusion-weighting: diffusion in long fibers (almost) accounts for non-monoexponential attenuation. MRM 2016; doi: 10.1002/mrm.26548
3 Palombo et al. A new paradigm to assess brain cell morphology by diffusion-weighted MR spectroscopy in vivo. PNAS 2016; pii: 201504327
4 Carillo-de Sauvage et al. The neuroprotective agent CNTF decreases neuronal metabolites in the rat striatum: an in vivo multimodal magnetic resonance imaging study. JCBFM 2015; 35(6):917-2
Figures
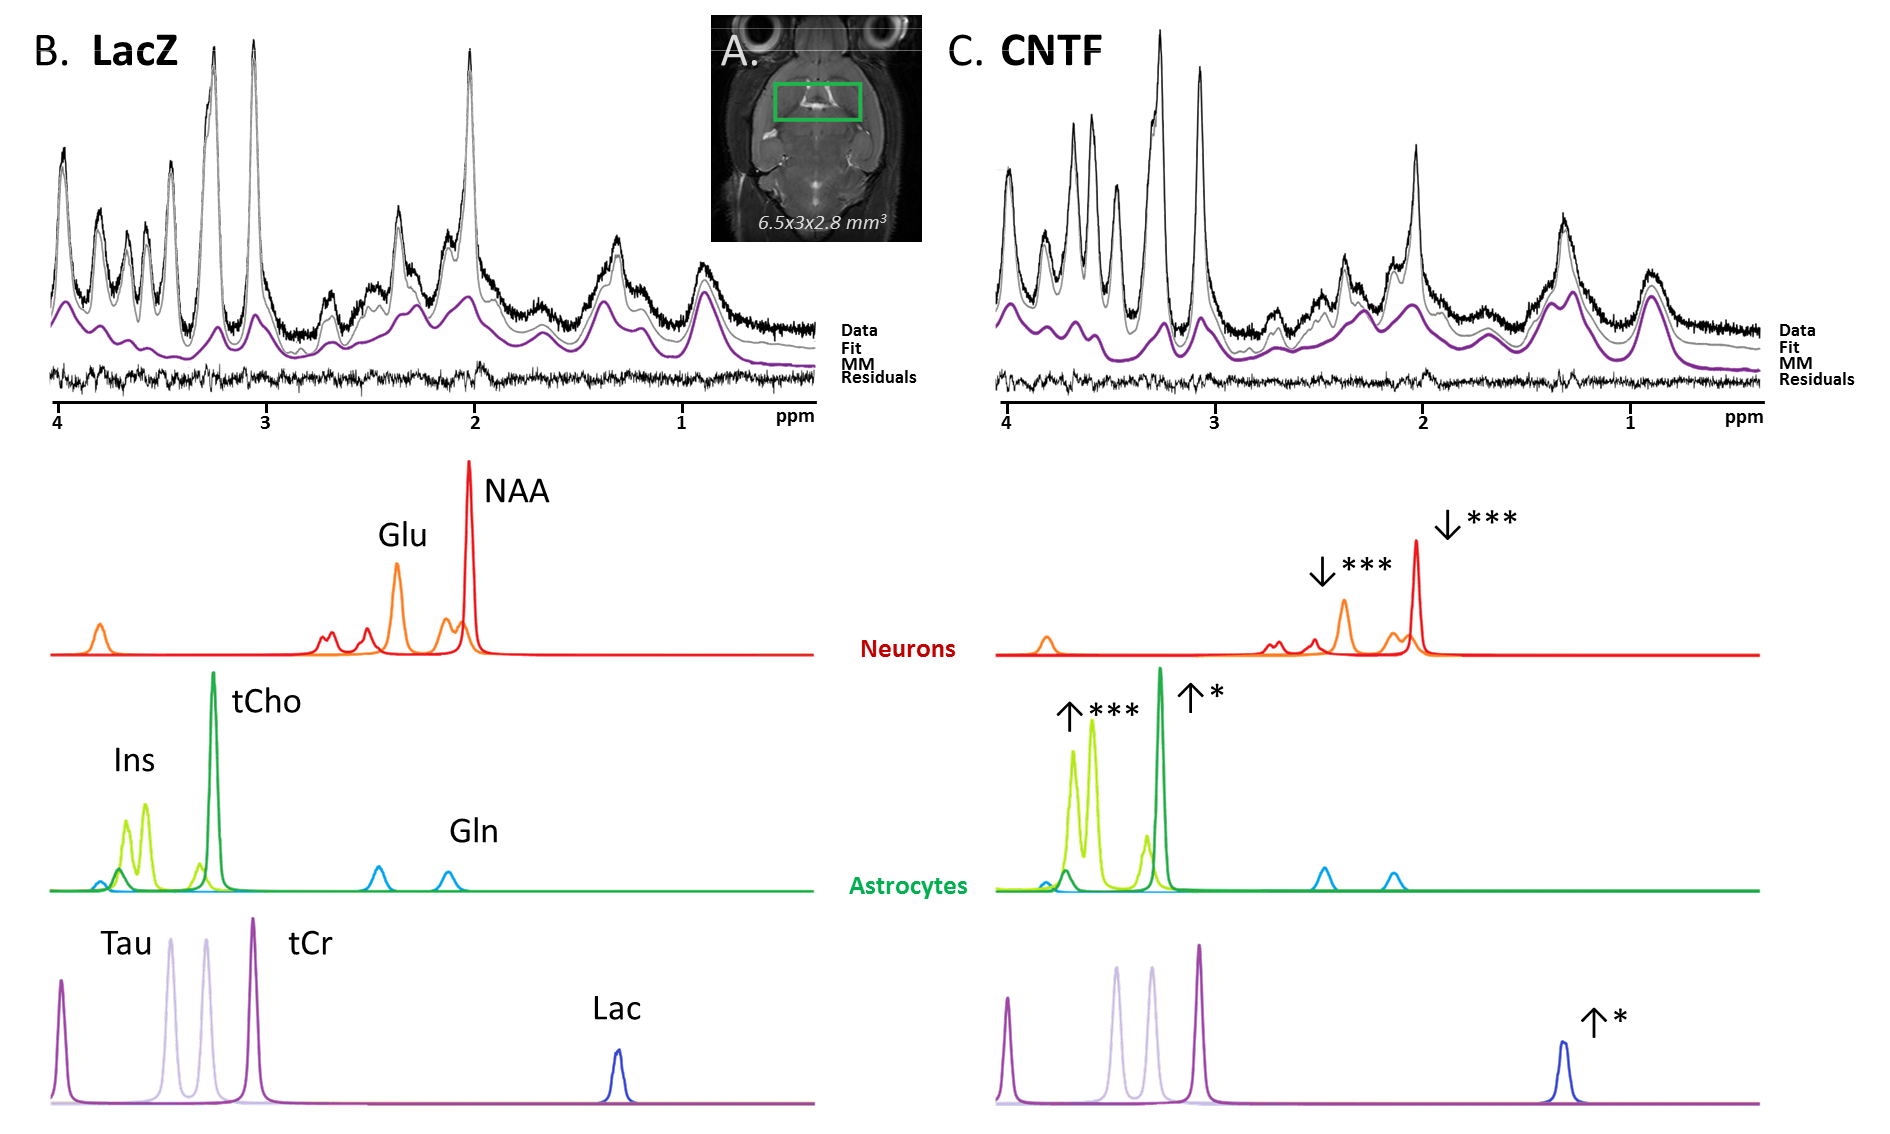
Figure 1:
The voxel (green rectangle) is located around the mouse striatum (A). Representative in vivo 1H-MRS spectra in LacZ mouse (B) and CNTF mouse (C) acquired at TM=50 ms (without diffusion-weighting). Spectral decomposition proposed by LCModel is shown for metabolites with CRLB<5%. Statistical significance (t-test): ***p-value<0.001, **p-value<0.01, *p-value<0.05.
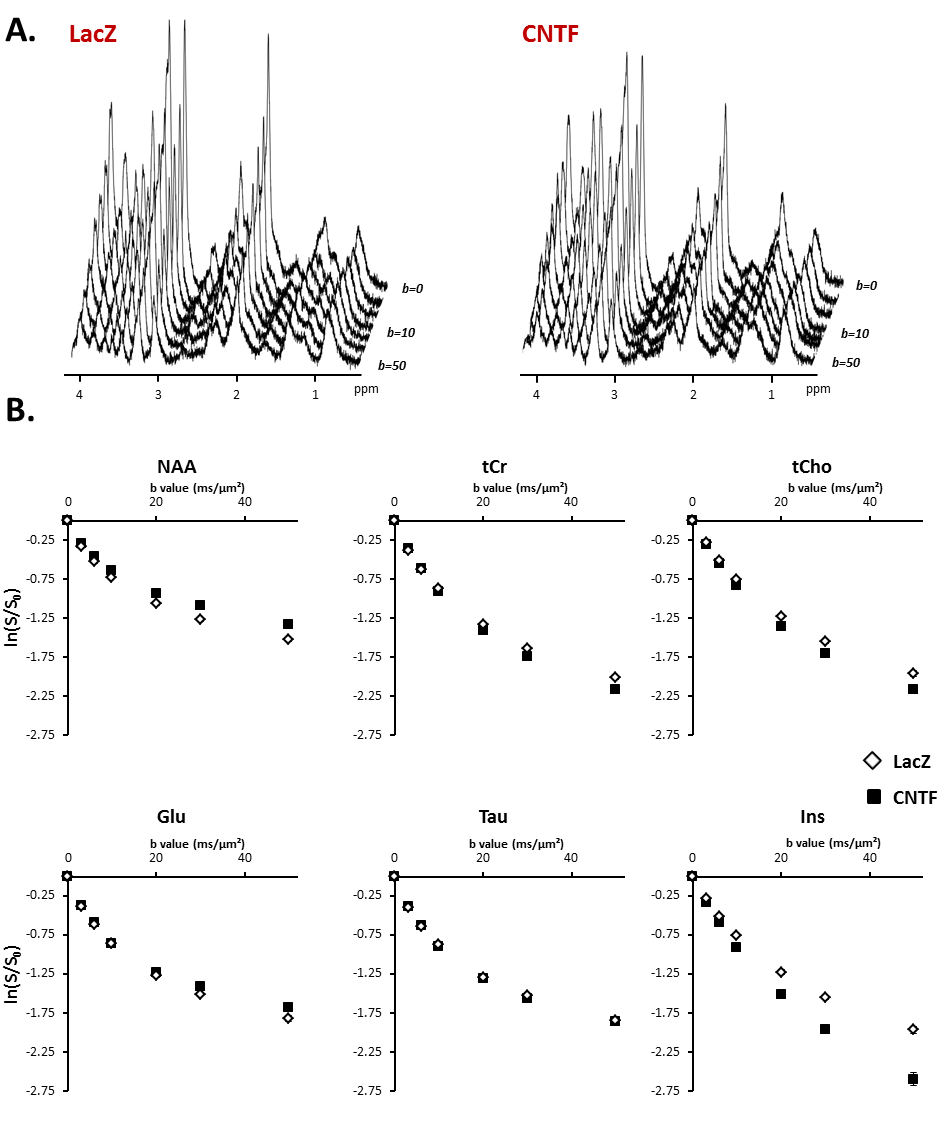
Figure 2:
A) Typical stack plot of spectra acquired for each group. Each stack plot is acquired in a single experimental session.
B) Logarithm of signal attenuation as a function of the diffusion-weighting b, averaged over the five mice of each group (each mice being scanned twice) for the six main metabolites. Error bars stand for standard errors of the mean (barely visible as they are very small).
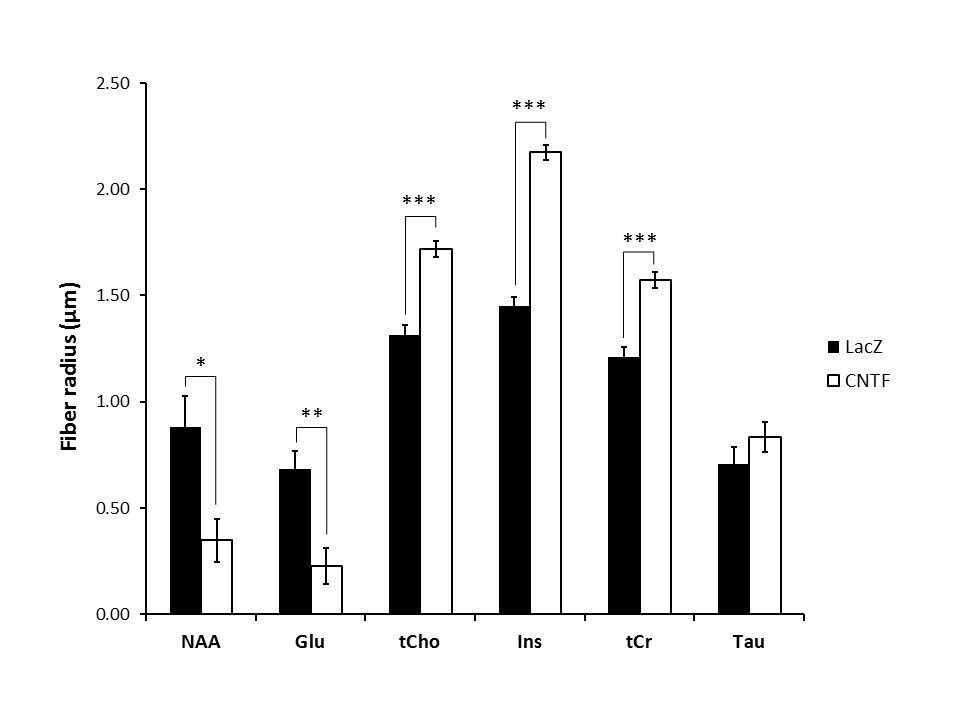
Figure 3:
Radii extracted from infinite cylinder neurite modeling applied on averaged logarithm signal attenuation as a function of b (Fig.2) for the six main metabolites. Statistical significance: ***p-value<0.001, **p-value<0.01, *p-value<0.05. For the modeling, p-values were obtained from permutation test on the Monte Carlo distributions.
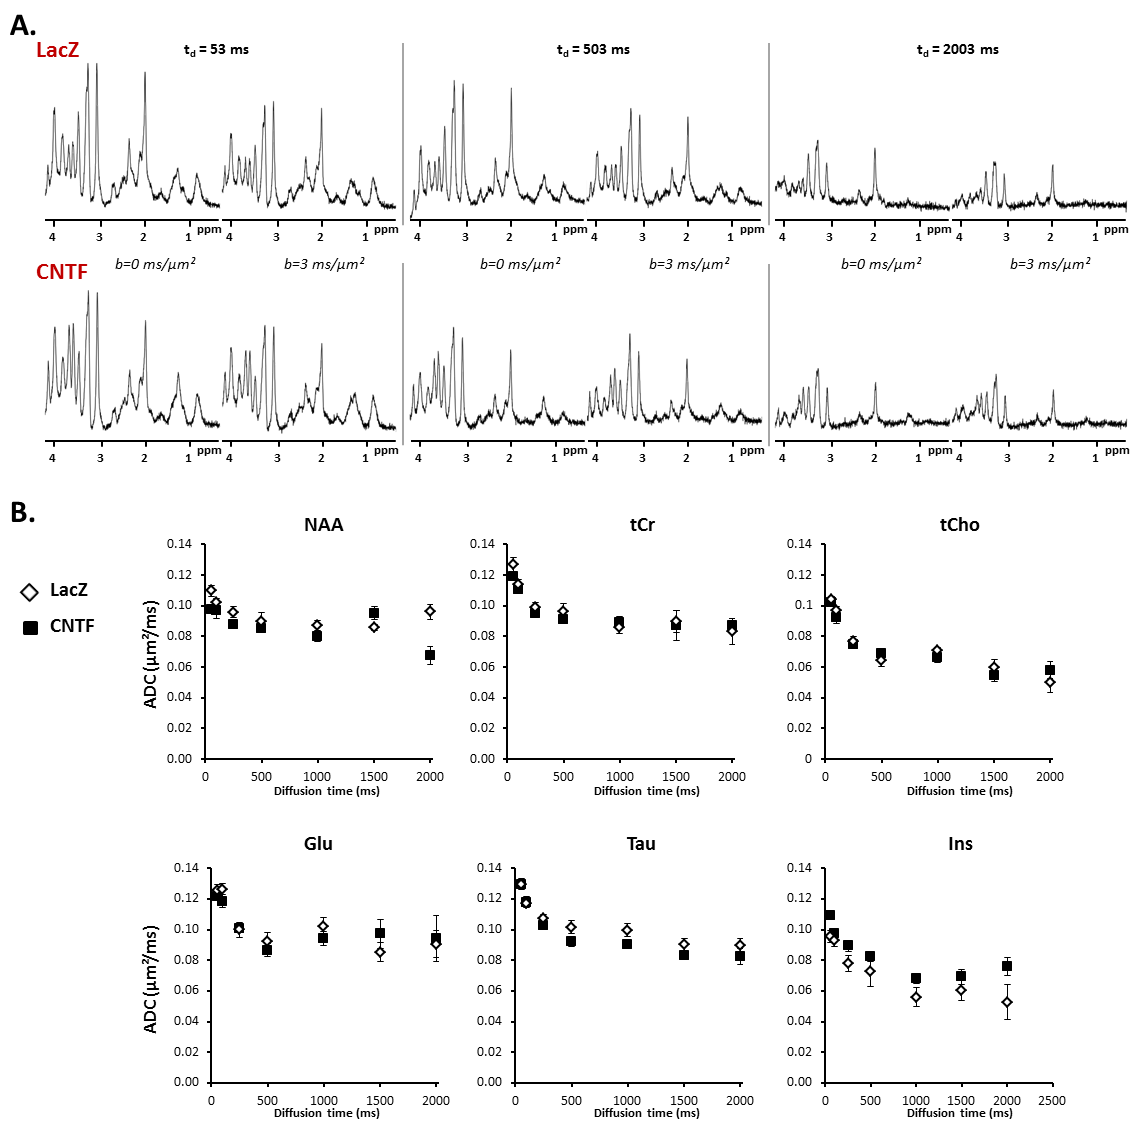
Figure 4:
A) Typical spectra acquired at different diffusion times for each group.
B) Apparent diffusion coefficient as a function of diffusion time, averaged over the five mice of each group (each mouse being scanned twice) for the six main metabolites. Error bars stand for standard errors of the mean.
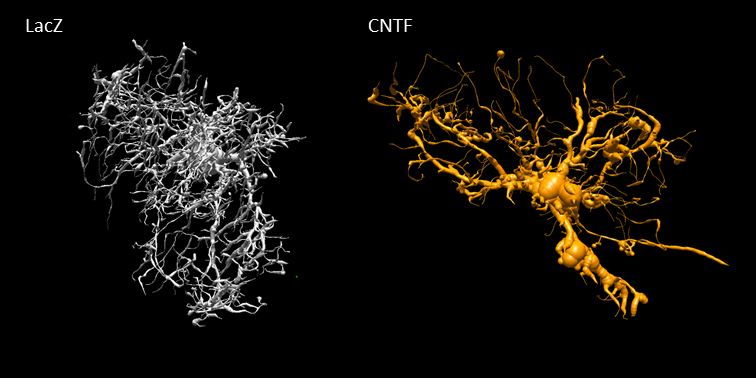
Figure 5:
Representative astrocytes reconstructed from confocal laser scanning microscopy of the GFP-expressing astrocytes in the striatal area of the mice injected with lentivirus for neuronal expression of CNTF or LacZ as control. An increase in the diameter and length of the main processes is visible in the context of CNTF-activated astrocytes.