0409
Diffusion-Weighted Echo Planar J-resolved Spectroscopic Imaging1Radiological Sciences, UCLA School of Medicine, Los Angeles, CA, United States, 2School of Nursing, UCLA School of Medicine, Los Angeles, CA, United States
Synopsis
Diffusion weighted spectroscopy enables investigation of brain intracellular microstructure in-vivo. Here we implemented a novel technique called diffusion-weighted echo-planar J-resolved spectroscopic imaging (DW-EPJRESI) which is capable of giving information about metabolite diffusivity beyond NAA, Cr and Cho in multiple brain locations simultaneously. The technique was evaluated in a brain phantom and four healthy volunteers. Highly reproducible diffusion-weighted metabolite maps were obtained. The ADC values were in good agreement with previous reported values. Further optimization of the DW-EPJRESI sequence will become more practical for clinical use.
Introduction:
As most of the metabolites detected by 1H-MRS are primarily located in the intracellular compartment of the brain, diffusion-weighted magnetic resonance spectroscopy (DW-MRS) offers excellent tools to investigate brain microstructure in-vivo1,2, specifically the intracellular response to cerebral injury3. The pathophysiological changes in human brain metabolite diffusivity have been studied for a range of diseases such as ischemia4, multiple sclerosis5, cancer4, encephalopathy, lactic acidosis, and stroke-like episodes syndrome6,7. Most of the DW-MRS studies based on SV8,9 and CSI10 primarily focused on high signal-to-noise ratio (SNR) and strong non-overlapping singlets such as the N-aceytlaspartate (NAA), creatine (Cr) and choline (Cho) although other metabolite such as myo-inositol (mI), GABA, glutamate (Glu), etc. are also of interest for different pathophysiology. 2D J-resolved spectroscopy (JPRESS)11,which takes advantage of the J-coupling interactions between protons of metabolites, can be used to quantify some of the resonances from low concentrated metabolites which overlap severely in traditional 1D spectroscopy. Our group has shown that more metabolites than conventional 1D MRS can be detected from multiple brain regions using 4D echo-planar J-resolved spectroscopic imaging (EP-JRESI)12 which combines the increased spectral dispersion offered by 2D JPRESS with the speed advantage of EPSI readout13,14. Here, we propose a novel technique called diffusion-weighted EP-JRESI (DW-EPJRESI). The purpose of this study is to demonstrate a pilot feasibility of recording DW-EJRESI in human brain to measure the apparent diffusion coefficients (ADCs) of metabolites apart from NAA, Cr and Cho in multiple regions at 3T.Materials and Methods:
The EP-JRESI sequence which uses a 90°–180°-Δt1-180° scheme for localization was modified by adding diffusion-sensitizing gradients (DSGs) prior to the first crusher and after the last crusher in the three orthogonal directions simultaneously with 10 ms duration $$$(\delta)$$$, 55 ms diffusion time $$$(\triangle)$$$ (Fig. 1). Outer volume suppression and global water suppression via WET15 were implemented. To examine the performance and reliability, brain phantom data were collected using DW-EPSI. Four healthy subjects (26-60 years) participated after giving institutionally reviewed informed consent. Data were collected on a 3T Prisma MRI scanner equipped with a 16-channel head ‘receive’ coils using the following parameters: TE=67ms, TR=2ms, 1.5x1.5x1.5 cm3 voxel for VOI localization, 512 bipolar echo pair, FOV=16x16 cm2, 1 averages, 64 t1 increment with $$$t_{\delta} $$$=1ms, and the spectral bandwidths were 1190(F2) and ±250(F1) Hz, respectively. A non-water-suppressed scan with 1 average was also recorded for eddy current correction and estimation of coil sensitivity. Data were acquired at two different b-factor values: 28 and 1065 s/mm2 with a total measurement time of about 70 min. To minimize fluctuations induced by cardiac pulsation, data were collected with cardiac gating with trigger delay of 240 ms. The signal post-processing of DW-EPJRESI data and spectral quantification based on peak integrals were performed using a custom MATLAB script. Apparent diffusion coefficients (ADCs) were estimated from mono exponential fits. For all TE steps to have equal diffusion-weighting, the amplitude of the DSGs were adjusted at each TE step16: $$ G_{i}=G_{1}\sqrt{\frac{\delta^{2}(\triangle-\frac{\delta}{3})+\zeta^{3}/30-\delta \zeta ^{2}/6}{\delta^{2}(\triangle-\frac{\delta}{3}+kt_{\delta})+\zeta^{3}/30-\delta \zeta ^{2}/6}}$$ where $$$G_{i}$$$ is the amplitude of the DSG at the kth TE step, $$$\zeta $$$ is the rise time.Results:
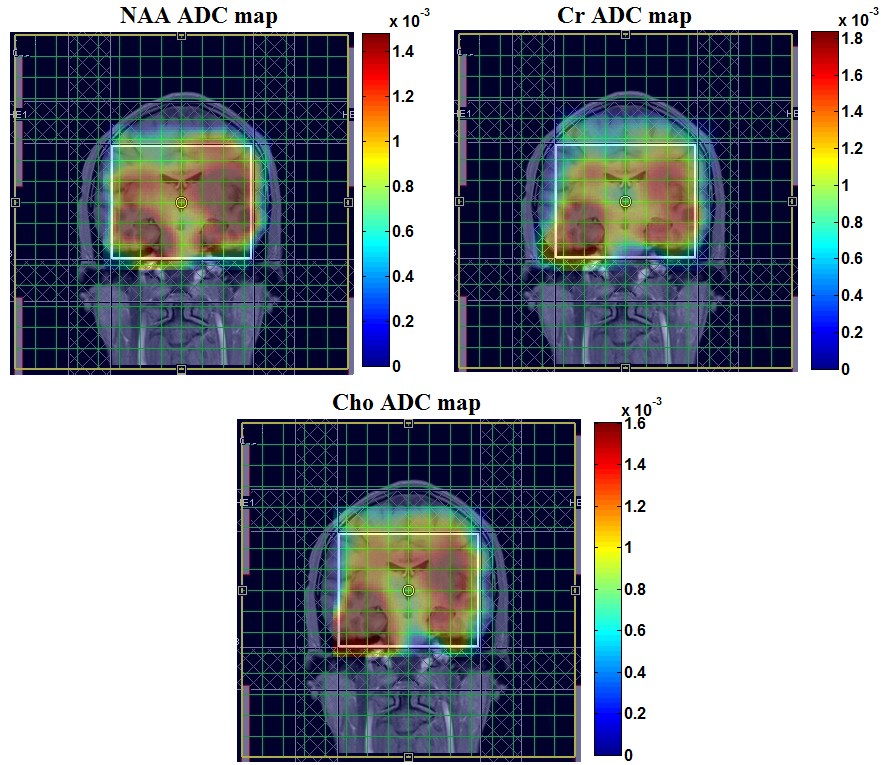
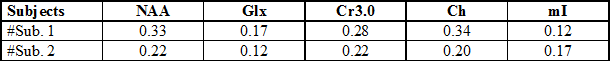
Fig. 2(a) and (b) show the spatial distribution of the ADC map of NAA, Cr and Cho for the DW-EPJRESI data of the brain phantom. Fig. 2(d) and 2(e) show extracted 2D spectra from a voxel. Table 1 shows the measured ADC values for the metabolites in the brain phantom and are in good agreement with previous studies9,10. Fig. 3 shows typical in vivo ADC maps for NAA, Cr and Cho. Table 2 list the ADCs estimated for two healthy volunteers. The values are in line with reported values9,10,17.Discussion:
The purpose of this study was to evaluate the feasibility and applicability of a novel DW-EPJRESI sequence in human brain at 3T. It allows us to measure diffusivity of non-water molecules such as metabolites other than the three (NAA, Cr, Cho) described by the 1D DW-MRS sequences in a single scan from multiple brain regions. It is to be noted that the present work does not provide rotationally invariant estimates of ADCs as DSGs are applied only in a single direction. One of the main limitations of the sequence is the long scan time which we hope to address in future by implementing acceleration technique like sensitivity encoding18, compressed sensing19,20 or encoding scheme like concentric circles21.Conclusion:
We demonstrated the implementation of a novel DW-MRS technique in human brain at 3T. Further technical development will make the sequence applicable in clinical studies and may provide insight into the intracellular metabolism of more metabolites the usual ones.Acknowledgements
This research was supported by NINDS 1R21-NS090956References
1. Ronen I, Valette J. Diffusion-weighted magnetic resonance spectroscopy. eMagRes 2015;4:733–750.
2. van der Toorn A, Dijkhuizen RM, Tulleken CA, Nicolay K. Diffusion of metabolites in normal and ischemic rat brain measured by localized 1H MRS. Magn Reson Med. 1996;36(6):914–922.
3. Nicolay K, Braun KP, Graaf RA, et al. Diffusion NMR spectroscopy. NMR Biomed. 2001;14(2):94–111.
4. Harada M, Uno M, Hong F, et al. Diffusion-weighted in vivo localized proton MR spectroscopy of human cerebral ischemia and tumor. NMR Biomed. 2002;15(1):69–74.
5. Wood ET, Ronen I, Techawiboonwong A, et al. Investigating axonal damage in multiple sclerosis by diffusion tensor spectroscopy. J Neurosci. 2012;32(19):6665–6669.
6. Colvin DC, Yankeelov TE, Does MD, et al. New insights into tumor microstructure using temporal diffusion spectroscopy. Cancer Res. 2008;68(14):5941–5947.
7. Liu Z, Zheng D, Wang X, et al. Apparent diffusion coefficients of metabolites in patients with MELAS using diffusion-weighted MR spectroscopy. AJNR Am J Neuroradiol. 2011;32(5):898–902.
8. Posse S, Cuenod CA, Le Bihan D. Human brain: proton diffusion MR spectroscopy. Radiology. 1993;188:719–725.
9. Kan HE, Techawiboonwong A, van Osch MJ, et al. Differences in apparent diffusion coefficients of brain metabolites between grey and white matter in the human brain measured at 7 T. Magn Reson Med. 2012;67:1203–1209.
10. Ercan AE, Techawiboonwong A, Versluis MJ, et al. Diffusion-weighted chemical shift imaging of human brain metabolites at 7T. Magn Reson Med. 2014;73:2053–2061.
11. Ryner LN, Sorenson JA, Thomas MA. Localized 2D J-resolved 1H MR spectroscopy: strong coupling effects in vitro and in vivo. Magn Reson Imaging 1995;13:853–869.
12. Thomas MA, Nagarajan R, Huda A, et al. Multidimensional MR spectroscopic imaging of prostate cancer in vivo. NMR Biomed. 2014;27:53–66.
13. Mansfield P. Spatial mapping of the chemical shift in NMR. Magn Reson Med. 1984;1(3):370–786.
14. Posse S, Tedeschi G, Risinger R, et al. High speed 1H spectroscopic imaging in human brain by echo planar spatial-spectral encoding. Magn Reson Med. 1995;33(1):34–40.
15. Ogg RJ, Kingsley PB, Taylor JS.WET, a T1- and B1-insensitive water-suppression method for in vivo localized 1H NMR spectroscopy.J Magn Reson B. 1994;104(1):1-10.
16. Landheer K, Schulte R, Geraghty B, et al. Diffusion-weighted J-resolved spectroscopy. Magn Reson Med. 2016. [Epub ahead of print]
17. Zheng DD, Liu ZH, Fang J, et al. The effect of age and cerebral ischemia on diffusion-weighted proton MR spectroscopy of the human brain. AJNR Am J Neuroradiol. 2012;33(3):563-8.
18. Lin FH, Tsai SY, Otazo R, et al. Sensitivity-encoded (SENSE) proton echo-planar spectroscopic imaging (PEPSI) in the human brain. Magn Reson Med. 2007;57(2):249-257.
19. Furuyama JK, Wilson NW, Burns BL, et al. Application of compressed sensing to multidimensional spectroscopic imaging in human prostate. Magn Reson Med. 2012;67(6):1499–1505.
20. Sarma MK, Nagarajan R, Macey PM, et al. Accelerated echo-planar J-resolved spectroscopic imaging in the human brain using compressed sensing: a pilot validation in obstructive sleep apnea. AJNR Am J Neuroradiol. 2014;35:S81-89.
21. Furuyama JK, Wilson NE, Thomas MA. Spectroscopic imaging using concentrically circular echo-planar trajectories in vivo. Magn Reson Med. 2012 Jun;67(6):1515-22.
Figures
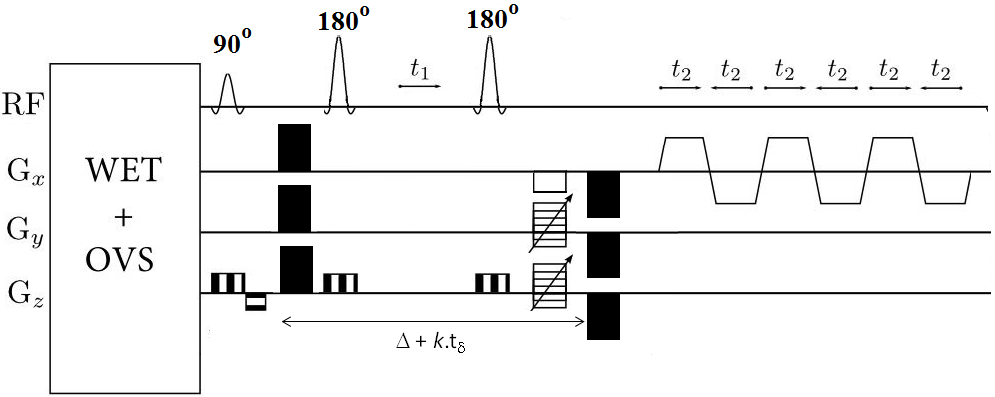
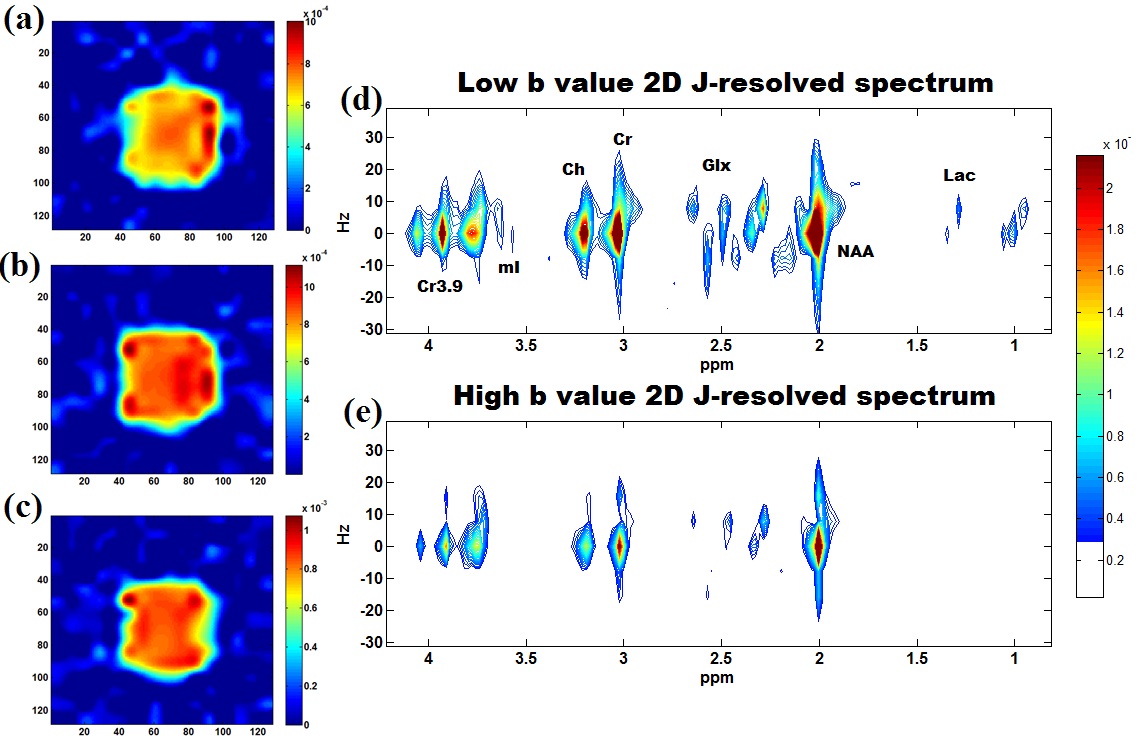
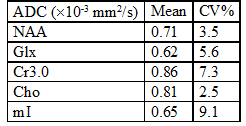
Table 1: ADC Estimates Obtained from the brain phantom for the DW-EPJRESI. CV= Coefficient of variation. The metabolite CVs are small ensuring the reliability of the sequence.