0408
Apparent diffusion coefficients of the five major metabolites in the human brain at 3 T1CMRR, University of Minnesota, Minneapolis, MN, United States
Synopsis
The goal of this study was to measure the apparent diffusion coefficients (ADC) of five main metabolites in the human brain at 3 T using PRESS and STEAM sequences where measurement biases due to cross-terms were avoided by using positive and negative diffusion gradient polarity. This study shows that comparable trace/3 ADC values for total N-acetyl aspartate, total creatine, total choline, glutamate and myo-inositol can be successfully measured with both acquisition methods on a clinical scanner with STEAM providing slightly better quantification precision for J-coupled metabolites.
Purpose
Diffusion-weighted magnetic resonance spectroscopy (DW-MRS) is a unique, noninvasive tool which allows the investigation of the intracellular microenvironment in the brain in vivo. Previous DW-MRS studies have reported the apparent diffusion coefficients (ADC) of tNAA, tCr and tCho in human and animal brains1-4. Interestingly, the ADC of glutamate (Glu) has only been measured in the human brain at 7 T while the ADC of both Glu and myo-inositol (Ins) were measured in animal brains at ultra-high fields3-5. Recently the ADC of Glu and Ins were also determined at 3 T6, however in this study, the cross-term effects for all applied gradients were not taken into account which could lead to inaccurate ADC estimations7. The aims of this study were therefore to measure the ADC of tCr, tCho, tNAA, Glu and Ins in the human brain on a clinical 3 T scanner using both PRESS and STEAM sequences where DW spectra were acquired with positive and negative diffusion gradient polarity to minimize cross-terms and to compare the sensitivity (in terms of CRLB and SNR) of both acquisition techniques.Methods
5 healthy subjects (24 ± 3 years) were scanned on a Siemens 3 T scanner after giving informed consent approved by the IRB. Body coil was used for excitation while the 32-channel receive-only head-coil was used for signal reception. A VOI of 25×25×25 mm3 was positioned in the prefrontal cortex (64% gray matter, 23% white matter, 13% cerebrospinal fluid) using T1-weighted MPRAGE images. B0 shimming was achieved using system 3D-GRE shim (Brain shim mode). Localized spectra were acquired using both STEAM (TE/TM/TR = 21.22/105/3000 ms) and PRESS (TE/TR = 54.2/3000 ms) sequences. VAPOR scheme interleaved with OVS pulses was used in both sequences. Diffusion weighting was applied using bipolar gradients in three orthogonal directions ([1,1,-0.5], [1,1,-0.5], and [-0.5,1,1]). To remove cross-term effects between all applied gradients, additional spectra were acquired with diffusion gradients of opposite polarity for each gradient direction. Data were acquired at two b-values; a null b-value (16 averages) and a high nominal b-value (48 averages) of 3172 s/mm2 in STEAM and 2204 s/mm2 in PRESS. Water reference scans at both b-values were also acquired for eddy-current correction. The total acquisition time was approximately 16 minutes for one diffusion dataset.
All spectra were processed in Matlab: eddy current effect was first corrected followed by single-shot frequency and phase corrections. Spectra, at null b-value and for all six gradient diffusion directions, were summed separately and analyzed with LCModel using simulated basis sets and measured macromolecule spectra. ADC for tCr, tCho, tNAA, Glu, Ins and water were calculated as previously reported7.
Results and Discussion
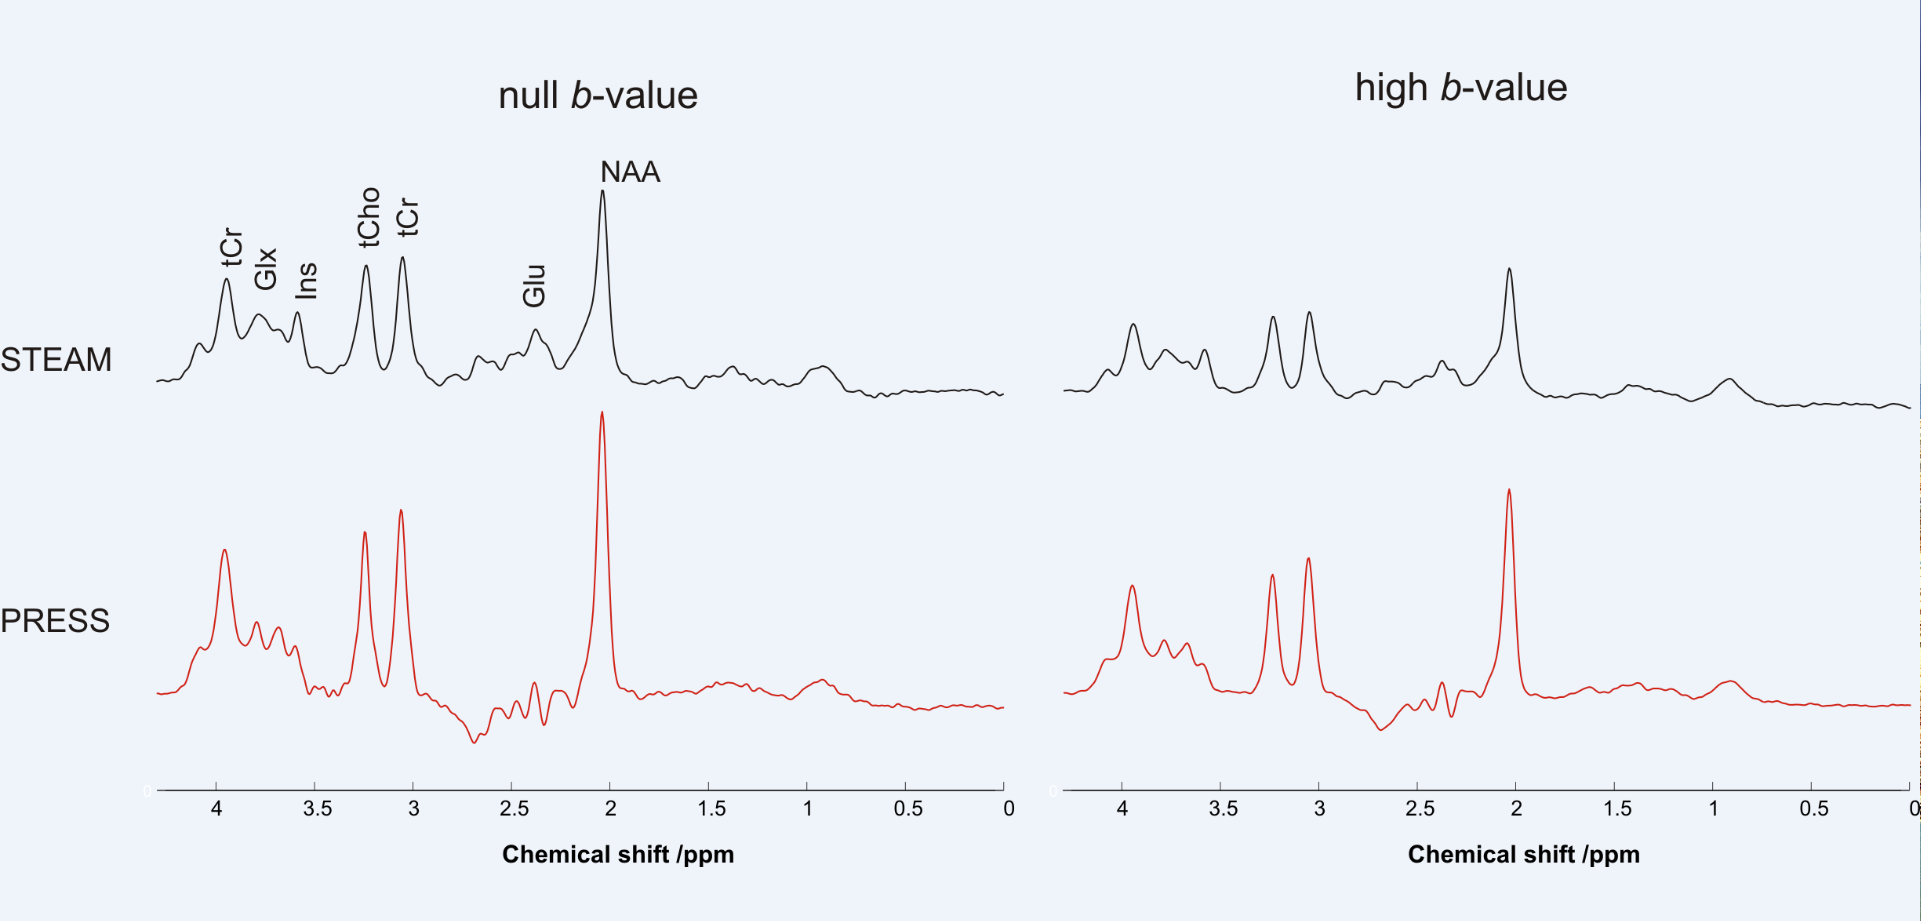
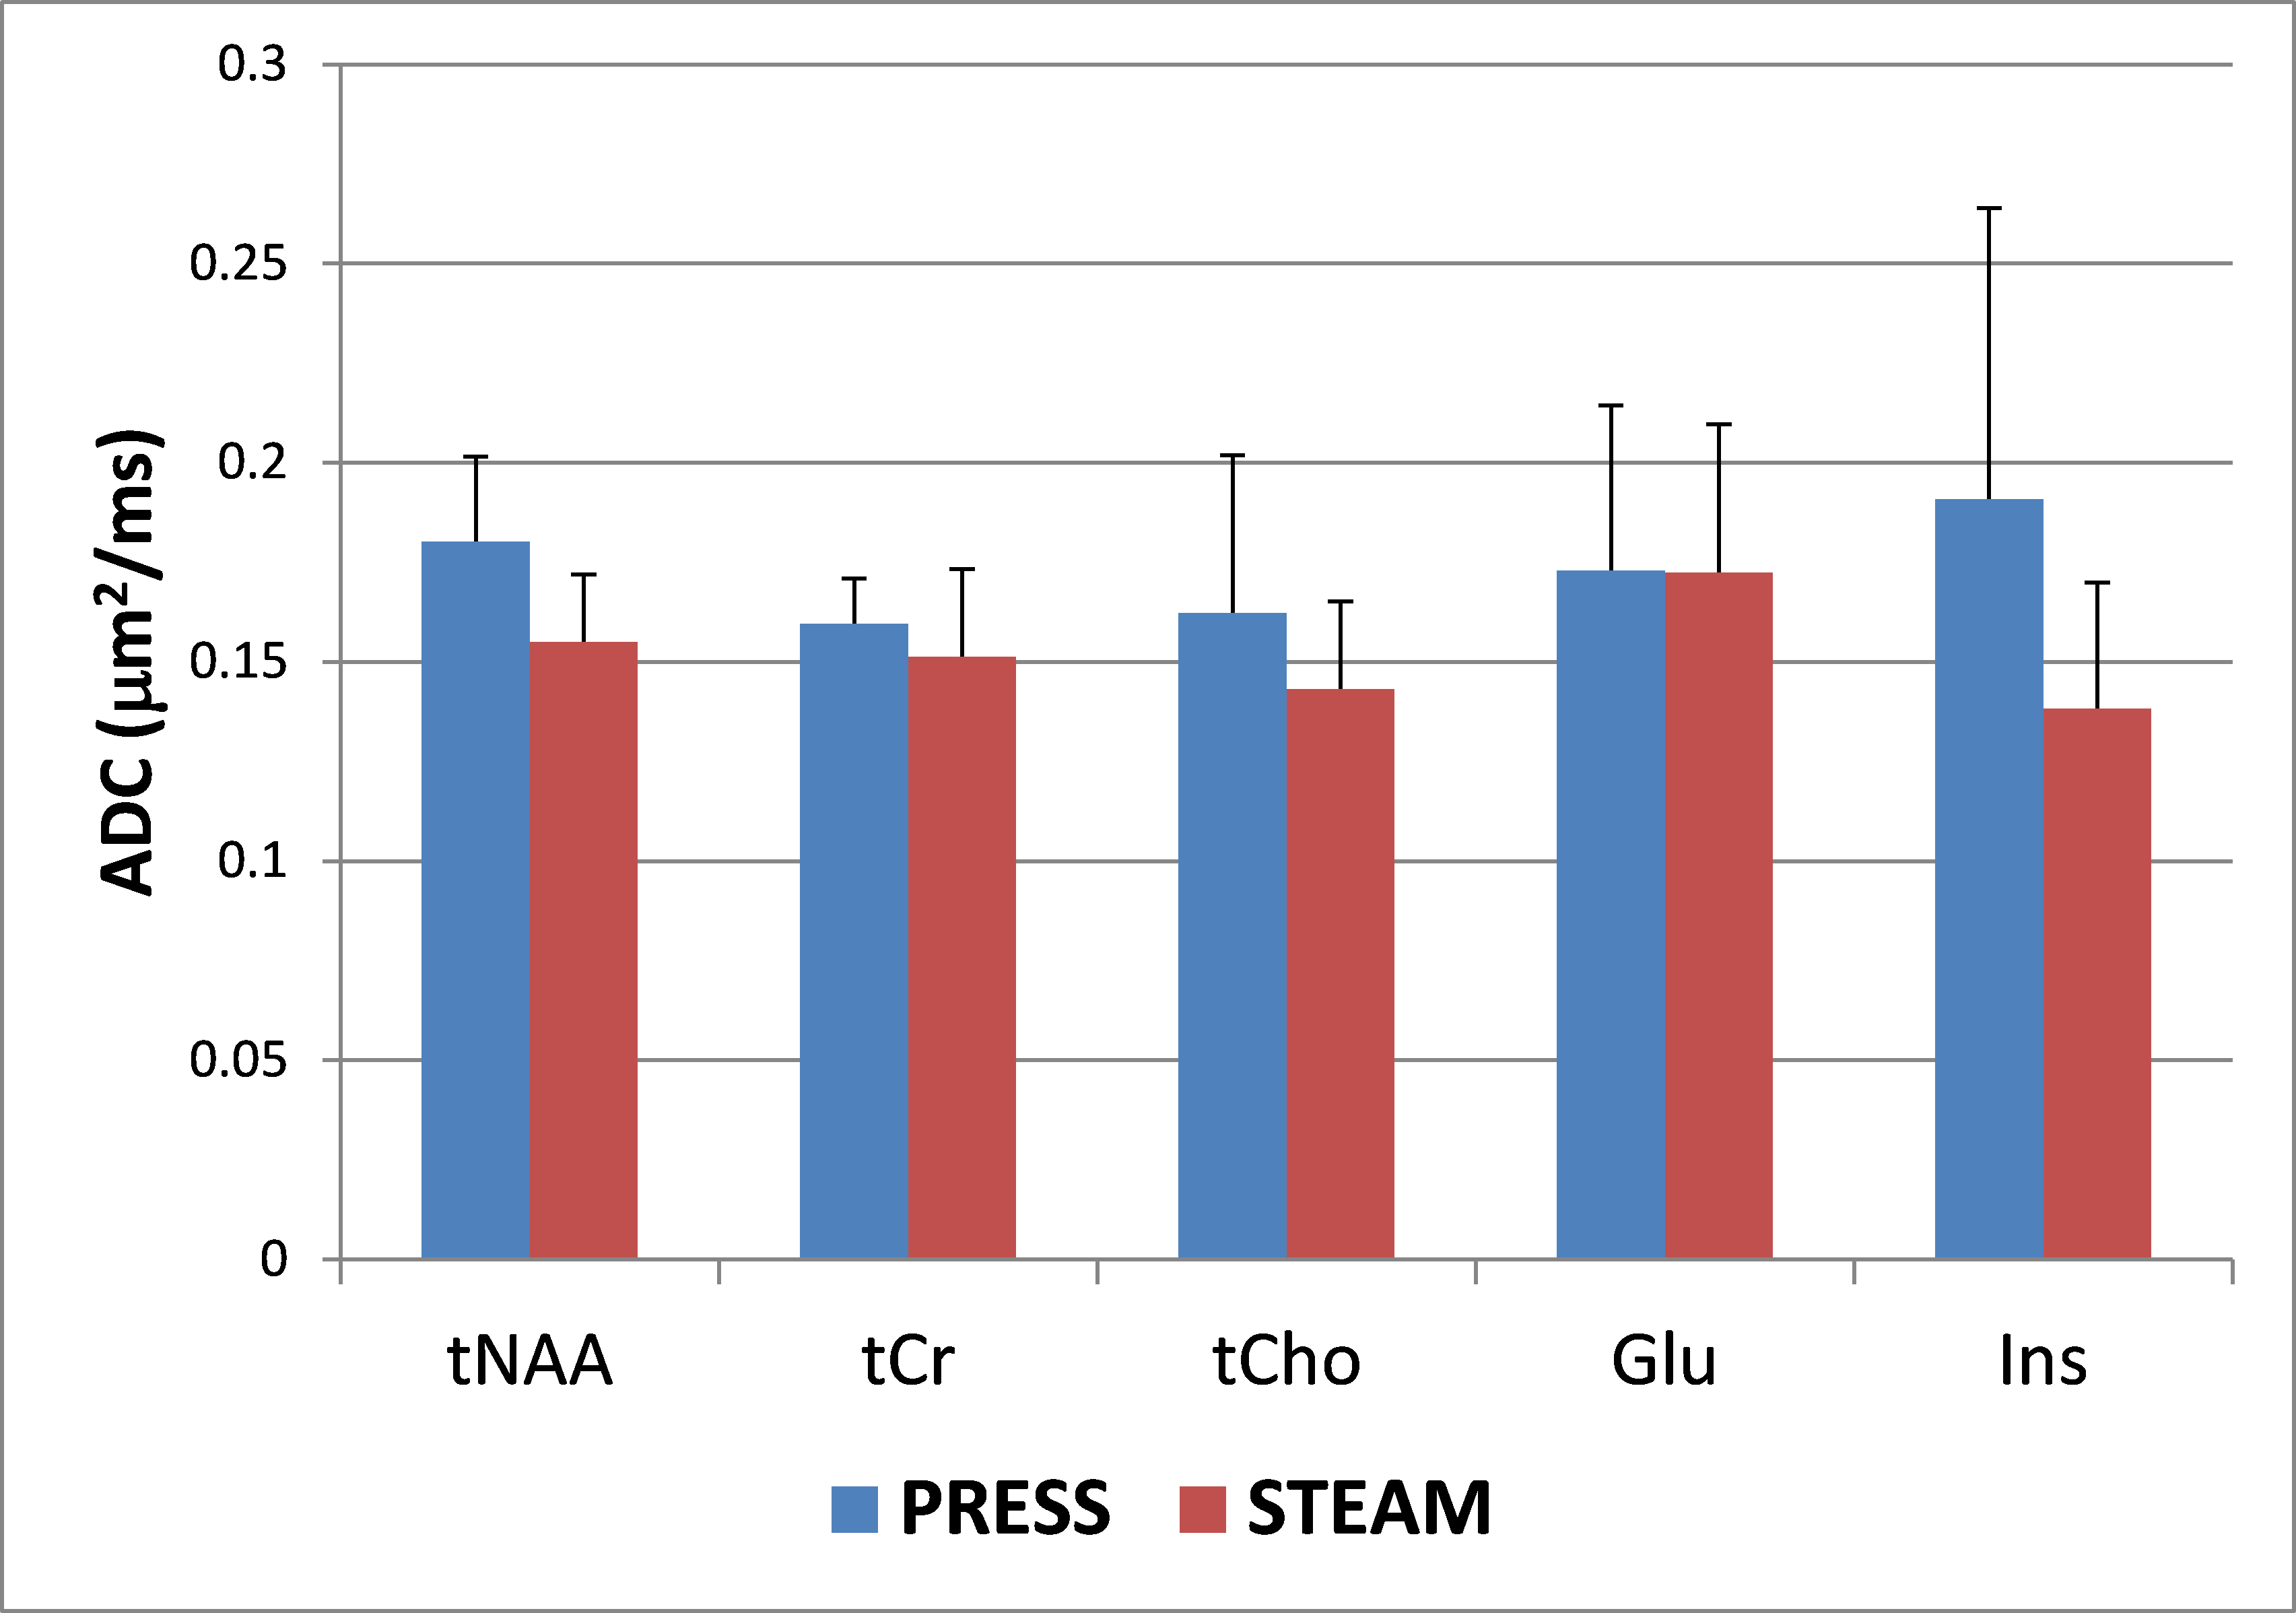
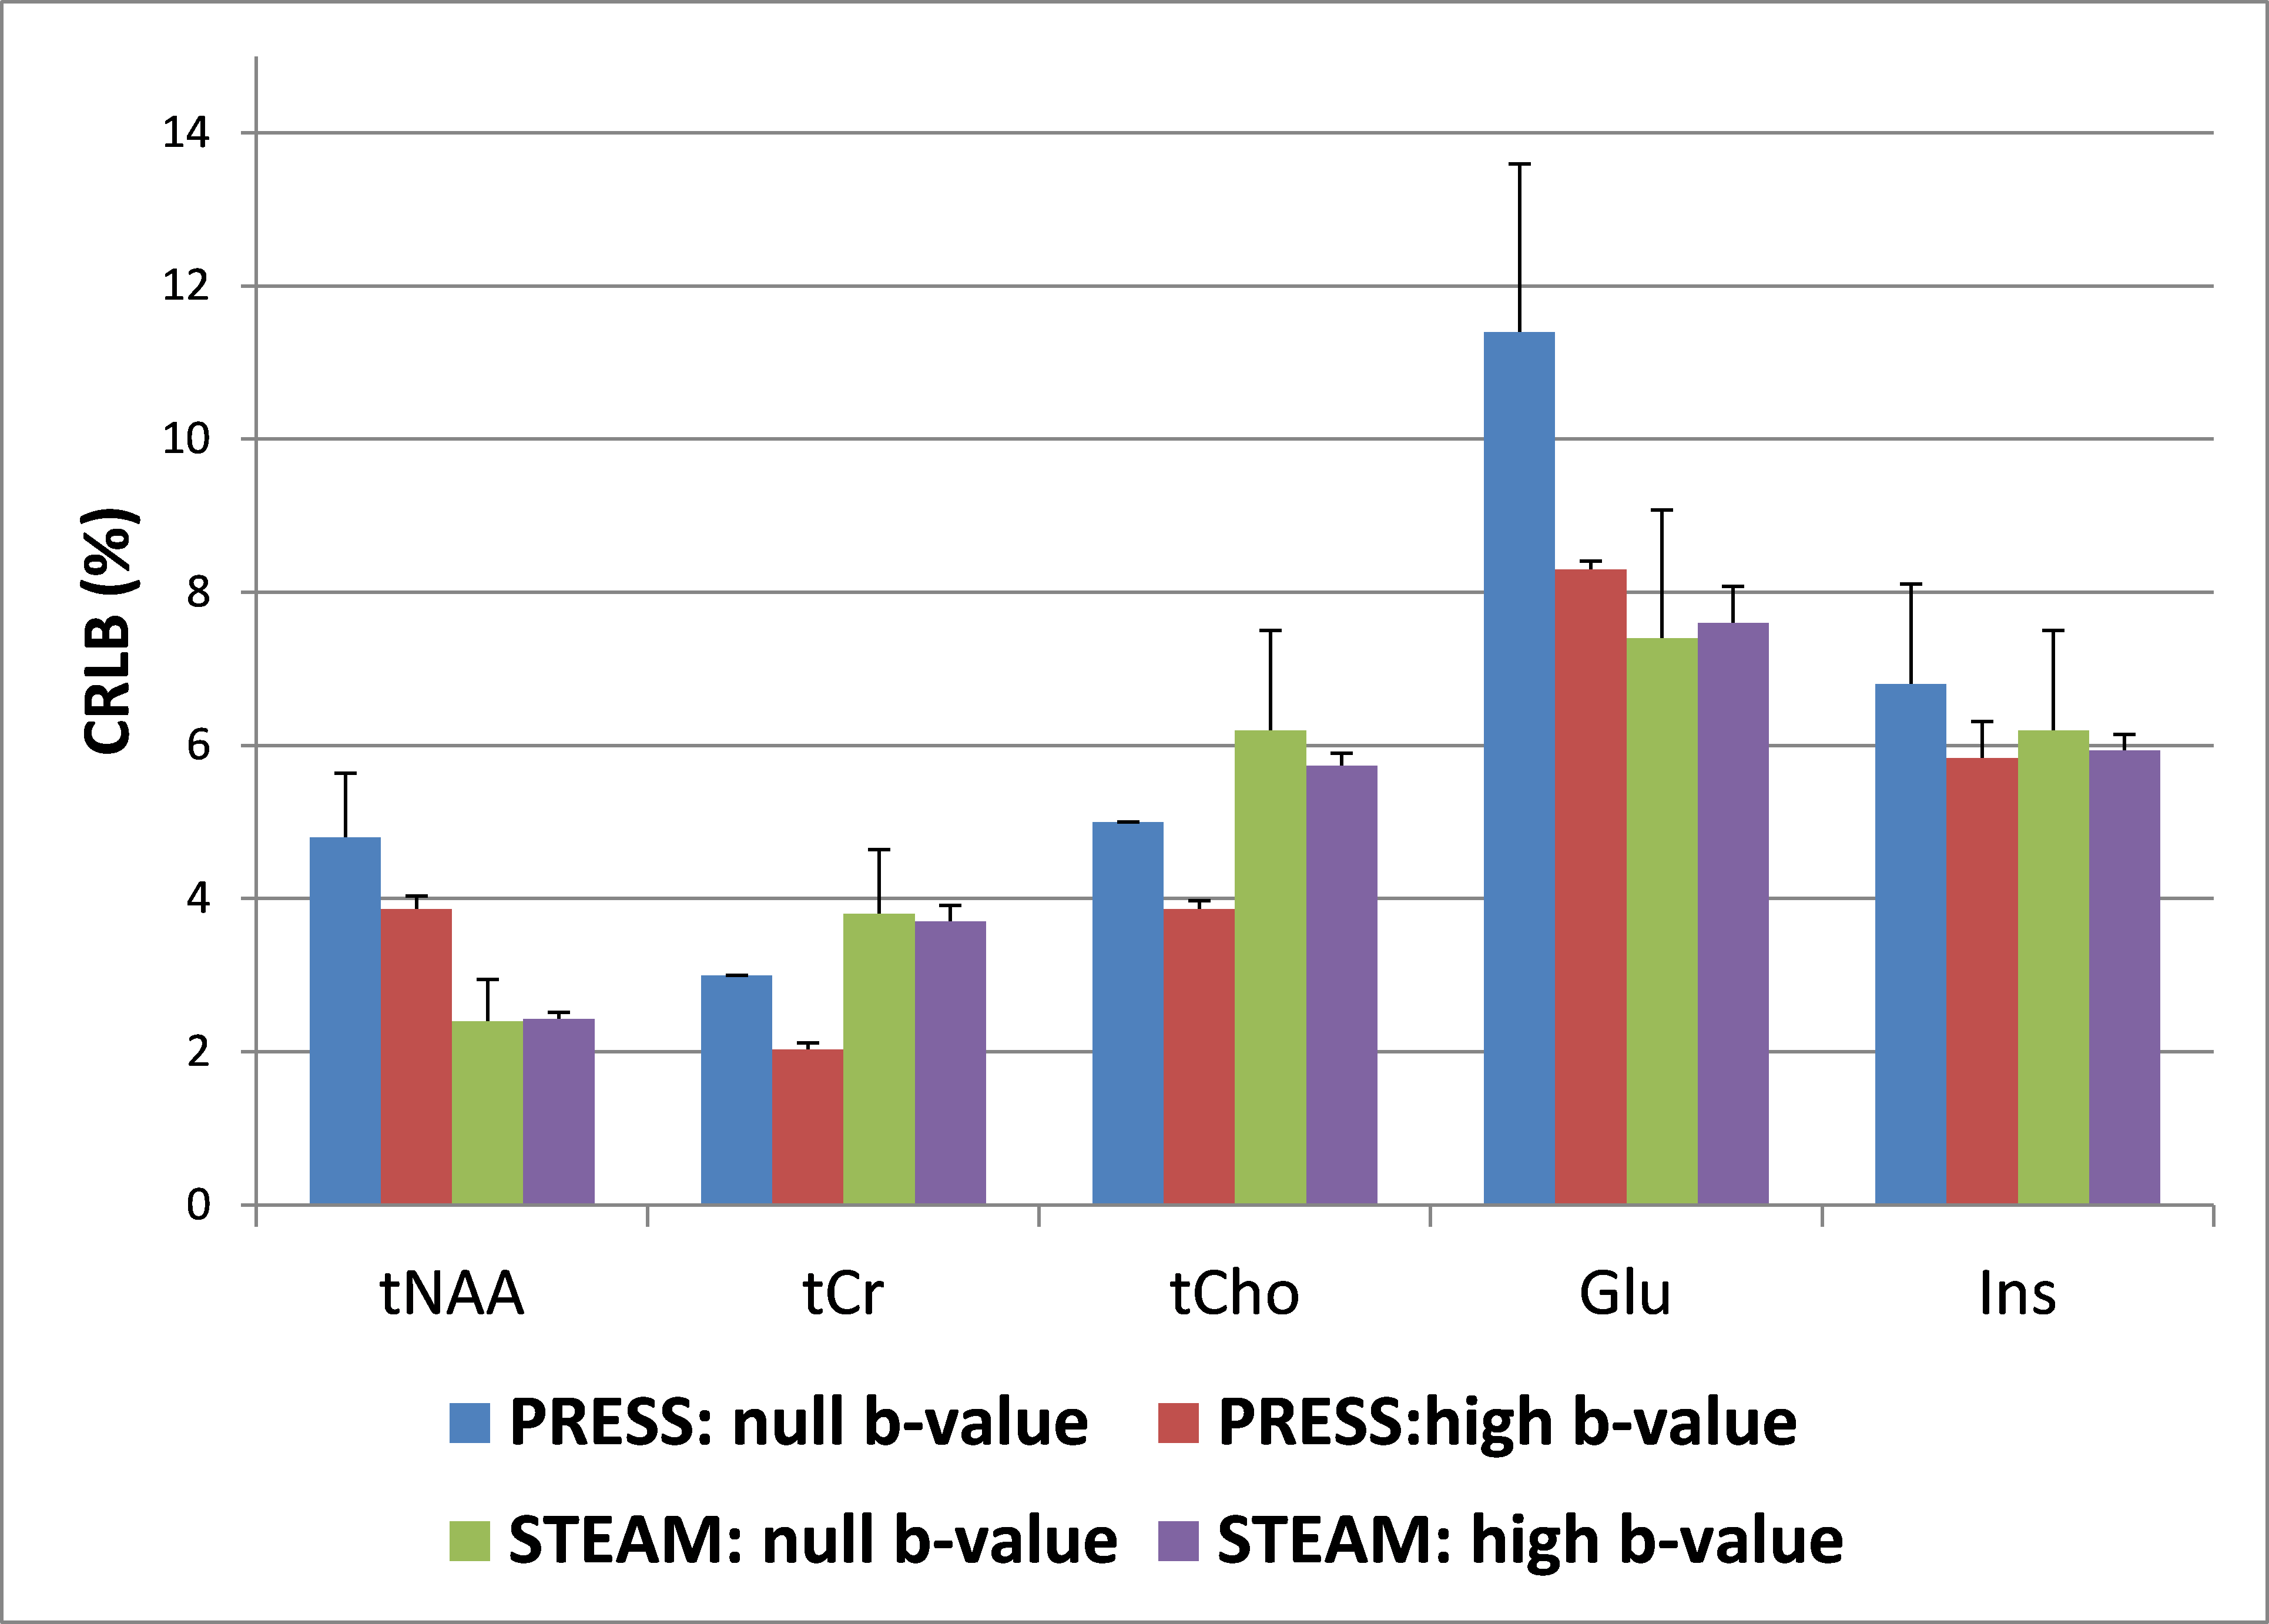
Diffusion-weighted spectra acquired from one subject using both PRESS and STEAM sequences in one session are shown in Figure 1. Comparable trace/3 ADC values (0.14–0.18 µm2/ms, Figure 2) were obtained for tNAA, tCr, and tCho using both acquisition techniques. In addition, the trace/3 ADC of both Glu and Ins were successfully measured for the first time at 3 T with minimized biases from cross-terms (Figure 2). The measured values are in good agreement with literature values obtained previously from GM in humans5. As expected, the trace/3 ADC of water was higher (0.75 µm2/ms) compared to metabolites. High SNR (> 50) was achieved at high b-value with both protocols. Although the SNR was almost two times higher with PRESS compared to STEAM (107 ± 24 vs. 68 ± 16 at null b-value and 137 ± 6 vs. 74 ± 5 at high b-value), this difference in SNR did not lead to differences in quantification of metabolites since the CRLBs for the 5 major metabolites considered in this study were below 12% (Figure 3). The CRLBs of Glu and Ins were slightly lower with STEAM than PRESS (7.4 ± 1.7% vs. 11.4 ± 2.2% for Glu, and 6.2 ± 1.3% vs. 6.8 ± 1.3% for Ins) and could be explained by the relatively short-TE used in STEAM where J-evolution is minimal.Conclusion
This study shows the feasibility of measuring the trace/3 ADC of the 5 major metabolites on a 3 T clinical scanner where the high SNR at large b-value has enabled the measurement of the diffusivity of Glu and Ins. Although the ADCs were comparable between PRESS and STEAM techniques, the quantification precision of these J-coupled metabolites was better with STEAM.Acknowledgements
This work was supported by NIH grants: R21AG045606,
P41 EB015894, P30 NS076408. We thank Dr. Julien Valette and Dr. Itamar Ronen for their helpful discussions.
References
[1] Posse et al. Radiology1993
[2] Ronen et al Front. Integr. Neurosci 2013
[3] Pfeuffer et al. J. Cereb. Blood Flow Metab 2000
[4] Valette et al. NMR Biomed. 2005
[5] Kan et al Magn Reson Med 2012
[6] Doring et al. Proceedings of ISMRM 2016
[7] Najac et al. Brain Struct Funct 2014
Figures