0407
Dynamics of lactate levels measured by functional proton magnetic resonance imaging in the rat somatosensory cortex upon increasing electrical hindpaw stimuli.1Institute for Biomedical Engineering, University & ETH Zürich, Zürich, Switzerland, 2Institute of Pharmacology and Toxicology, University of Zurich
Synopsis
MRSI in mice reveals changes in glutamate and lactate levels in somatosensory brain areas elicited by electric hindpaw stimulation. Using increasing stimulus amplitudes, lactate signals consistently decreased with increasing stimulus strength. This surprising result might reflect accelerated lactate clearance triggered by a generalized CBF increase in response to hindpaw stimulation, previously observed in this species. In contrast to mice, Lac levels in the contralateral somatosensory cortex of rats significantly increased with stimulus amplitude reflecting increased glycolytic activity and no obvious indication of increased lactate clearance. Despite the difference in Lac responses, similar Glu responses have been observed in both species.
Introduction
Functional proton magnetic resonance spectroscopy (fMRS) measures signals arising from endogenous metabolites and neurotransmitters in a time-resolved manner. Of the various metabolite signals identified in the MR spectrum, several are directly associated with neurotransmitter (glutamate, Glu; glutamine, Gln; gamma-amino-butyric acid, GABA) or energy turnover (lactate, Lac; phosphocreatine, PCr; creatine, Cr), and could serve as quantitative marker for neural activity. Previously, we measured significant changes in Lac and Glu levels upon electrical stimulation of the mouse hindpaw. While Glu levels consistently scaled with the stimulus amplitude, Lac responses displayed an unexpected behavior: a weak Lac increase for low stimulus amplitude, followed by a decrease in Lac levels that scaled with stimulus strength [1]. Corresponding BOLD fMRI measurements were found dominated by a strong and widespread cerebral blood flow (CBF) response masking the specific BOLD signal change in the area processing the somatosensory stimulus, in line with earlier findings [2]. The generalized increase in CBF might lead to enhanced clearance of tissue Lac and therefore explain the surprising results obtained with fMRS. In contrary to mice, the fMRI signal in rats in response to unilateral sensory input displays topological specificity, i.e. predominant BOLD signal changes in the contralateral somatosensory cortex. Given the difference in stimulus-evoked fMRI response between rats and mice, we wondered whether fMRS derived activity readout, which should be less prone to hemodynamic confounds, displayed more consistency across species. In particular, we investigated whether the unexpected Lac response would be also observed in rats. We therefore carried out an fMRS study in rats analyzing metabolic changes elicited by electrical hindpaw stimulation across large cortical areas.Methods
All experiments were carried out at 9.4 T (BioSpec 94/30, Bruker BioSpin MRI GmbH, Ettlingen, Germany). A cryogenic phased array coil was used for signal reception in combination with a volume resonator for homogeneous transmission. In vivo experiments were carried out in adherence with the Swiss law for animal protection. Rats (N=10) were anesthetized using isoflurane (1.5%), intubated and artificially ventilated with an oxygen/air (20% / 80%) mixture. Muscle relaxant pancuronium bromide (Sigma-Aldrich, Steinheim, Germany) was i.v. administered. For spectroscopic imaging (SI), an axial slice comprising somatosensory cortex, striatal regions and ventricles was selected using a 90° pulse, and immediately followed by the acquisition of the FID (TR: 2500ms; FOV: 2.8x1.5cm; matrix: 26x11; slice thickness: 2.2mm; acquisition time: 12min). First and second order shim terms were optimized using field maps. VAPOR was used for water suppression, interleaved with saturation slices for outer volume suppression. For electrical stimulation, needles were placed in both hindpaws. Stimulation was applied as follow: 2mA (right), 4mA (right), 4mA (left), 6mA (right), preceded, interleaved and followed with two SI scans at rest. For each stimulation cycle: 5Hz, 40s stimulation, 20s rest, 10 cycles (for a total duration of 10min). Relative quantification with total Cr as reference was performed using LCModel [4].Results
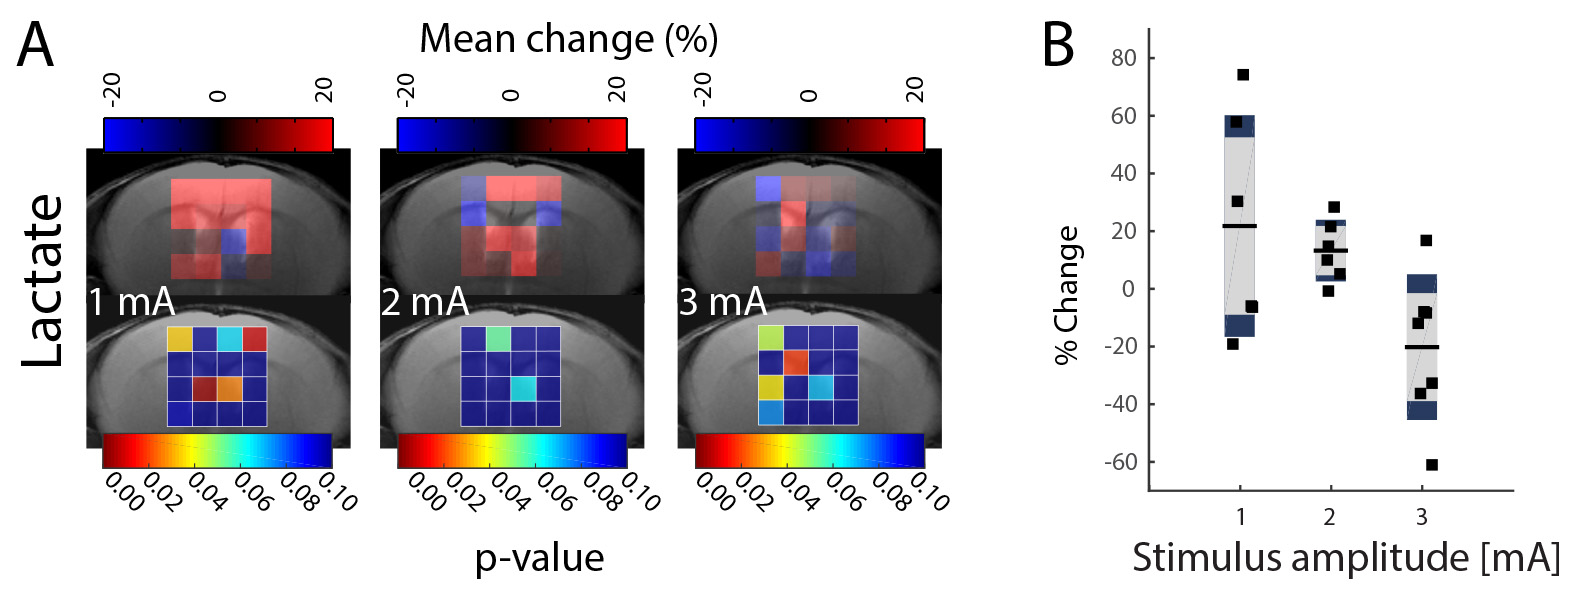
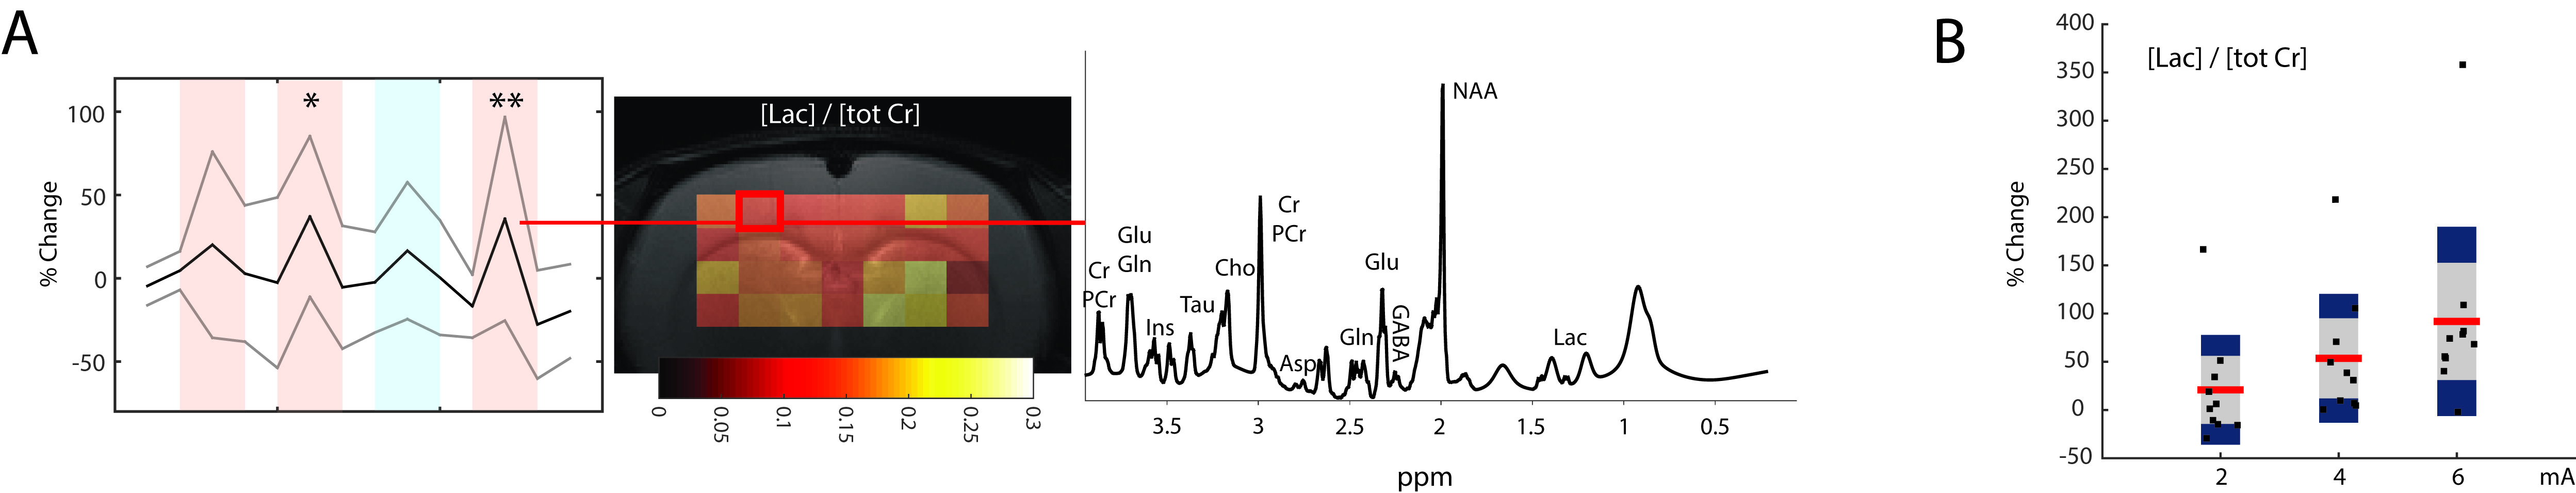
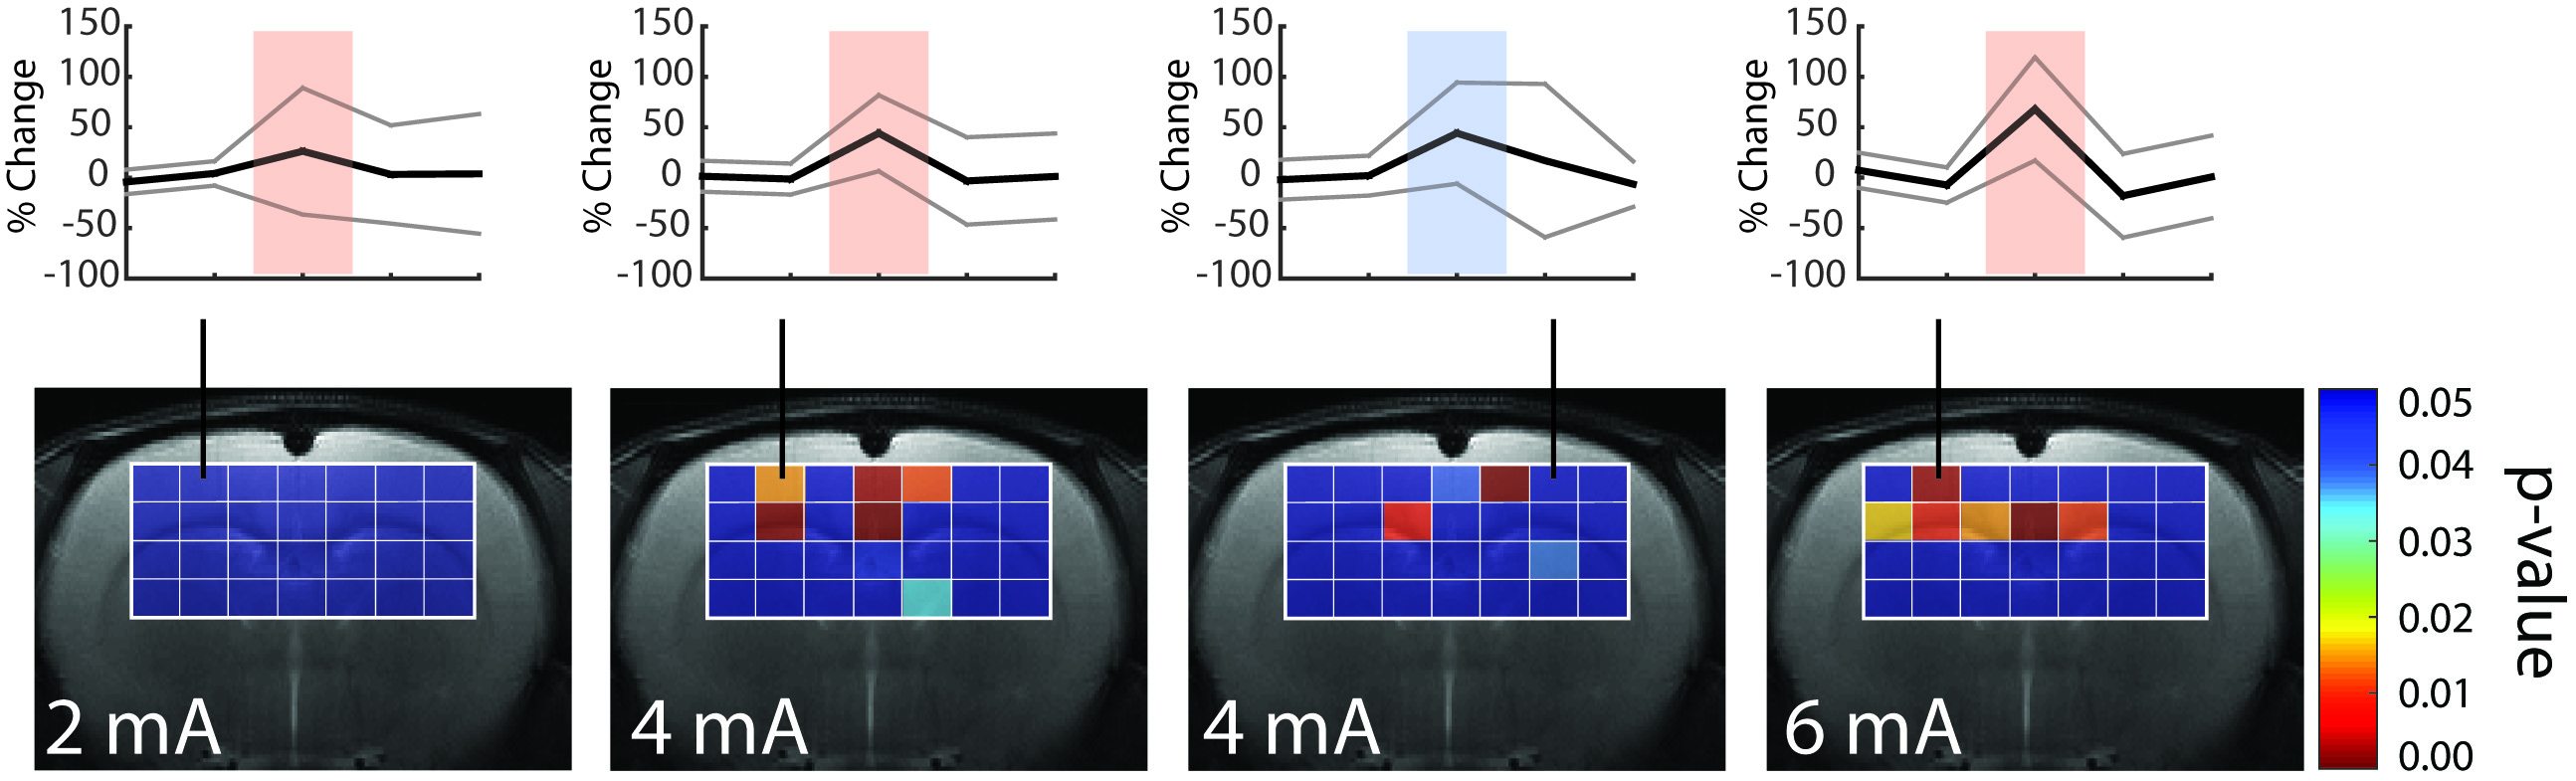
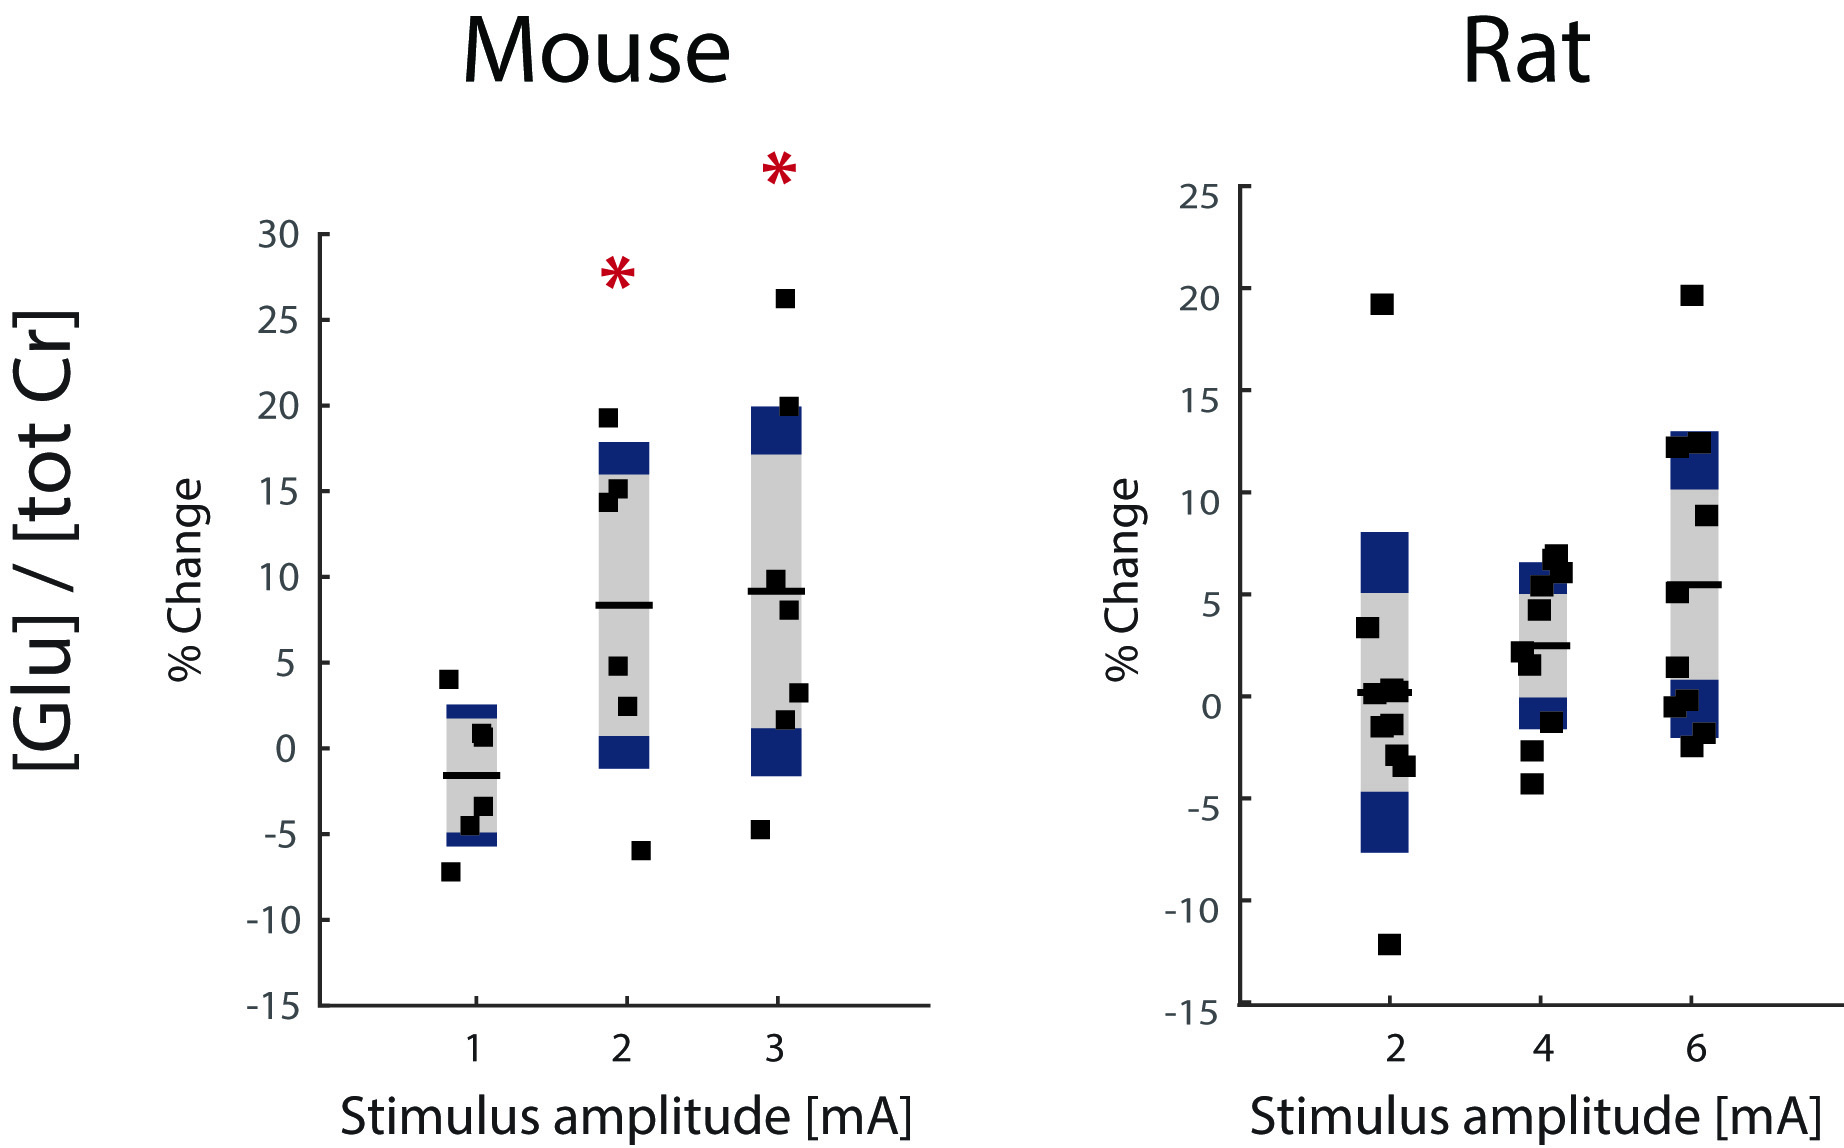
Previous results obtained in mice are summarized in Fig.1. Lac levels measured in the contralateral S1HL region (Fig.1B) were elevated for stimulation with 1mA and decreased when stimulating with 3mA. The Lac response appears unspecific (Fig 1A). In rats, spectra extracted from somatosensory areas (Fig.2A) displayed at least 10 metabolite signals. For Lac, Cramer-Rao Lower Bounds where below 25%. During stimulation, Lac levels where elevated on average by 19%, 46% and 85% with increasing stimulation amplitudes of 2mA, 4mA and 6mA, respectively (Fig.2B). Moreover the Lac increase was more pronounced in the contralateral somatosensory area. Statistical maps indicate higher specificity as compared to the mouse (Fig. 3). Similarly to the findings in mice, gradually increasing Glu levels (by 2.5% and 5 %) were observed when stimulating with 4mA and 6mA. No changes in Glu were detected upon stimulation with 2mA (Fig. 4). In mice, the Glu increase was more pronounced (7% and 8% when stimulating with 2mA and 3mA, respectively, Fig. 4).Discussion
The Lac increase at 1mA stimulus amplitude in mice indicates glycolytic activity, while decreasing Lac levels with increasing stimulus amplitude hint at a dominant contribution of general Lac clearance due to large CBF increases (and eventually to the use of Lac as energy substrate to cope with high demands). In contrast, the dose-dependent increase in Lac levels measured in rats reflects increased glycolytic activity, while at the stimulus strengths used CBF responses were not sufficient to significantly increase Lac clearance. This hypothesis has to be tested by measuring CBF responses to stimuli in the two species. Despite the difference in Lac responses a similar Glu response has been observed in mouse and rat.Acknowledgements
No acknowledgement found.References
[1] Seuwen et al, Proc.Intl. Soc. Mag. Reson. Med. 23, 2015, 1979 [2] Schroeter et al, Neuroimage 94, 372–384. [3] Ielaqua et al, Proc.Intl. Soc. Mag. Reson. Med. 23, 2015, 2037 [4] Provencher SW, Magn Reson Med 1993;30:672–679.Figures