0406
Detection of Changes in the Creatine Kinase Cycle Rate in the Human Visual Cortex During Visual Stimulation with Filter Exchange 1H MR Spectroscopy (FEXSY) at 7T1Vrije Universiteit, Amsterdam, Netherlands, 2Radiology, Leiden University Medical Center, Leiden, Netherlands
Synopsis
We selectively monitored the Cr/PCr exchange rate during visual stimulation using filter exchange spectroscopy (FEXSY), a pulse sequence sensitized to exchange between two pools with different diffusion coefficients. A Significant difference was observed between the filtered and non-filtered D(tCr) during rest, and vanished during stimulation, indicating an increase in the rate of creation of a fast-diffusing species in the tCr complex during stimulation. This suggests an increased production of Cr from PCr resulting from increased metabolic demand, or an increase in “free” vs. enzyme-bound tCr. The non-filtered ADC of NAA significantly increased during activation, suggesting microstructural change during activation.
Introduction
Diffusion weighted magnetic resonance spectroscopy (DW-MRS) provides unique compartment-specific information on intracellular microstructural features and their modulation by disease and physiology1-3. Changes in metabolite ADC linked with neuronal activation in the human visual cortex have been previously reported4. Particularly intriguing was the tight temporal correlation between the apparent diffusion coefficient (ADC) of total creatine (creatine+phosphocreatine = tCr) and the stimulus, leading to the hypothesis that the increase in ADC(tCr) during stimulation may reflect an increase in the exchange rate between creatine and phosphocreatine mediated by the creatine kinase (CK) cycle on the time scale of the diffusion time5. To corroborate this hypothesis and in an effort to provide a 1H MRS quantitative method for assessing cellular energy metabolism, we used filter exchange spectroscopy6 (FEXSY), a pulse sequence sensitized to exchange between two pools with different diffusion coefficients, to measure exchange-specific changes in ADC(tCr) and of other metabolites, such as N-acetyl aspartate (NAA), an intraneuronal metabolite with no known explicit role in energy metabolism.Materials and Methods
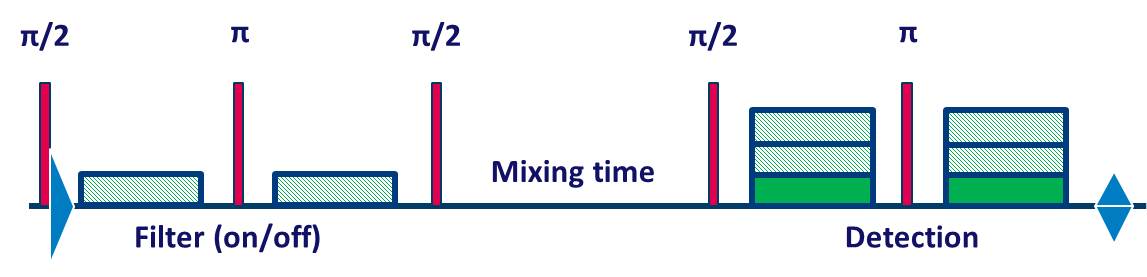
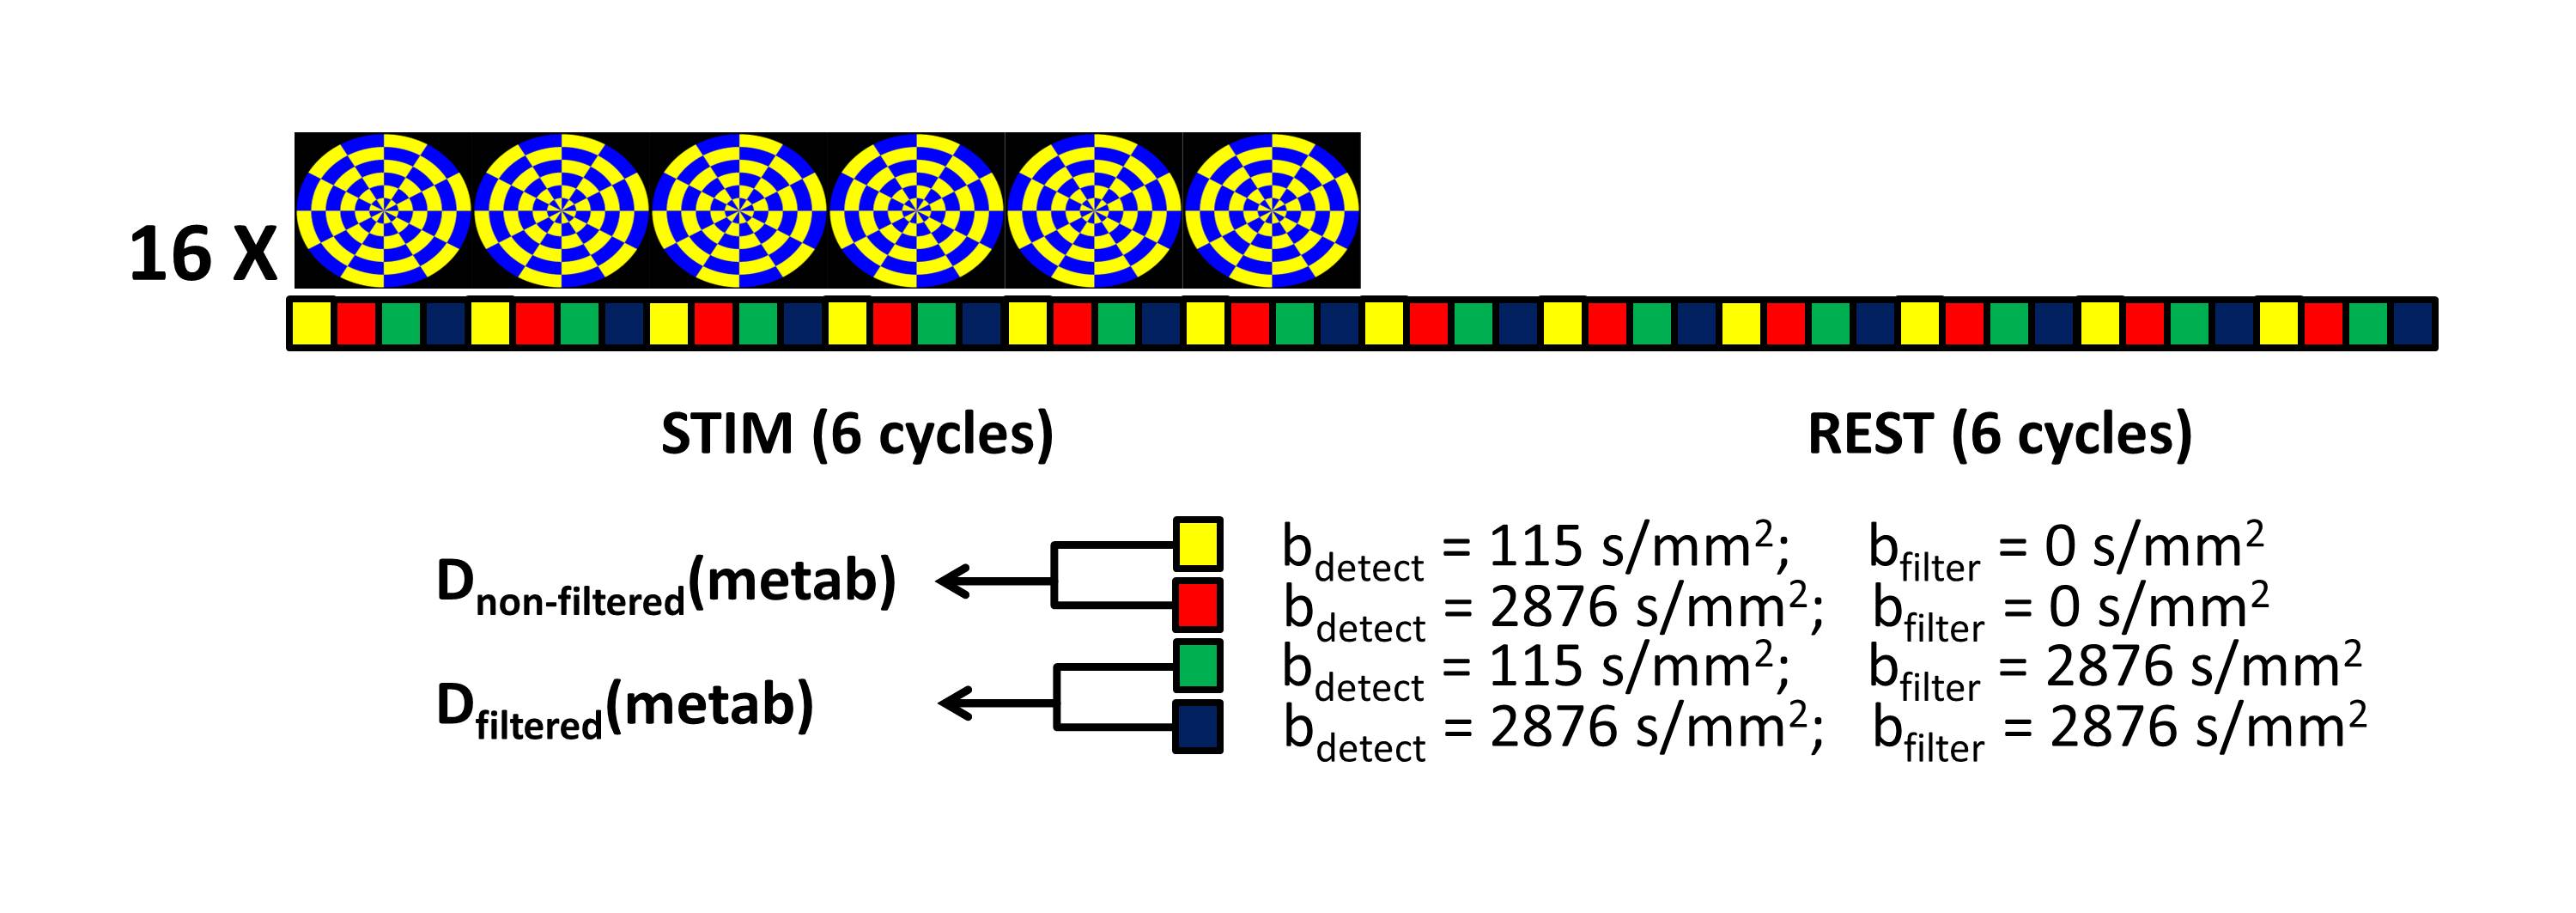
Experiments were performed on a Philips whole body 7T Achieva scanner, equipped with a quadrature transmit/32-channel receive head coil. 6 healthy volunteers (28±9 years) were scanned with procedures approved by our institutional review board. Following a high-resolution T1-weighted anatomical scan, a short fMRI experiment was performed to localize the primary visual cortex. The active area was used to plan the VOI for the functional FEXSY experiment. The FEXSY pulse sequence is shown in Figure 1. Scan parameters: TR/TE/τm = 2500/125/650 ms. Diffusion weighting was applied in four conditions: two measurements with the detection module at b = 115 and 2876 s/mm2 without filter (b = 0 for the filter module) and two similar measurements with the filter module set at b = 2876 s/mm2. The functional paradigm is shown in Figure 2. The stimulus was a full-field flashing checker-board back-projected on a screen within the scanner bore. The stimulus was repeated 16 times, and each stimulus delivery coincided with 24 spectral acquisitions at the 4 diffusion weighting conditions mentioned above, so that the "functional TR" was 10s. Spectroscopic data were pre-processed with a custom-written Matlab routine, where eddy current correction, individual frequency and phase drift correction were performed. Data acquired during the stimulus and control conditions were split, and for each condition, 4 averaged spectra were generated from the 4 diffusion weighting conditions (Figure 2). Estimation of the spectral peaks was performed with LCModel7 using an appropriately simulated basis set.Results
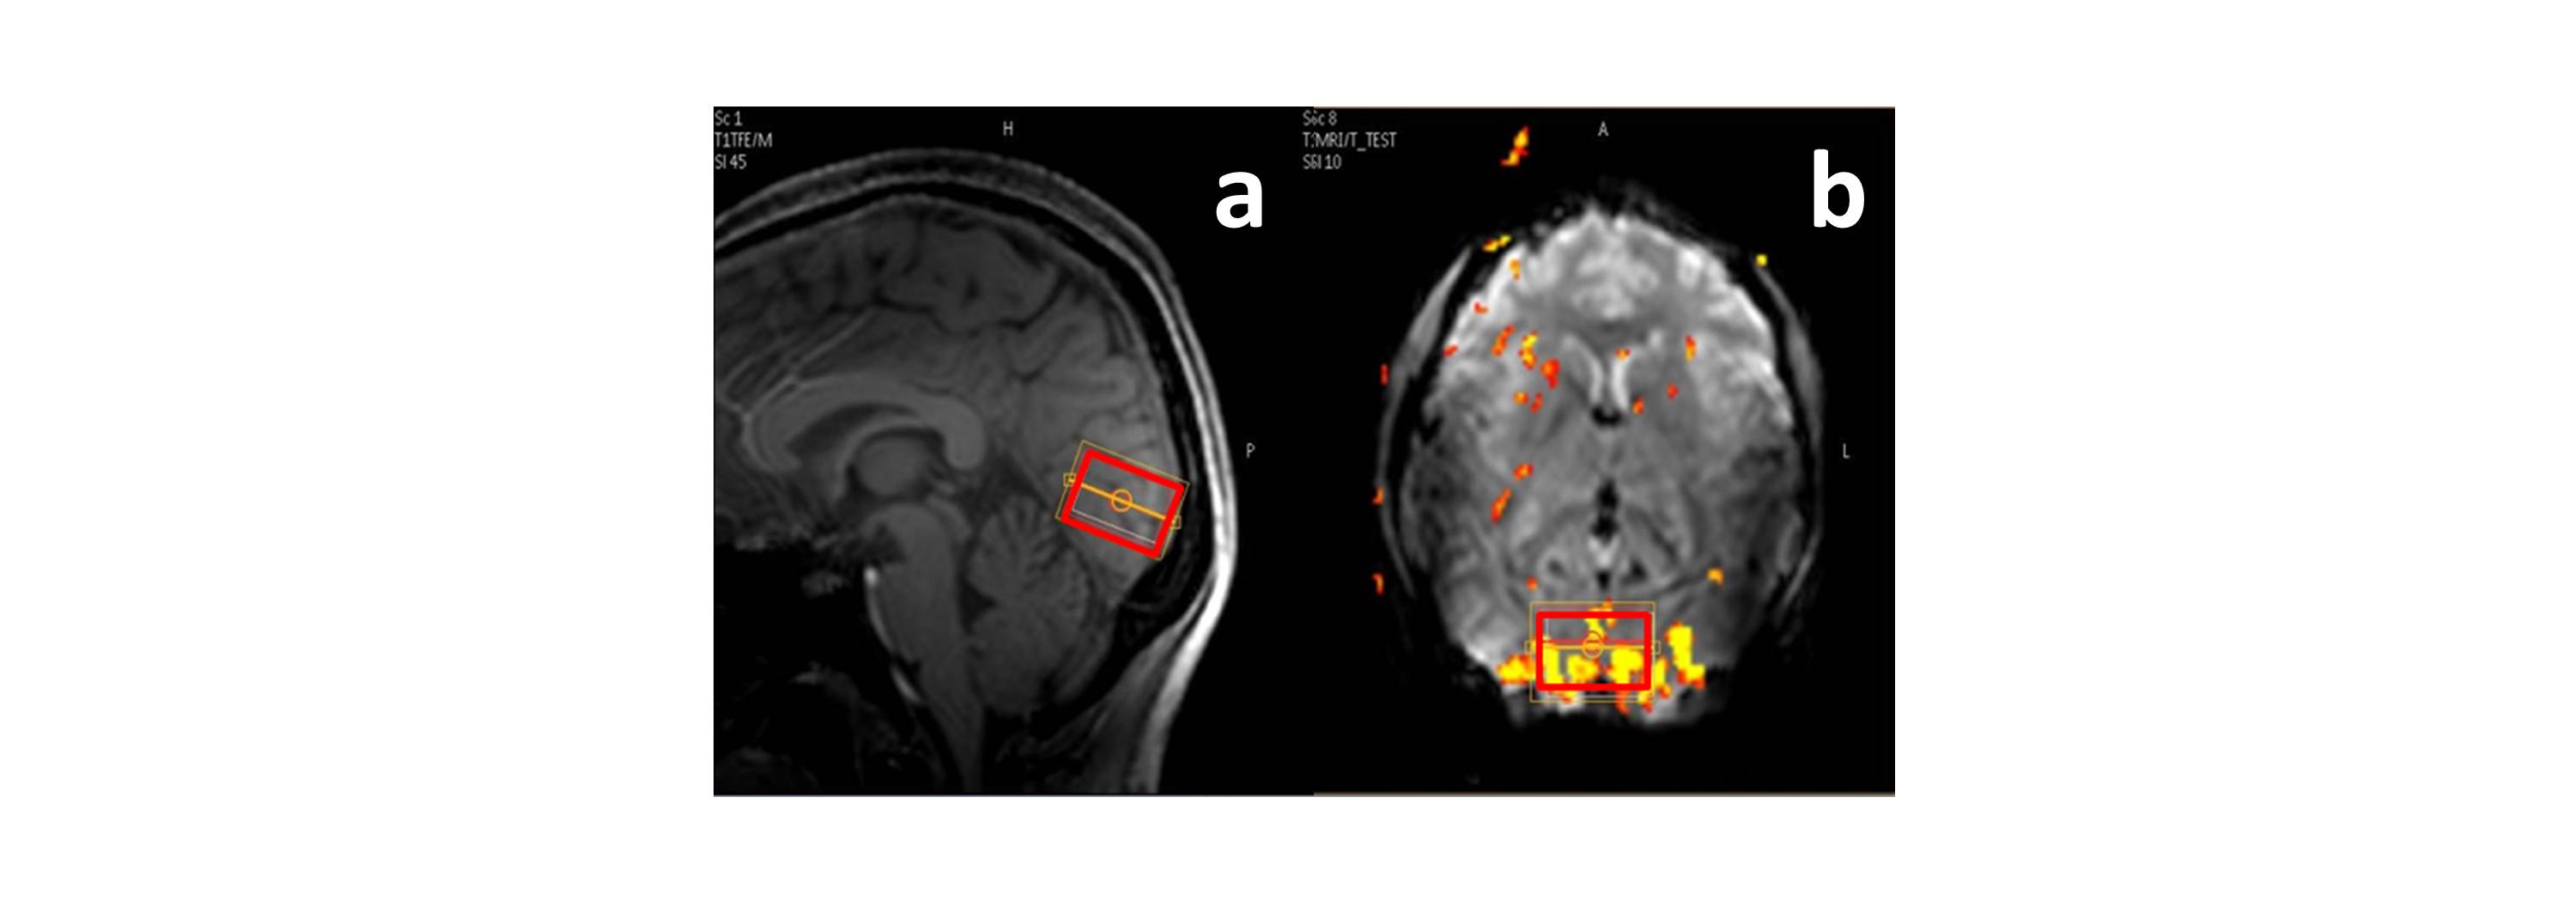
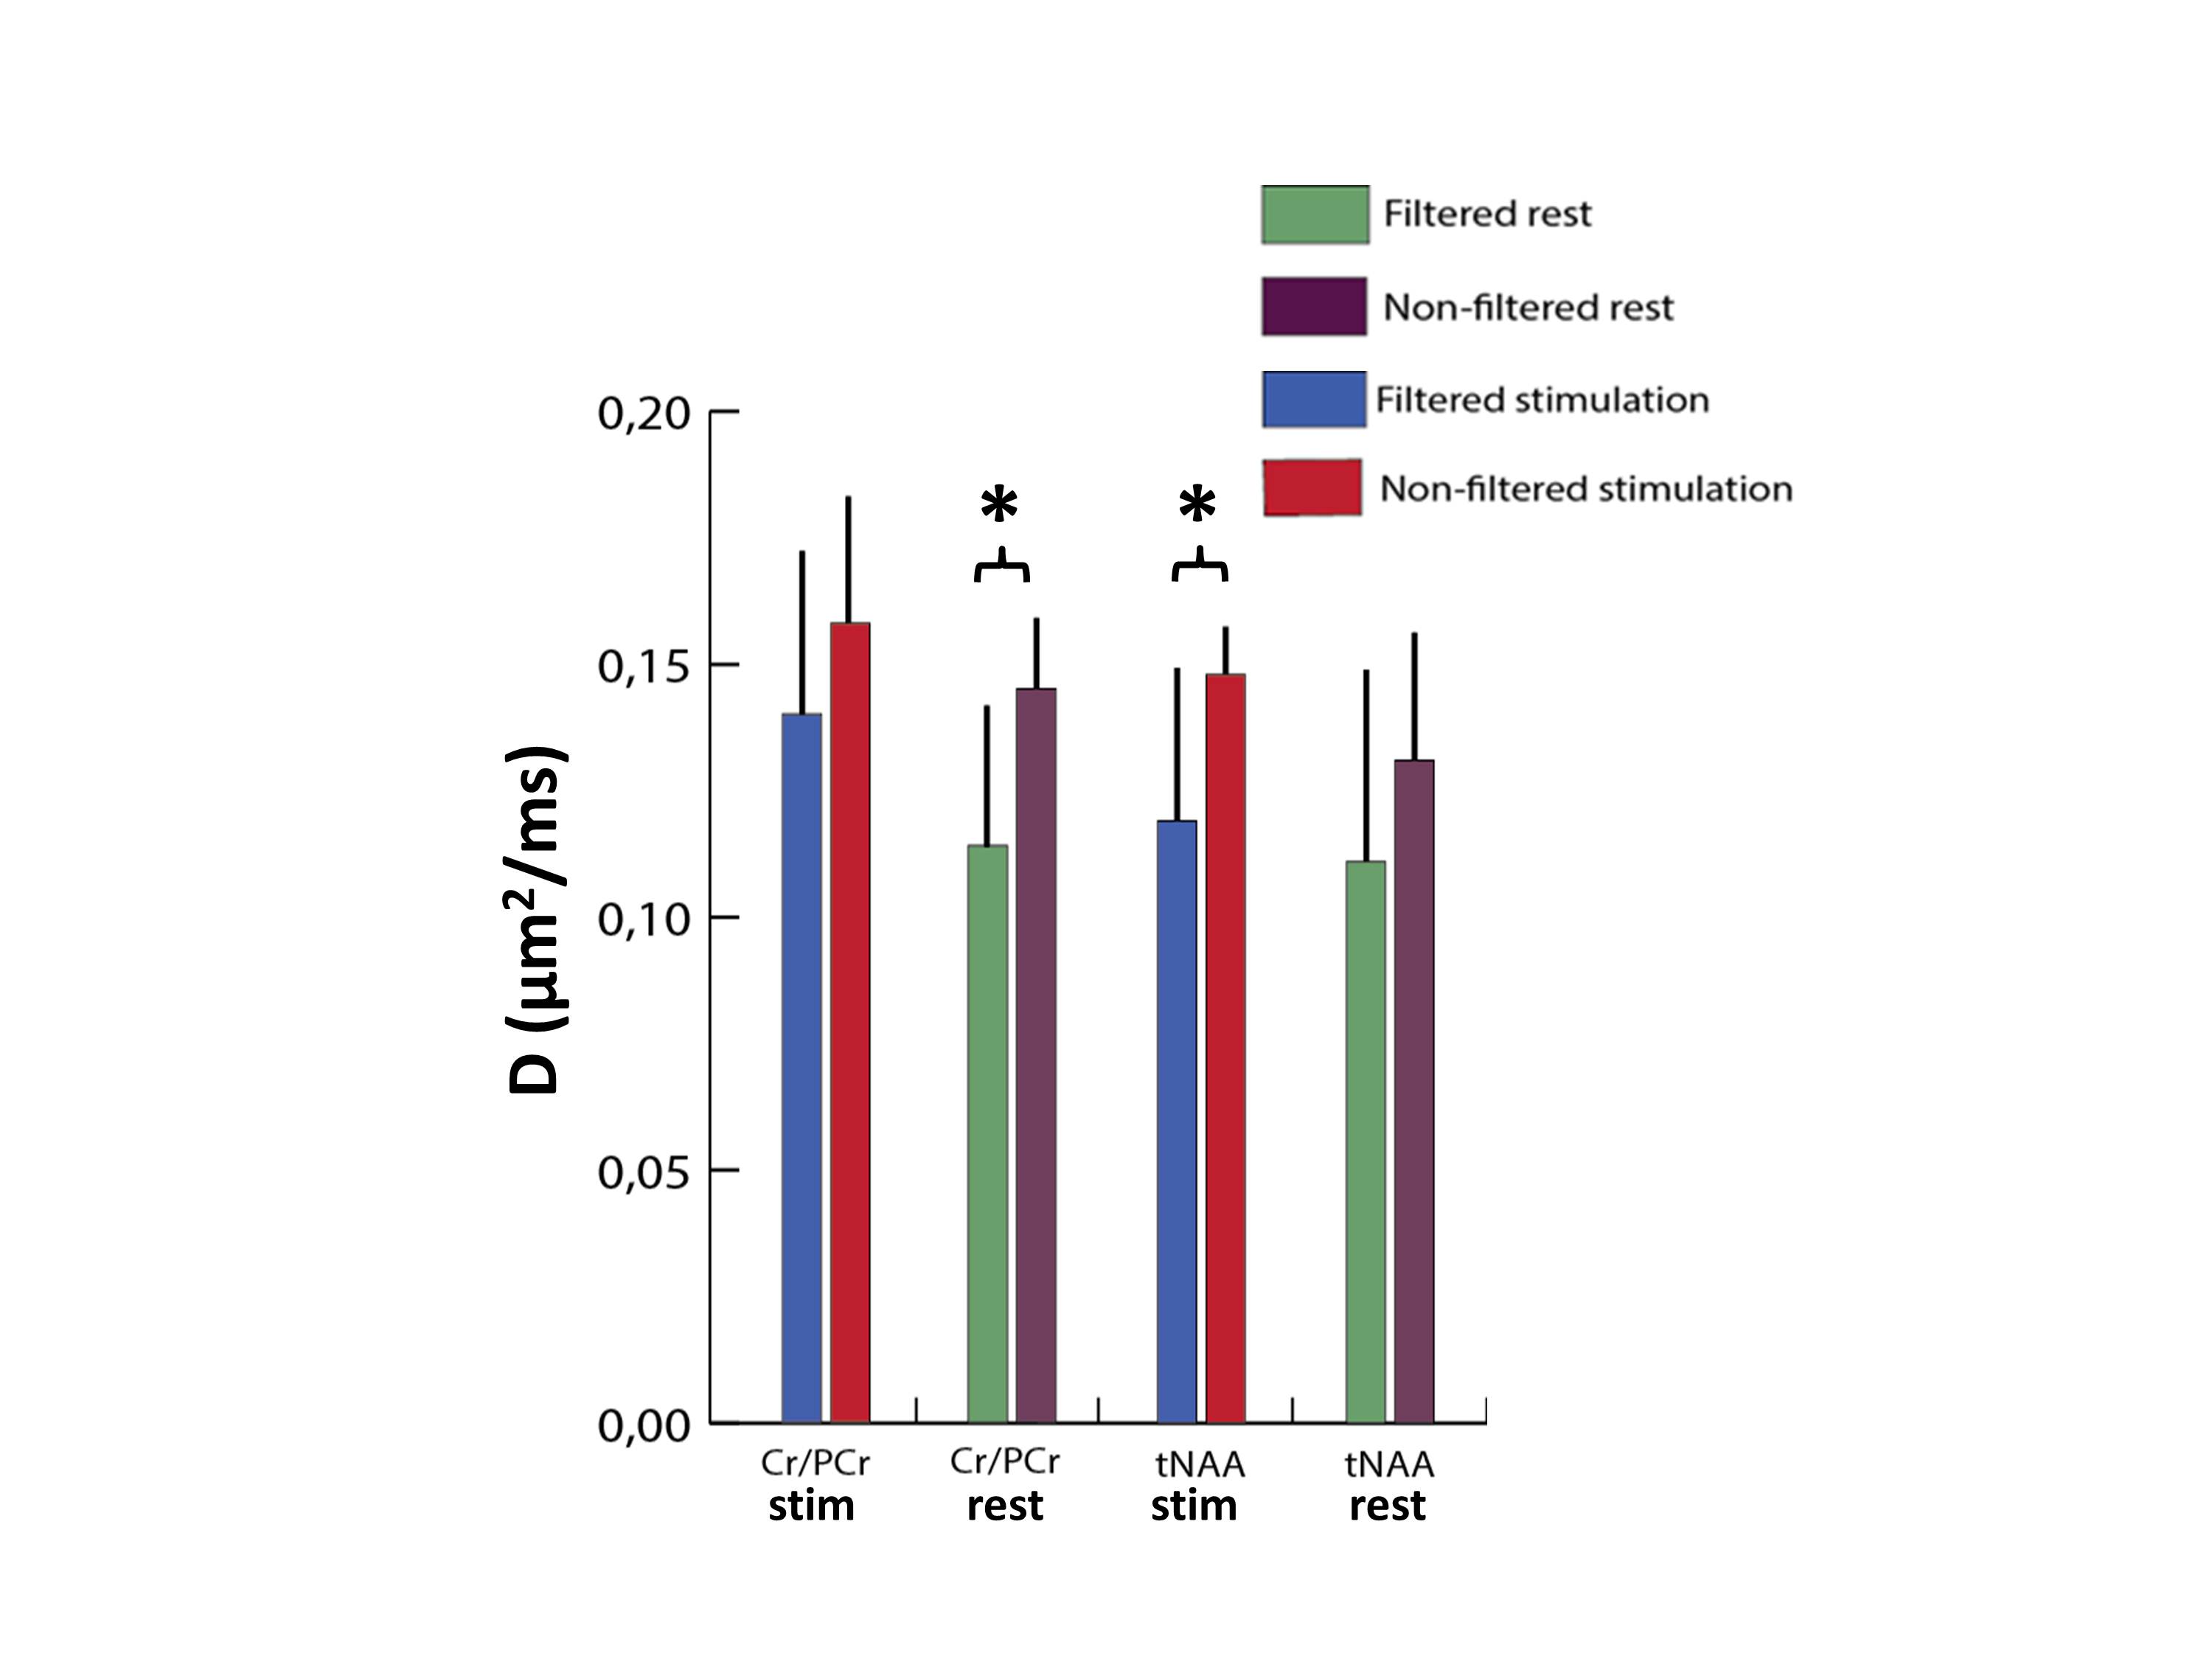
Figure 3 shows the activated region and the position of the spectroscopic VOI in a typical experiment. In Figure 4 the filtered and non-filtered D(tCr) and D(NAA) calculated for the stimulus and control conditions are shown. A significant difference between the filtered and non-filtered D(tCr) is observed for the control condition (p < 0.05), and the significance vanishes in the stimulus condition. Conversely, filtered and non-filtered D(NAA) are not significantly different for the control condition, but are significantly different (p < 0.05) during activation. There were no significant differences associated with D(tCho) for any of the conditions, and the spectral estimation of other metabolites did not reach a low enough Cramer-Rao lower bound (CRLB) for analysis.Brief Discussion
The significant difference between the filtered and non-filtered D(tCr) at baseline indicates the presence of pools with significantly different D. These may be the pools of creatine and phosphocreatine, which significantly differ in their intrinsic D, or populations of creatine/phosphocreatine that are either bound to the CK or freely moving in the cytosol. Our experimental results suggest that upon stimulation the exchange rate between these two pools increases: this is evidenced by the large increase in D(tCr) for the filtered condition going from baseline to stimulus, compared to the more modest increase in the non-filtered condition. Stimulus-related changes in D(metabolites) in the non-filtered condition may stem from other sources, e.g. microstructural changes such as increase in cell volume. This is seen in the case of D(NAA), where a sizeable increase in D(NAA) in the non-filtered condition is possibly responsible for the significant difference observed between the filtered and non-filtered D(NAA) during stimulation.
Conclusions
We present here results of a proton MRS method capable of providing unique localized information on both energy metabolism related to the CK cycle and on microstructural changes during activation. These are promising initial observations, requiring optimization of the acquisition to maximize the exchange effect (e.g. optimization of the mixing time), as well as accounting for various confounds such as gradient cross-terms and crusher effects.Acknowledgements
No acknowledgement found.References
1. Nicolay, K., K. P. Braun, et al. (2001), Diffusion NMR spectroscopy. NMR Biomed 14(2): 94-111.
2. Ronen, I. and Valette, J. (2015), Diffusion-Weighted Magnetic Resonance Spectroscopy. eMagRes. 733–750.
3. Cao, P., and Wu, E. X. (2016), In vivo diffusion MRS investigation of non-water molecules in biological tissues. NMR Biomed., doi: 10.1002/nbm.3481.
4. Branzoli, F., A. Techawiboonwong, et al. (2013), Functional diffusion-weighted magnetic resonance spectroscopy of the human primary visual cortex at 7T. Magn Reson Med 69(2): 303-309.
5. Du, F., Zhu, X.-H., Qiao, H., et al.,(2007), Efficient in vivo 31P magnetization transfer approach for noninvasively determining multiple kinetic parameters and metabolic fluxes of ATP metabolism in the human brain. Magn. Reson. Med., 57: 103–114.
6. Aslund, I., A. Nowacka, et al. (2009). Filter-exchange PGSE NMR determination of cell membrane permeability. Journal of Magnetic Resonance 200(2): 291-295.
7. Provencher, S. W. (1993), Estimation of metabolite concentrations from localized in vivo proton NMR spectra. Magn Reson Med 30(6): 672-679.
Figures