0405
Activation induced changes in GABA: functional MRS at 7T with MEGA-sLASER1Sir Peter Mansfield Imaging Centre, University of Nottingham, Nottingham, United Kingdom, 2School of Psychology, University of Nottingham, Nottingham, United Kingdom, 3School of Medicine, University of Nottingham, Nottingham, United Kingdom
Synopsis
To investigate changes in GABA levels in human motor cortex in response to the hand clenching task, the macromolecule-corrected MEGA-sLASER sequence was used in functional MRS (fMRS) experiments conducted at 7T. During motor activation, the total creatine (tCr) signal remained stable, while a significant transient increase in GABA/tCr (20%±11%) was observed. The measured increase in Glx/tCr (12%±6%) was higher but consistent with changes reported for Glutamate. With consistent editing performance for GABA detection and the advantage of visually identifying GABA peaks in spectra, this spectral editing approach showed its potential for future fMRS studies of GABA.
Introduction
Previous functional MRS studies used standard 1H localisation techniques to assess the metabolic response of the brain to a physiological stimulus across a wide range of brain metabolites1,2,3,4. One such study4 has reported a non-significant trend for GABA to increase in response to visual stimulation. Recently, the macromolecule-corrected MEGA-sLASER sequence, a spectral-editing technique which separates GABA signals from overlapping signals, has been shown to be efficient for pure GABA detection5,6. The aim of this study was to investigate activation induced changes in GABA using the enhanced sensitivity of MEGA-sLASER sequence at 7T.Methods
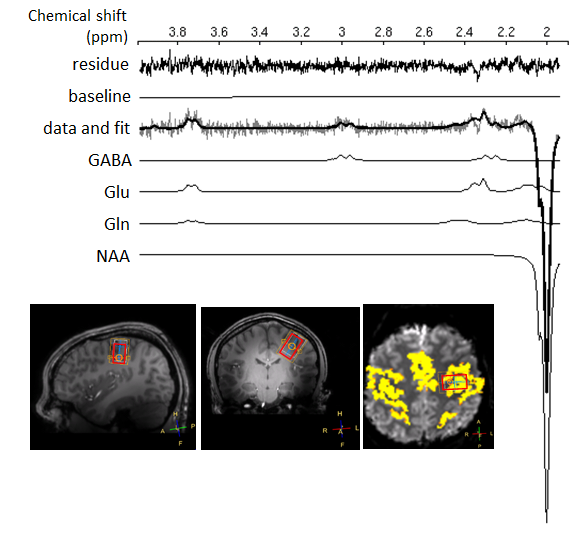
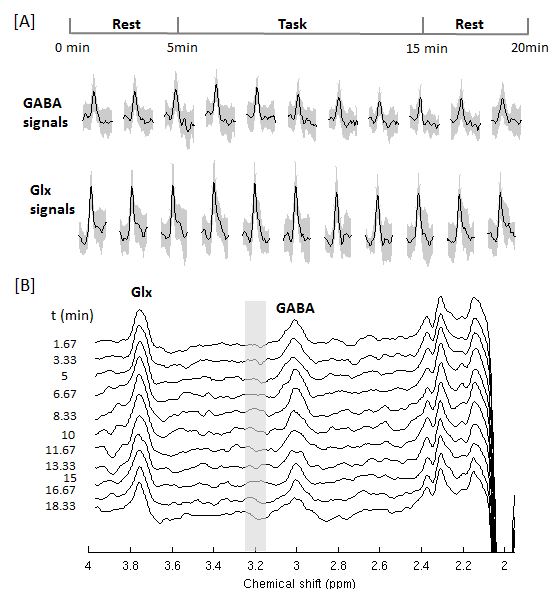
MR measurements: All MR measurements were performed on a 7T Philips Achieva system. 9 healthy subjects (age range: 21-28 yrs) participated in this study with ethics approval from University of Nottingham Medical School Ethics Committee. In vivo 1H spectra were acquired from a 1.5×2×3 cm3 voxel in the left motor cortex (Fig. 1) using the macromolecule-corrected MEGA-sLASER sequence6 (TE/TR=72/5000ms, 240 averages, MEGA Edit-ON: 1.9 ppm & Edit-OFF: 1.7 ppm) during the 20min functional paradigm (5min-Rest, 10min-Hand clenching tasks, 5min-Rest).
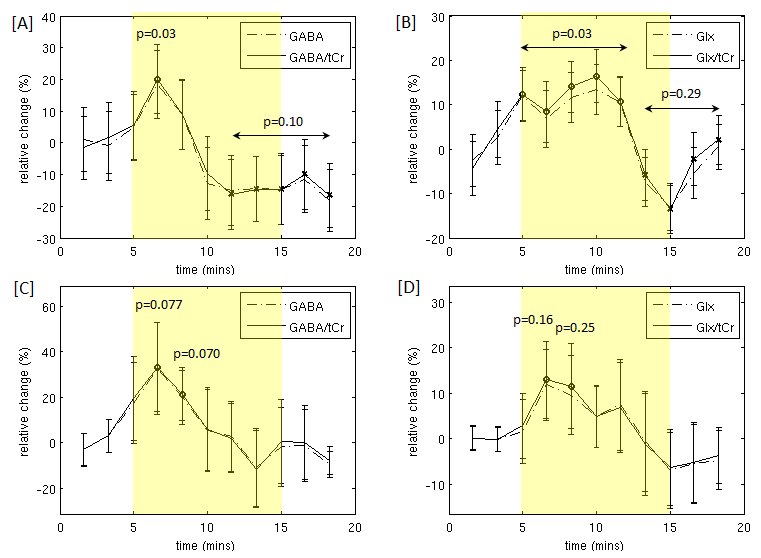
Data Analysis: After performing a moving average (window size= 200 seconds, step size= 100 seconds), 11 edited spectra (i.e. editON-editOFF) for each individual were obtained for the quantification of GABA and Glx (Glu+Gln) signals with LCModel7 (Fig. 1). The total creatine (tCr) signals in the corresponding SUM spectra (i.e. editON+editOFF) were also quantified. LCModel basis sets for quantification were simulated using jMRUI-NMRscope tool8. In addition, group mean spectra were obtained by averaging over 9 subjects for GABA quantification, and over 7 subjects for Glx quantification (group analysis). Two subjects were discarded for Glx analysis due to artefacts observed around Glx resonances. Finally, relative changes in GABA, Glx signals, GABA/tCr, and Glx/tCr signal ratios with respect to the baseline (mean of the first 2 time-points) were calculated for individual and group time courses, respectively. Statistical significance of changes between activation and baseline were inferred by two-tailed paired t-tests.
Results
The linewidth of NAA singlets (SUM spectra) was 7.7±1.3 Hz, with no BOLD related change on NAA linewidth detected (p=0.6). Fig. 2[A] shows the time course of GABA signals at 3 ppm and Glx signals at 3.75 ppm (group mean+SD) observed in the edited spectra. Fig. 2[B] shows that the edited spectra (group mean) are consistent for different time-points with a clean baseline, particularly in the region of choline singlets (3.2ppm), demonstrating the good singlet elimination and reliable editing performance. Fig. 3[A] shows the group averaged response to the 10min-clenching task: GABA/tCr significantly increased 20%±11% (p=0.03) above baseline level within the first half of the task-period and then decreased to a stable level, -14%±11% (p=0.10) below baseline. Fig. 3[B] shows that Glx/tCr increases 12%±6% (p=0.03) above baseline during activation and then returns back to baseline level (p=0.29). Fig. 3[C,D] shows that the mean of individual metabolite time courses exhibits a similar behaviour as the group time course, but with lower statistical significance. No significant change was detected in the tCr signal (p=0.62) between the rest and task periods, hence the similarity of the absolute and ratio plots as shown in Fig. 3.Discussion
The enhanced sensitivity of MEGA-sLASER sequence at 7T allowed detection of GABA changes in response to activation. The significant increase observed in GABA/tCr during motor activation agreed with the previously reported non-significant trend for GABA to increase during visual activation4. Additionally, the change found in Glx/tCr during motor activation in this study was higher but consistent with changes previously reported for Glu (motor activation: 3%±1%1; visual activation: 3%±1%2, 5%±1%3). With consistent editing performance for GABA detection and the advantage of visually identifying GABA peaks in spectra, MEGA-sLASER showed its potential for future fMRS studies of GABA.Acknowledgements
Funded by the University of Nottingham.References
[1] Schaller B., et al. NeuroImage. 2014;93:138-145.
[2] Bednarík P., et al. JCBFM. 2015;35:601-610.
[3] Bednarík P., et al. Proc. Intl. Soc. Mag. Reson. Med. 24. 2016:3351.
[4] Lin Y., et al. JCBFM. 2012;32:1484-1495.
[5] Andreychenko A., et al. MRM. 2012;68:1018-1025.
[6] Chen C., et al. Proc. Intl. Soc. Mag. Reson. Med. 23. 2015:0203.
[7] S. Provencher, et al. MRM. 1993;30: 672-679.
[8] Naressi A, et al. Magma.2001;12(2-3):141-152.
Figures