0403
Glutamate modulation during working memory task performance: A functional proton magnetic resonance spectroscopy study in healthy adult volunteers1Psychiatry and Behavioral Neurosciences, Wayne State University School of Medicine, Detroit, MI, United States
Synopsis
Glutamate is involved in excitatory neurotransmission and oxidative metabolism. In vivo glutamate measurements at task-relevant temporal resolution are possible using functional proton magnetic resonance spectroscopy. The present study quantified glutamate levels in the dorsolateral prefrontal cortex during working memory task performance and interspersed periods of rest. Results demonstrated that our approach was feasible and quantification of glutamate levels was reliable at 32s temporal resolution. Statistical analyses demonstrated that glutamate levels were elevated during working memory task performance (relative to rest), consistent with our hypotheses. Elevated glutamate levels during task performance likely reflect increased oxidative metabolism due to excitatory neurotransmission.
PURPOSE:
Glutamate, the most abundant neurotransmitter, is involved in excitatory neurotransmission and oxidative metabolism. Recent technological advances have made in vivo glutamate measurements at task-relevant temporal resolution possible using functional proton magnetic resonance spectroscopy (1H fMRS). Two independent research groups demonstrated that glutamate levels were elevated in the occipital lobe during visual stimulation (relative to no visual stimulation)1,2. Elevated glutamate during visual stimulation likely reflects increased excitatory neurotransmission and oxidative metabolism in the visual cortex1-3. Our group recently extended this approach to cognitive tasks. The present study quantified glutamate levels in dorsolateral prefrontal cortex (dlPFC; Brodmann areas 45 and 46) during working memory task performance and interspersed periods of rest. It is well-established that working memory is supported by neural activity in the dlPFC. We hypothesized that glutamate levels would be elevated during task performance relative to rest.METHODS:
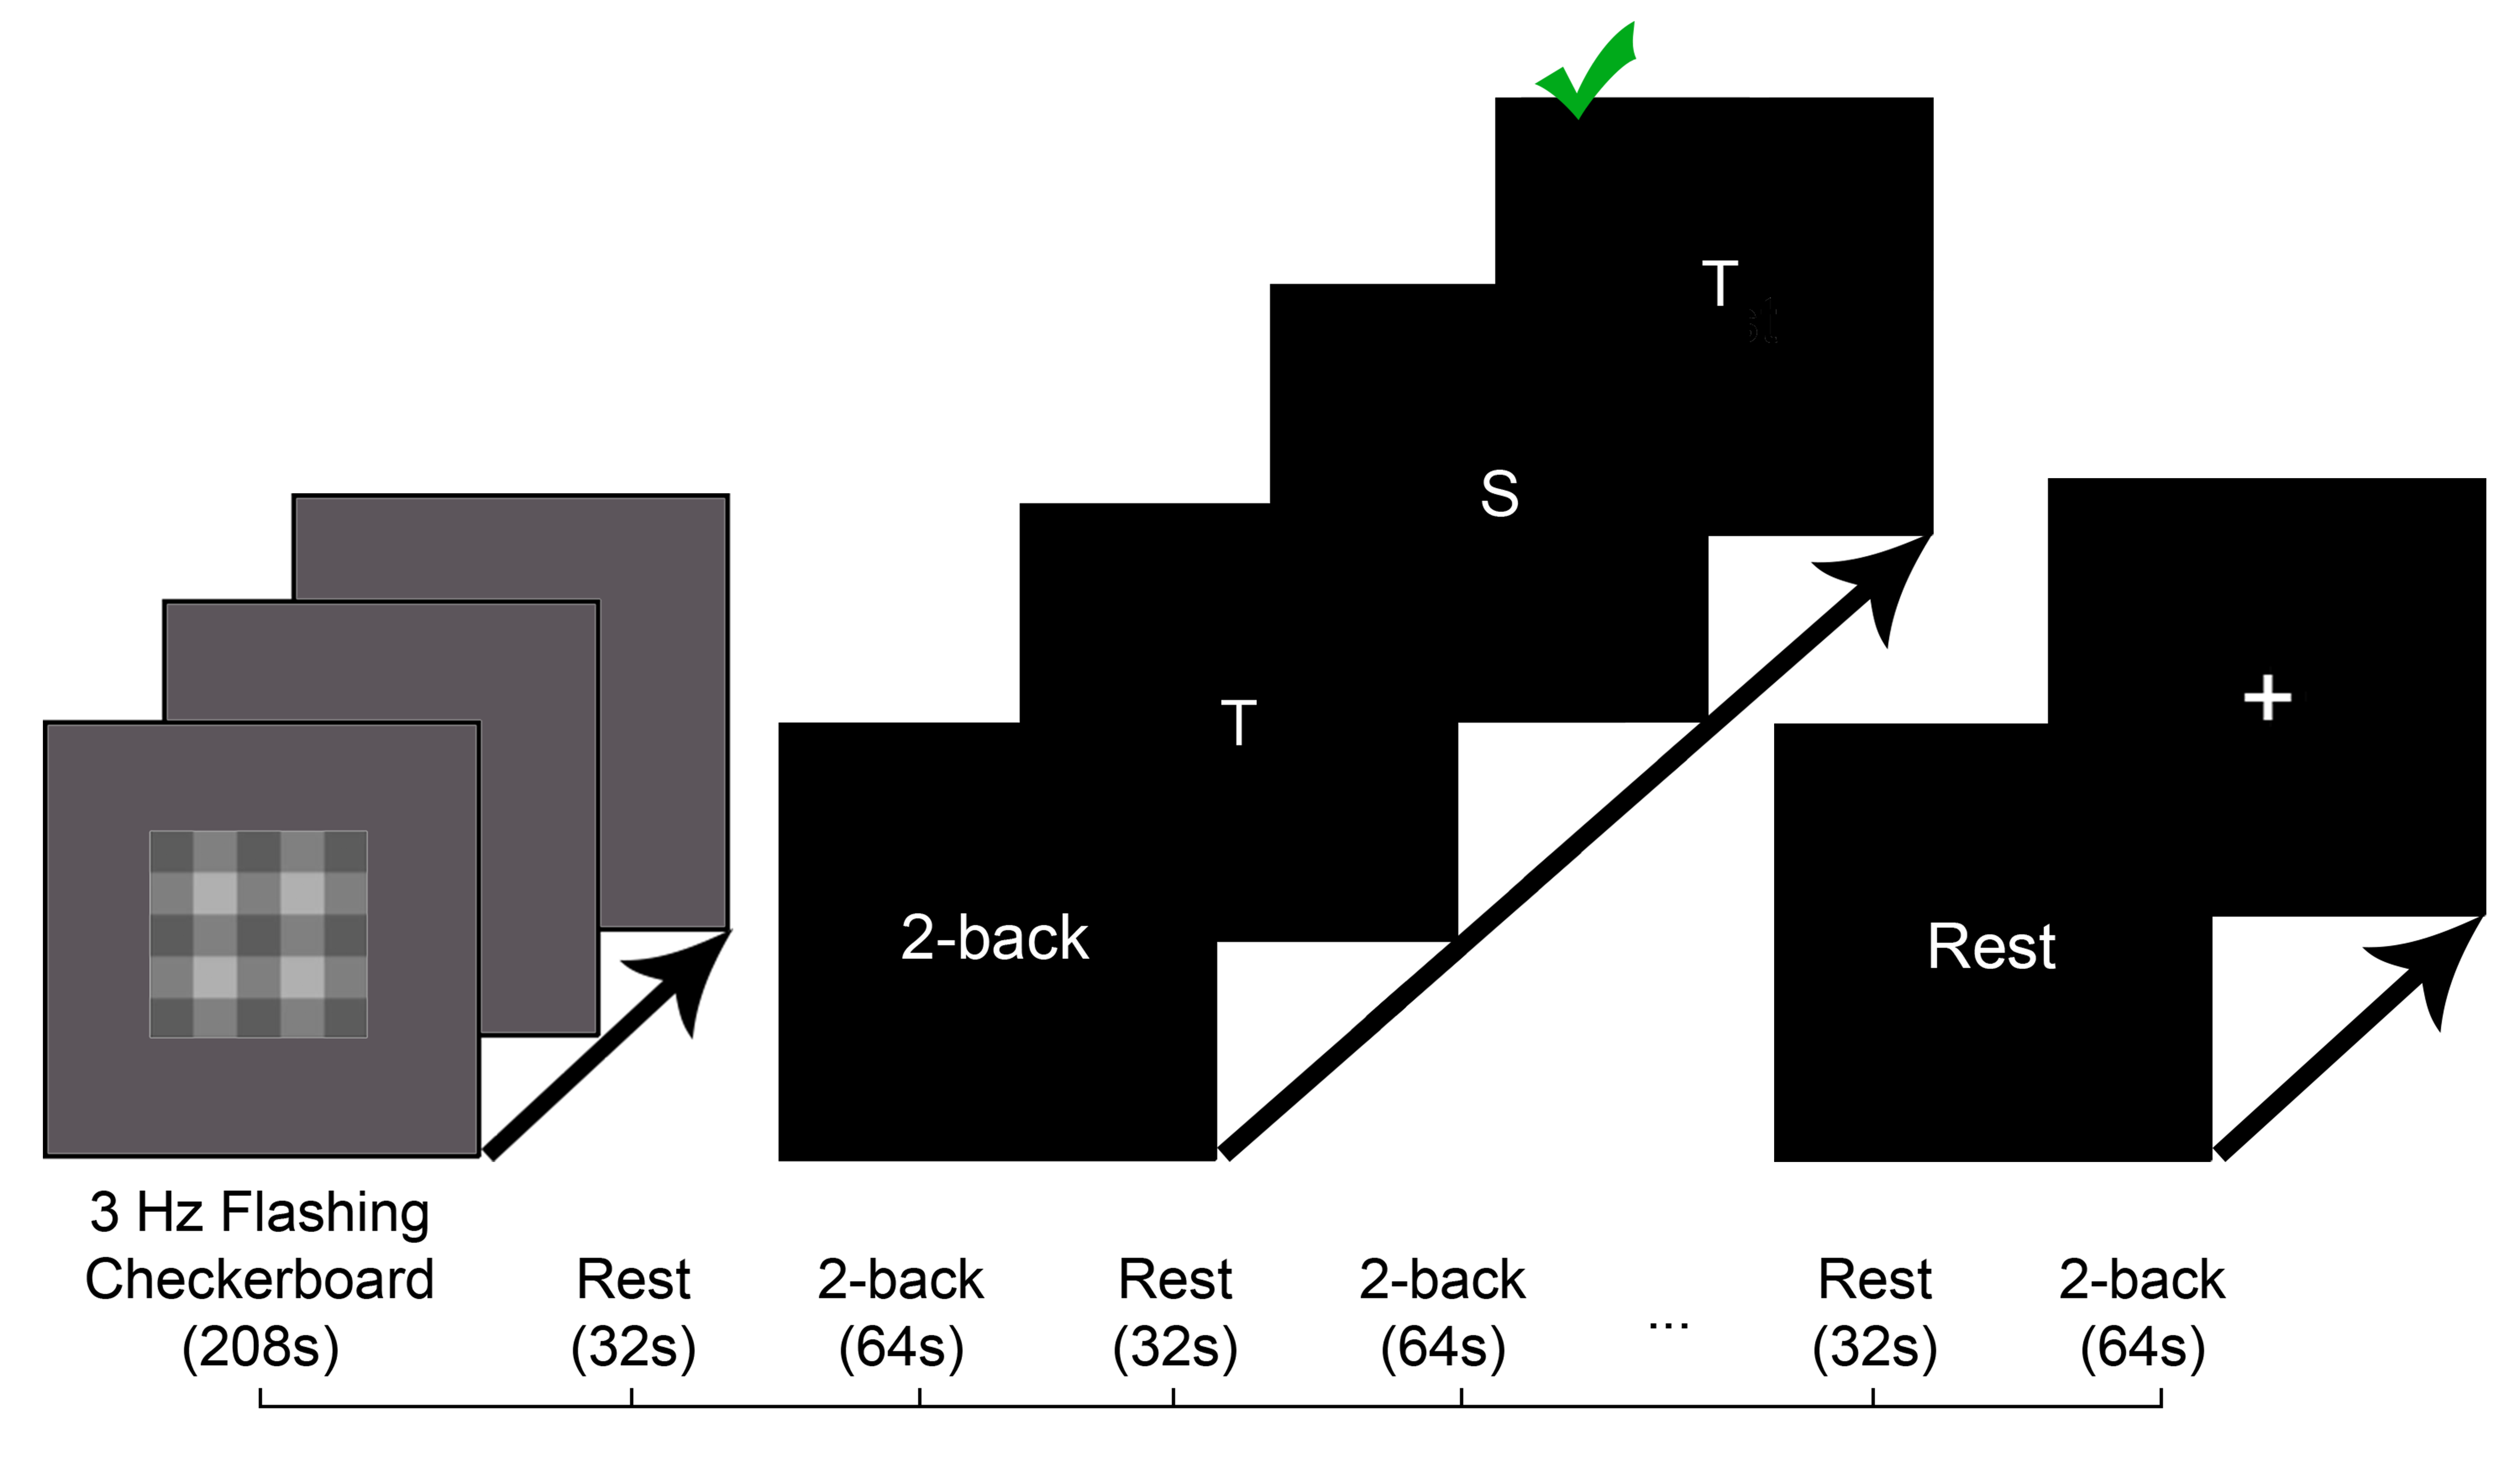
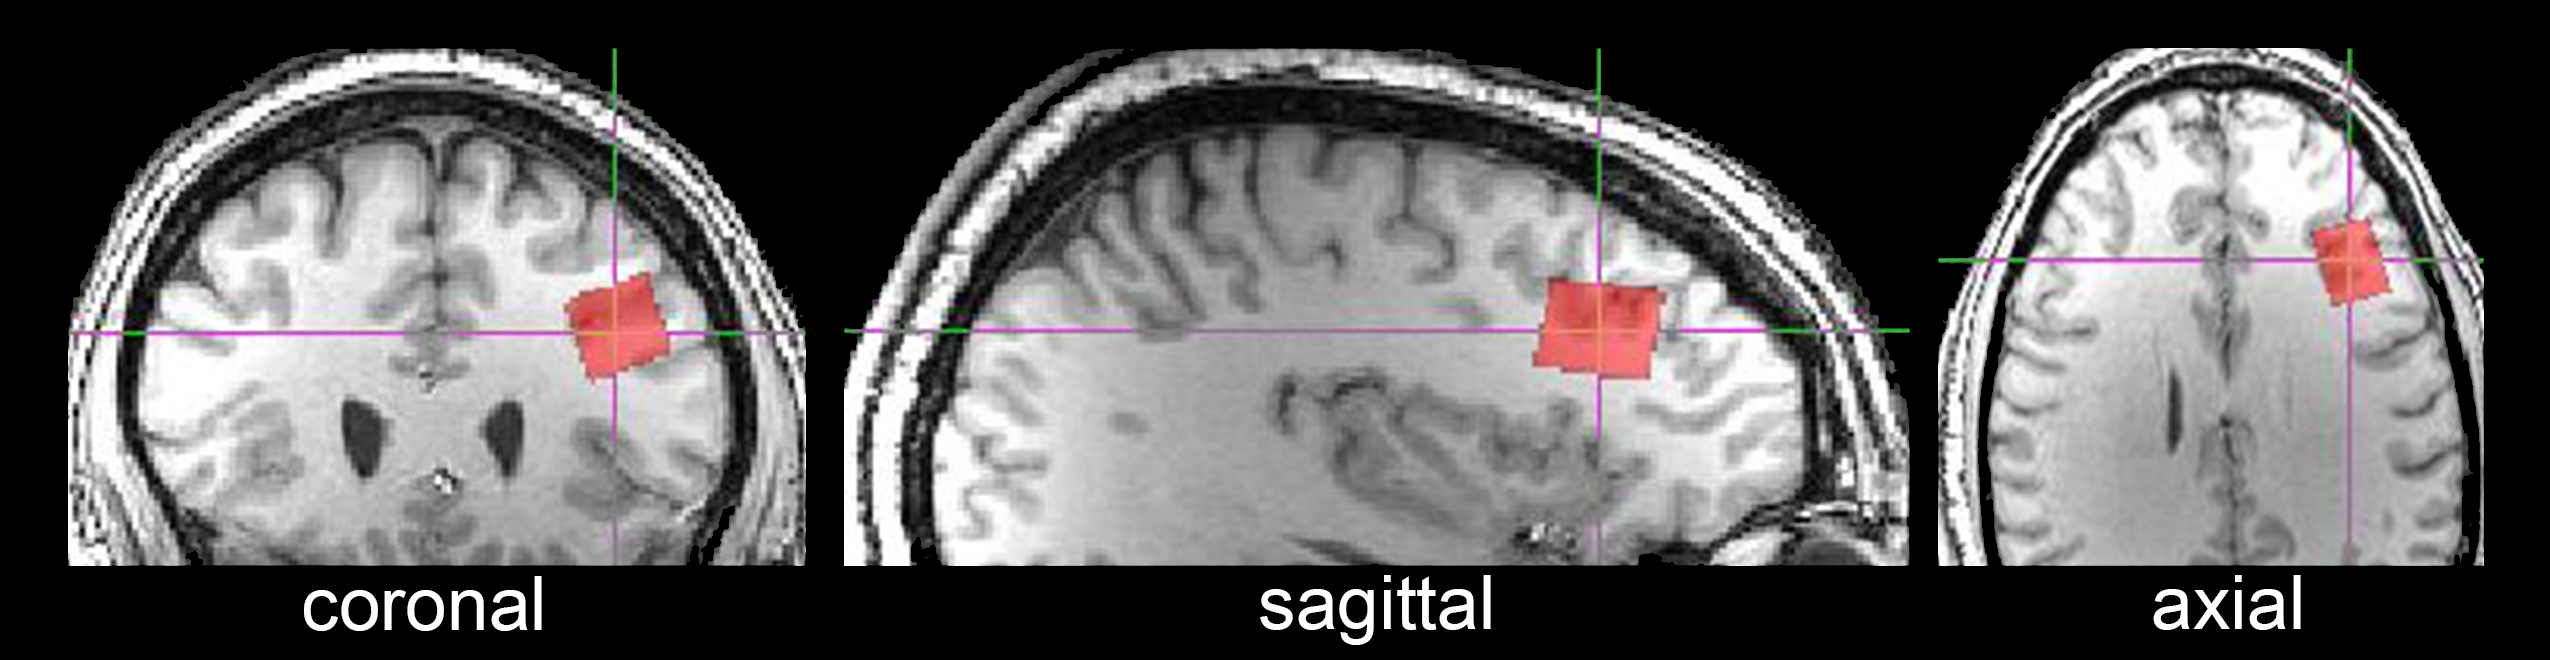
Healthy graduate-level students (N=16; 9 males; mean age: 24.3±3.5 years) completed a single 1H fMRS scan in the morning (between 9:30-11:30am). The experimental task (Figure 1) consisted of a flashing checkerboard (3Hz; 208s) followed by six repetitions of alternating periods of fixation cross rest (32s total: 2s/instructions, 30s static fixation cross) and letter 2-back (64s total: 4s/instructions, 3s/letter, 20 letters). Prior research in our laboratory indicated that flashing checkerboard induced stable glutamate levels (minimized variance) in the dlPFC (unpublished data). It is critical to minimize glutamate signal variability prior to cognitive task manipulations in order to decrease likelihood of Type I error. Following a structural T1-weighted scan (MPRAGE), a single-voxel (15x20x15mm) was prescribed in the left dlPFC (Figure 2) using the AVP approach4 followed by B0-field shimming using FASTESTMAP. 1H fMRS spectra (N=55) were continuously acquired every 16s (PRESS with OVS and VAPOR, TE=23ms, TR=4.0s, 4 averages/spectrum; 2048 data points) during task (total time: 672s). Prior to quantification, consecutive spectra were paired by averaging the signal to give the 32s temporal resolution. LCModel (version 6.3) was used to quantify the metabolite levels without absolute quantification. Repeated measures analyses of variance (rmANOVA) and paired-samples t-tests were used to contrast mean glutamate levels during the task vs. rest conditions across task blocks. Descriptive statistics are presented mean ±1 standard deviation unless otherwise noted.RESULTS:
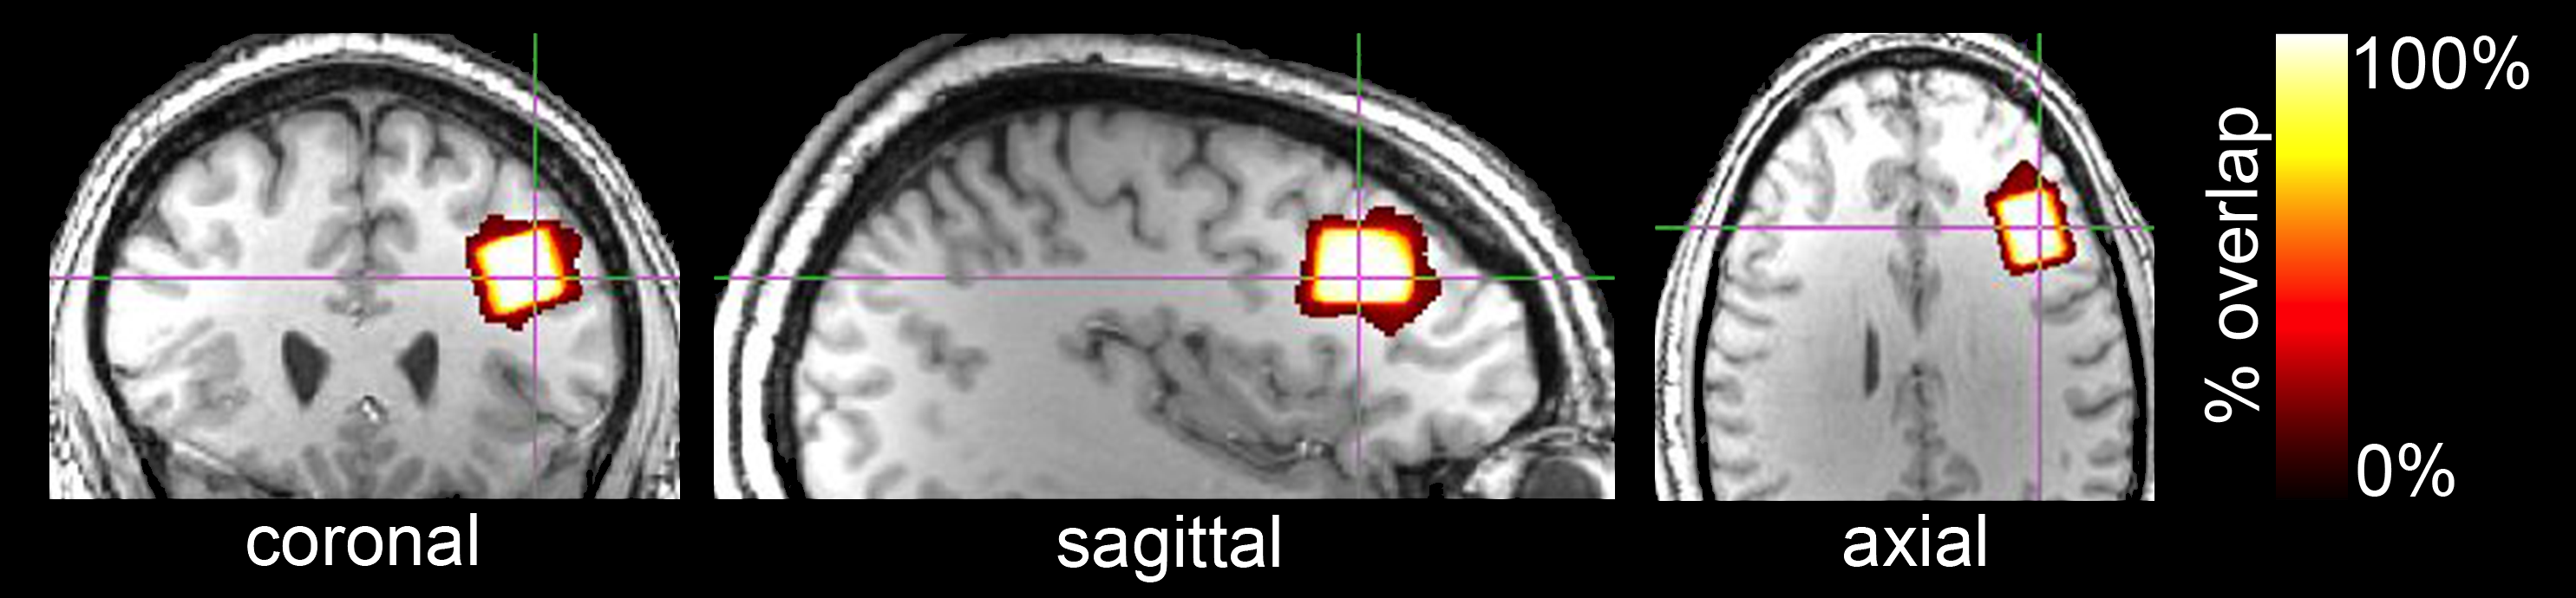
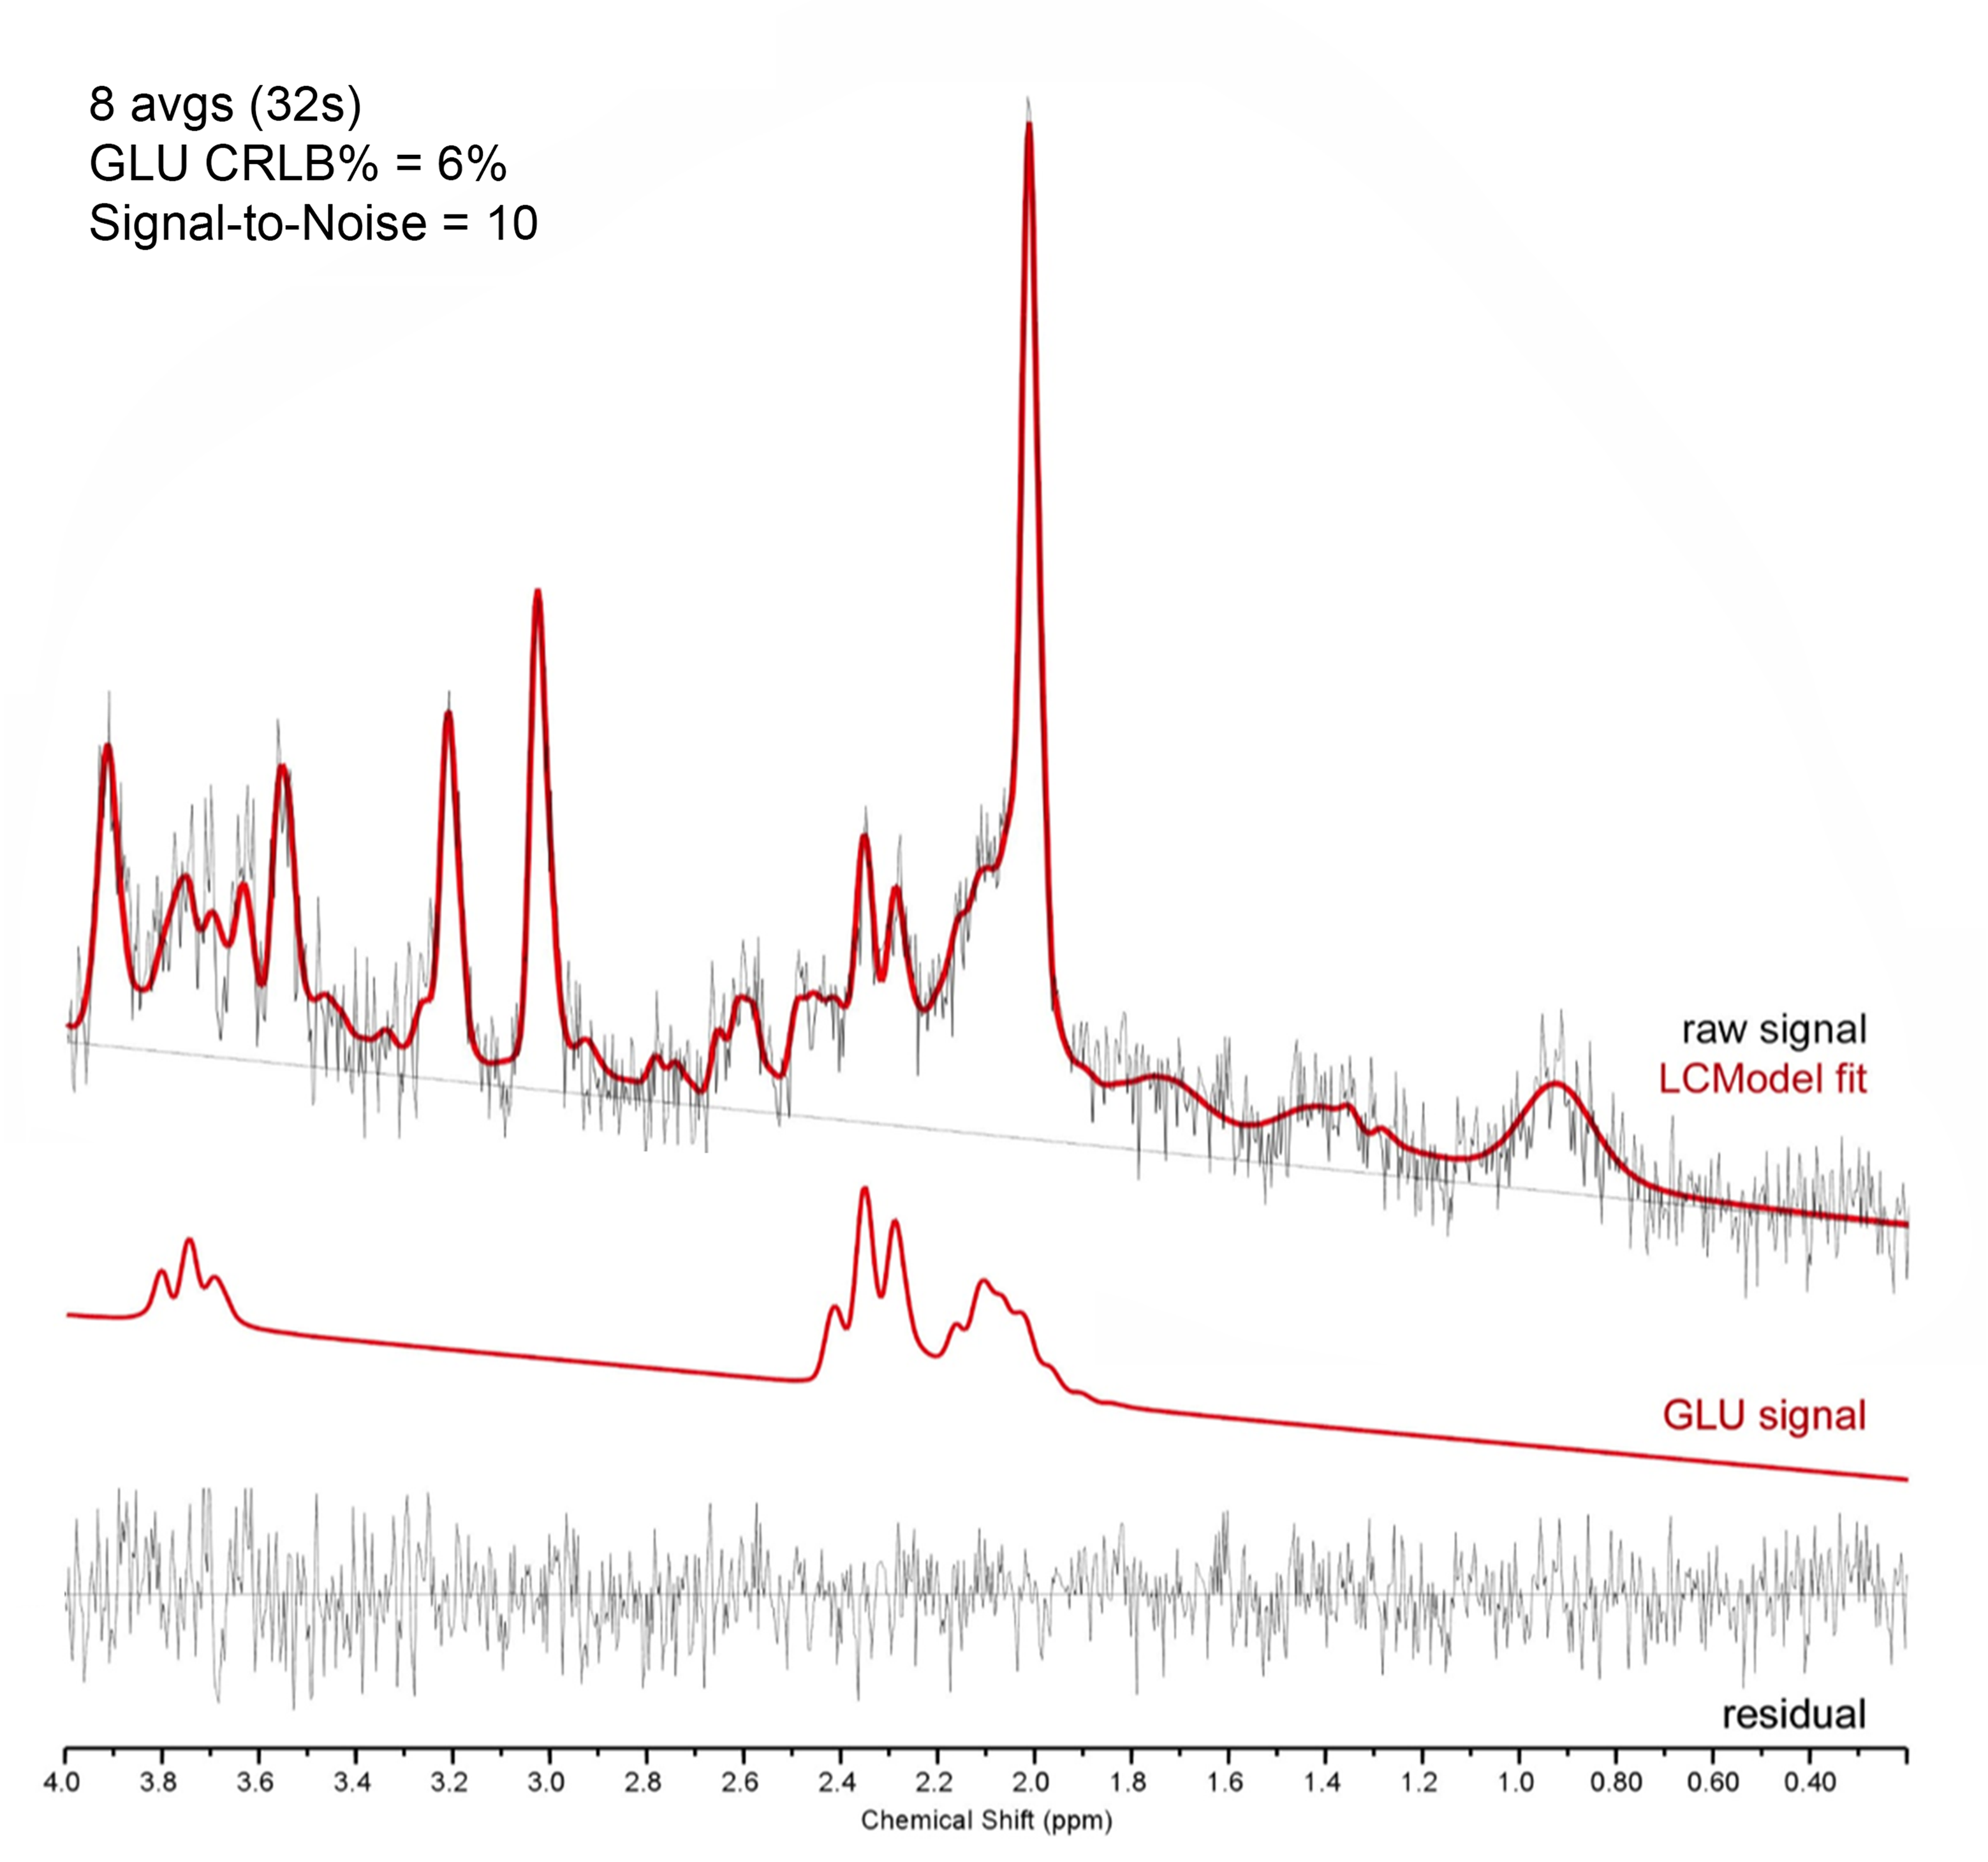
Geometric voxel overlap indicated highly accurate (mean percent overlap with the template voxel = 92.3%) and reliable voxel placement across subjects (mean percent overlap across all subjects = 88.6%; Figure 3)4. Mean voxel tissue composition was 36.8±3.8% gray and 60.8±4.5% white matter. LCModel reliably quantified glutamate levels (Figure 4); mean signal-to-noise [11.8±2.2], full-width half-maximum [4.7±1.1Hz], and Cramer-Rao lower bounds [6.8±1.1%)]. Behavioral data demonstrated task compliance [94.8±10.7% mean correct; 644±171ms mean reaction time]. rmANOVA indicated a significant Time and ‘trend-level’ Time by Condition (task vs. rest) interaction effect for glutamate levels across task blocks [F(5,150) = 3.12, p < .05 and F(5,150) = 2.28, p = .07, respectively]. There was no main effect for Condition (p = .96). Follow-up paired t-tests indicated that mean glutamate levels during task were significantly higher than rest (2.6% higher) during the first three task blocks, t(47) = 2.30, p < .05, and non-significantly lower (1.8%) during the final three task blocks, t(47) = 1.65, p = .11 (Figure 5). No other metabolite levels (NAA, PCr+Cr, myo-inositol or GPC+PC) differed as a function of task (p > .30).DISCUSSION:
Results demonstrated that the 2-back ¹H fMRS paradigm was feasible and LCModel quantification of metabolite levels at 32s temporal resolution was reliable. Our findings demonstrated for the first time that working memory task performance was associated with elevated glutamate levels in the dlPFC relative to rest. Elevated glutamate levels likely reflected increased excitatory neurotransmission due to oxidative metabolism during 2-back performance relative to fixation cross rest. Further, our results demonstrated that task-related modulation was specific to glutamate, as no other metabolites differed by task condition. Spectra fit quality prohibited examination of glutamine levels, but exploratory analyses demonstrated that glutamate+glutamine levels didn’t differ by task during the first three task blocks (p > .30) or any individual block (p > .10). The effect of 2-back performance on glutamate levels appears to be time-limited (present during the first three task blocks only). The authors speculate that subjects mastered the task and no longer required substantial dlPFC engagement to accurately complete it. Behavioral data support this hypothesis: mean reaction time decreased (p = .02), and accuracy increased (p = .03), across task blocks.CONCLUSION:
Elevated glutamate levels in the dlPFC during 2-back task performance (relative to periods of rest) likely reflect increased oxidative metabolism due to excitatory neurotransmission.Acknowledgements
Funding generously provided by NIDA (F31 DA040369; awarded to EAW), Wayne State University School of Medicine (New Investigator Grant; awarded to EAW), State of Michigan (Joe Young Sr./Helene Lycaki funds), and the Detroit Wayne Mental Health Authority.References
1. Mangia S, Tkác I, Gruetter R, Van de Moortele P-F, Maraviglia B, Ugurbil K. Sustained neuronal activation raises oxidative metabolism to a new steady-state level: evidence from 1H NMR spectroscopy in the human visual cortex. Journal of Cerebral Blood Flow & Metabolism 2006;27(5):1055-1063.
2. Schaller B, Mekle R, Xin L, Kunz N, Gruetter R. Net increase of lactate and glutamate concentration in activated human visual cortex detected with magnetic resonance spectroscopy at 7 tesla. Journal of neuroscience research 2013;91(8):1076-1083.
3. Mangia S, Giove F, DiNuzzo M. Metabolic pathways and activity-dependent modulation of glutamate concentration in the human brain. Neurochemical research 2012;37(11):2554-2561.
4. Woodcock EA, Arshad M, Khatib D, Stanley JA. Automated Voxel Placement: A Linux-based Suite of Tools for Accurate and Reliable Single Voxel Coregistration. 2017. Manuscript in preparation.
Figures