0402
Functional Magnetic Resonance Spectroscopy (fMRS) using metabolite cycled semi-LASER at 9.4T: a pilot study1High Field Magnetic Resonance, Max Planck Institute for Biological Cybernetics, Tuebingen, Germany, 2Graduate School of Neural and Behavioural Sciences, Tuebingen, Germany, 3Departments of Radiology and Clinical Research, University Bern, Bern, Switzerland, 4Institute for Biomedical Engineering, UZH and ETH Zurich, Zurich, Switzerland, 5Institute of Physics, Ernst-Moritz-Arndt University Greifswald, Greifswald, Germany
Synopsis
The purpose of this work is to explore the potentials of fMRS under a visual stimulation at 9.4T using a metabolite cycled (MC) semi-LASER sequence. The MC technique allows for simultaneous acquisition of water and metabolite spectra enabling the synchronous investigation of dynamic alternations of BOLD signal and metabolite levels. Correlation of FWHMCr and FWHMNAA with SNRwater is demonstrated. The influence of misaligned subtraction is evaluated and the requirement of linewidth,
Purpose
Ultra high field (UHF) proton spectroscopy benefits from the higher signal to noise ratio (SNR) and the increased chemical shift dispersion which leads to better spectral resolution. This is why several studies utilize the advantages of 7T to investigate the dynamic changes of brain metabolites (fMRS) under different types of functional stimulation1-5. However, next to lactate (Lac) and glutamate (Glu) increase that was reported by all previous studies1-5 additional metabolite changes (glucose3,4, aspartate3,2, glutamine2 and glycine2 decrease and GSH2 increase) have been reported in an inconsistent manner. Thus, the purpose of this work is to exploit the even higher sensitivity of a metabolite cycled (MC) semi-LASER sequence6,7 applied at 9.4T for fMRS under visual stimulation to verify previous results with regard to these additional metabolic adaptations. The MC technique also allows for simultaneous acquisition of water and metabolite spectra (Fig. 1) enabling the synchronous investigation of dynamic alternations of BOLD effect and metabolite levels.Methods
All measurements were performed on a 9.4T whole-body MRI scanner (Siemens Healthcare, Germany) using a home-built proton 4-channel transceiver coil8. Five volunteers participated in this study. A visual stimulus consisted of a radial red-black checkerboard that flickered with 10 Hz (ON), alternating with a black screen (OFF; Fig. 2) was applied. During the stimulation, fMRS data were acquired from a voxel (2x2x2 cm3) in the occipital lobe using MC semi-LASER sequence7 (TE/TR: 24/6000 ms). Totally, 244 averages were acquired for each subject during a stimulation period of 22'24''. Bo-shimming using FASTE(ST)MAP9 and voxel-based power calibration10 were applied. Neither water suppression nor outer volume suppression (OVS) was implemented. fMRS data were processed11 and analyzed . The SNR of water(SNRwater) and linewidths of water (FWHMwater), NAA (FWHMNAA) were also calculated and correlated (Fig. 3). FIDs for each volunteer were averaged in 14 blocks (16 averages each) and were summed together (NEXblock = 80). All the acquisitions of OFF and ON periods across volunteers were summed together forming two blocks of 610 averages each (Fig. 2). Next, the OFF block was multiplied with correction factors for linewidth using a lorentzian function, frequency shift and zero order phase (Fig. 4). Then it was subtracted from the ON block to systematically evaluate the influence of these three factors to the difference spectrum in order to minimize residual BOLD effects (Fig.4). Finally, potential differences in metabolites concentrations are investigated using the optimized correction scheme by visual inspection and LCmodel quantification of difference spectra (Fig. 5).
Results
The resulting spectra demonstrate a high reliability and reproducibility of the spectral acquisitions both in the upfield and downfield frequency range(Fig. 2). An increase in Cr and NAA amplitude is observed due to the BOLD effect12. The SNR of the acquisitions enables the investigation of changes also in the downfield part of the spectrum where alterations between ON and OFF blocks in metabolite levels at about 8.5, 8 and 6.1 ppm are detected. The pattern of SNRwater acquired using the MC technique follows the stimulation paradigm and reflects the BOLD effect equivalent to fMRI studies. High correlation-coefficients between the changes of SNRwater and FWHMwater (R= -0.95), between FHWMNAA and SNRwater (R= -0.80), as well as, between FHWMNAA and FWHMwater (R= 0.84) are found. Subtraction results(Fig. 4) show that appropriate linewidth, frequency shift and zero-order phase correction are necessary to minimize the BOLD effect as reflected by residual NAA and Cr peaks before the subtraction of ON and OFF blocks. Even a small frequency shift or linewidth difference can introduce significant residuals in the difference spectrum.
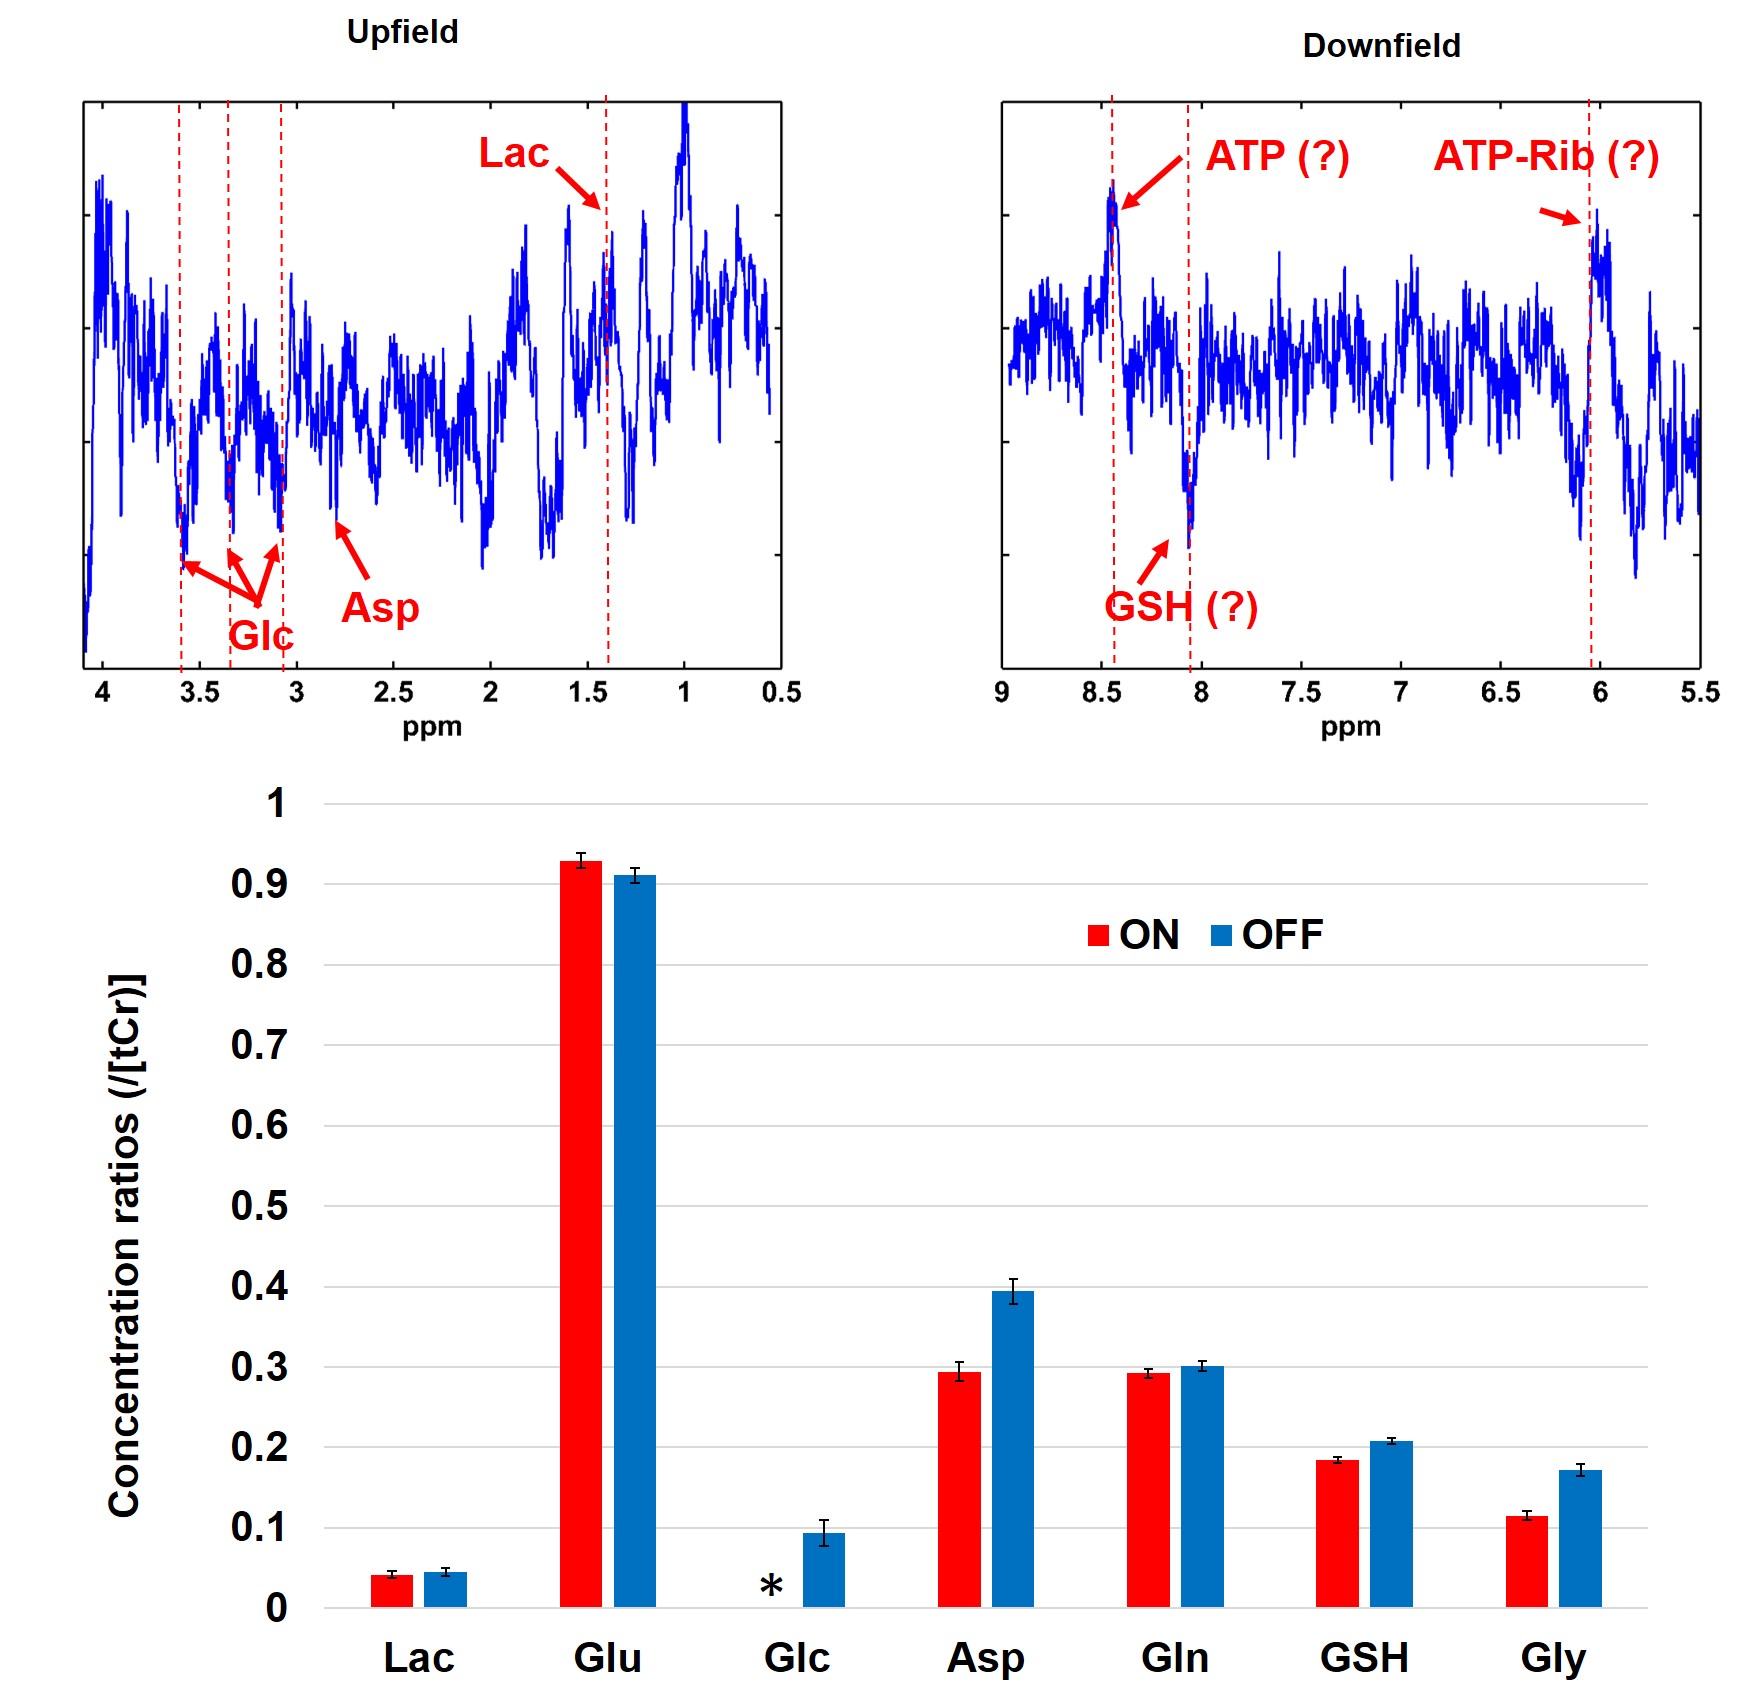
Finally, subtraction using an optimum combination of linewidth and frequency shift correction reveals potential metabolite differences between rest and stimulation period (Fig. 5). Specifically, in the upfield part of the difference spectrum changes are observed which can be assigned to glucose, Asp and Lac (Fig. 5). Interestingly, alternations were also observed in the downfield part which can be assigned for example to ATP and GSH. As indicated on Fig.4, these downfield peak amplitude differences appear consistently proving that they are not a result of inconsistent subtraction.
Discussion-Conclusions
This is the first fMRS study at 9.4T and it confirms all previously detected metabolic alterations in the visual cortex. For the first time differences of downfield metabolites upon functional stimulation are observed. Correlation of FWHMwater and FWHMNAA with SNRwater shows that linewidth changes are the result of the BOLD effect. The influence of misaligned subtraction is evaluated and it is highlighted that not only linewidth-correction is needed for a subtraction based analysis. More datasets will be acquired to fully verify and confirm these results.Acknowledgements
No acknowledgement found.References
1. Bednarik P, Tkac I, Giove F, DiNuzzo M, Deelchand DK, Emir UE, Eberly LE, Mangia S. Neurochemical and BOLD responses during neuronal activation measured in the human visual cortex at 7 Tesla. J Cereb Blood Flow Metab 2015;35:601-10.
2. Lin Y, Stephenson MC, Xin L, Napolitano A, Morris PG. Investigating the metabolic changes due to visual stimulation using functional proton magnetic resonance spectroscopy at 7 T. J Cereb Blood Flow Metab 2012;32:1484-95.
3. Mangia S, Tkac I, Gruetter R, Van de Moortele PF, Maraviglia B, Ugurbil K. Sustained neuronal activation raises oxidative metabolism to a new steady-state level: evidence from 1H NMR spectroscopy in the human visual cortex. J Cereb Blood Flow Metab 2007;27:1055-63.
4. Schaller B, Mekle R, Xin L, Kunz N, Gruetter R. Net increase of lactate and glutamate concentration in activated human visual cortex detected with magnetic resonance spectroscopy at 7 tesla. J Neurosci Res 2013;91:1076-83.
5. Schaller B, Xin L, O'Brien K, Magill AW, Gruetter R. Are glutamate and lactate increases ubiquitous to physiological activation? A (1)H functional MR spectroscopy study during motor activation in human brain at 7Tesla. Neuroimage 2014;93 Pt 1:138-45.
6. Dreher W, Leibfritz D. New method for the simultaneous detection of metabolites and water in localized in vivo 1H nuclear magnetic resonance spectroscopy. Magn Reson Med 2005;54:190-5. 7. Giapitzakis IA, Kreis R, Henning A. Characterization of the macromolecular baseline with a metabolite-cycled double-inversion recovery sequence in the human brain at 9.4T. 2016; Singapore. 8. Pfrommer A, Avdievich N, Henning A. Four Channel Transceiver Array for Functional Magnetic Resonance Spectroscopy in the Human Visual Cortex at 9.4 T, Joint Annual Meeting ISMRM-ESMRMB. 2014; Milano.
9. Gruetter R, Tkac I. Field mapping without reference scan using asymmetric echo-planar techniques. Magn Reson Med 2000;43:319-23.
10. Versluis MJ, Kan HE, van Buchem MA, Webb AG. Improved signal to noise in proton spectroscopy of the human calf muscle at 7 T using localized B1 calibration. Magnetic Resonance in Medicine 2010;63:207-211.
11. Giapitzakis IA, Shao T, Avdievich N, Kreis R, Henning A. Metabolite cycled semi-LASER in human brain at 9.4T: In-vivo results. ISMRM Workshop on MR Spectroscopy:. 2016; Lake Constance, Germany.
12. Zhu XH, Chen W. Observed BOLD effects on cerebral metabolite resonances in human visual cortex during visual stimulation: a functional (1)H MRS study at 4 T. Magn Reson Med 2001;46:841-7.
Figures
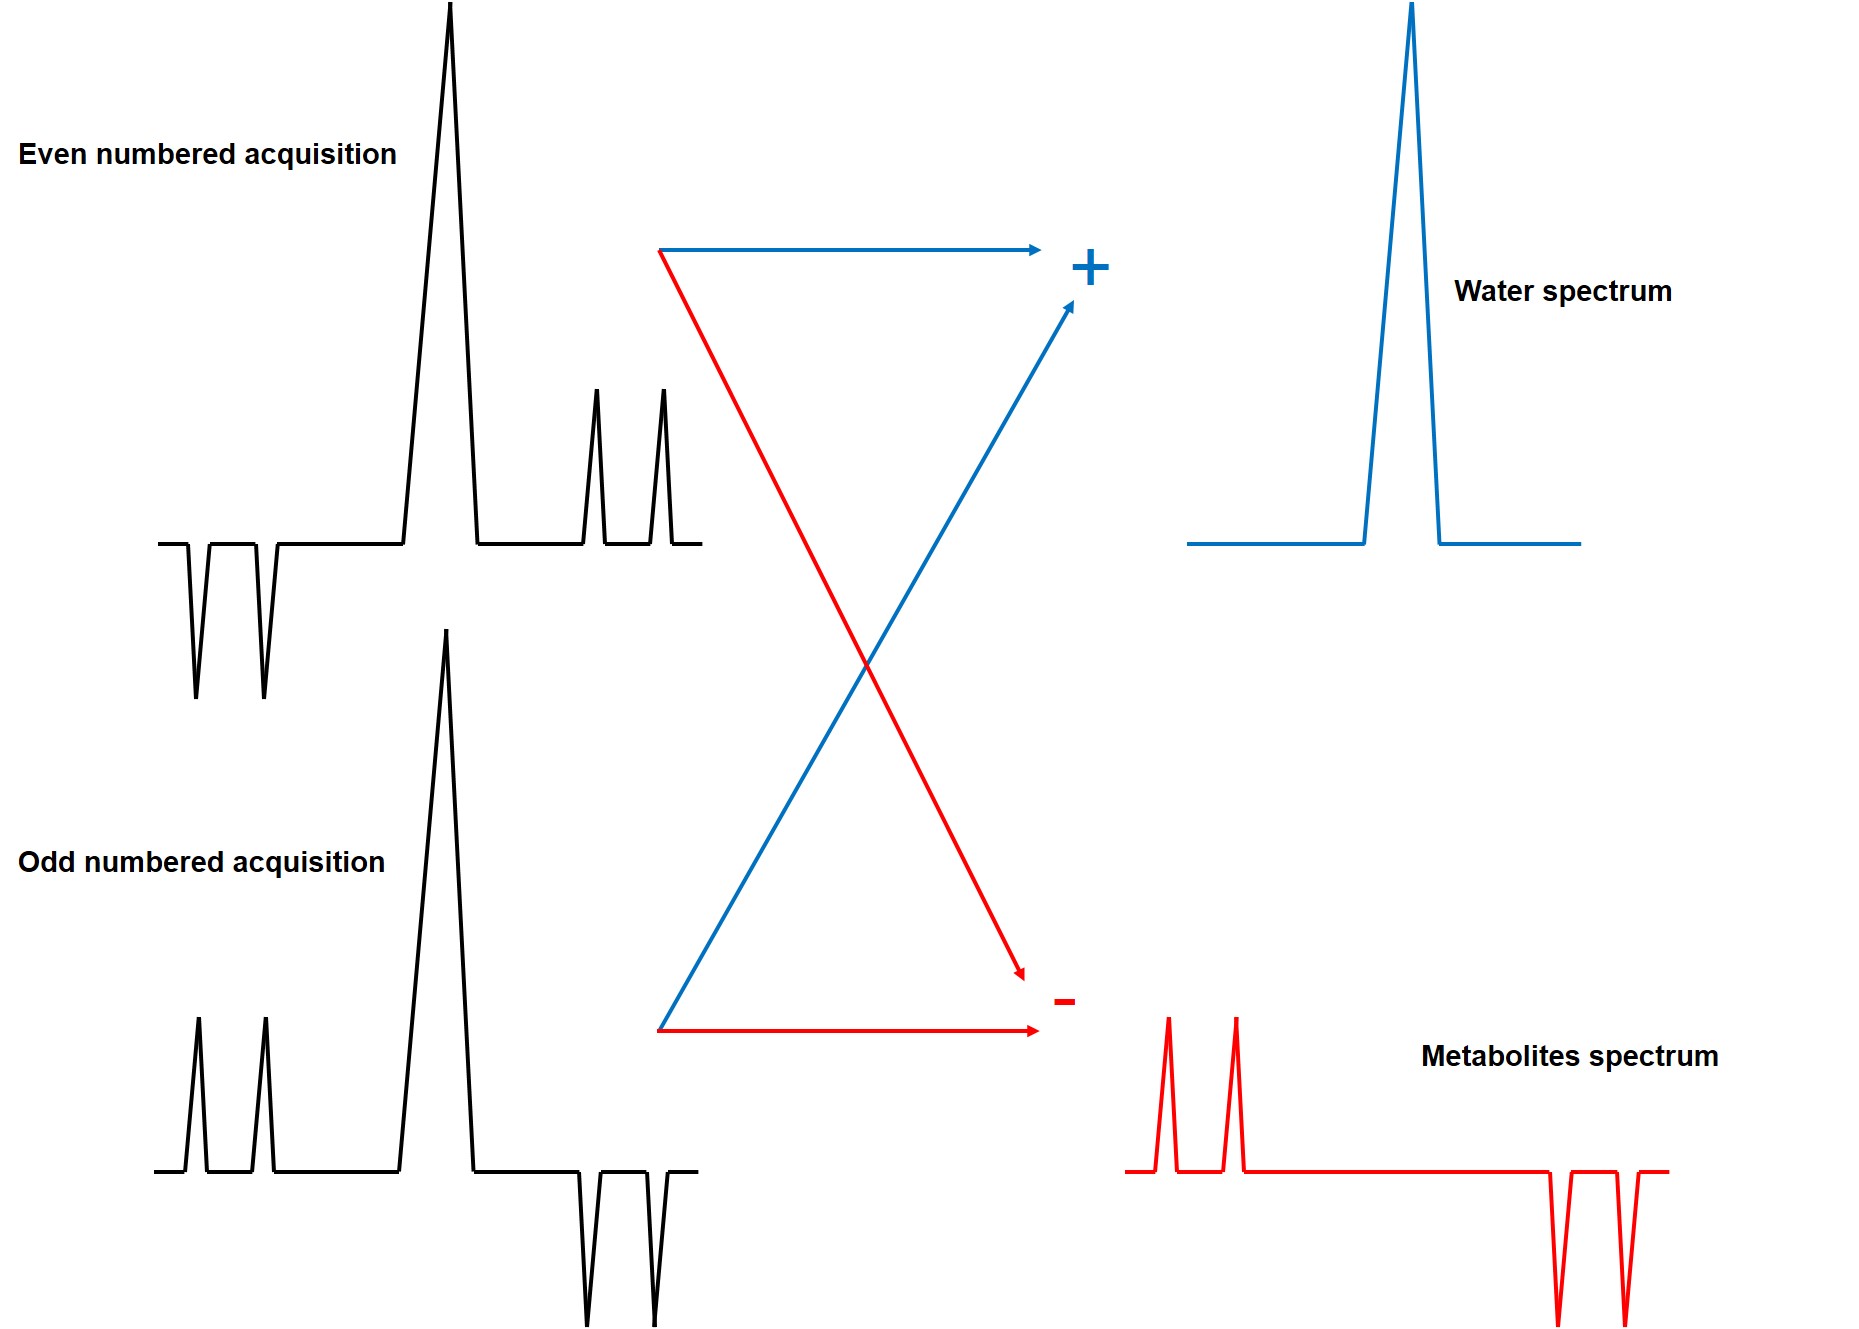
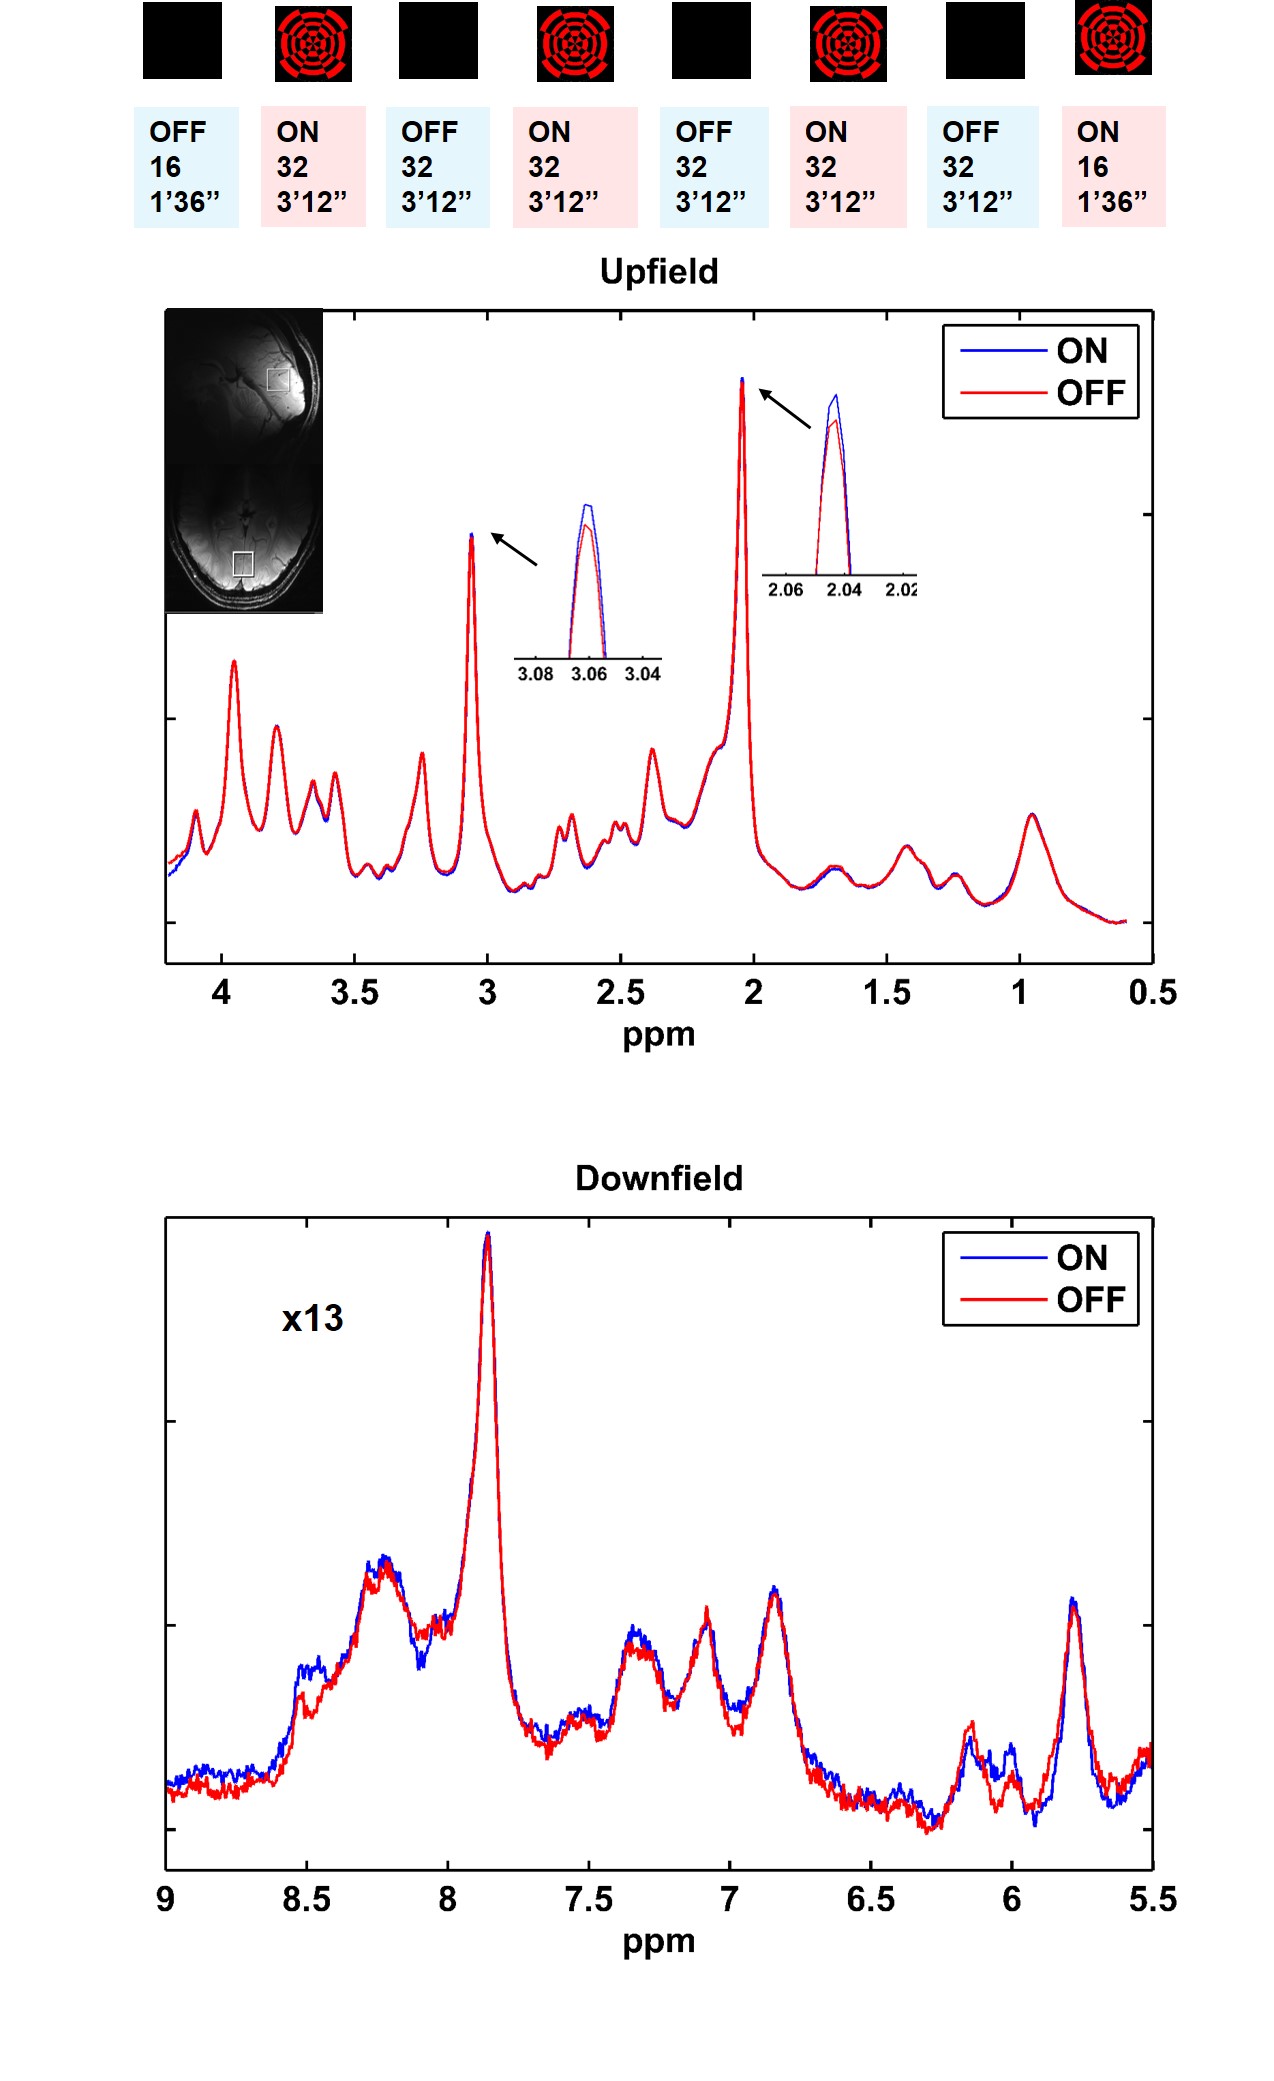

Figure 3: A) SNR alterations of the water signal during the visual stimulus. Red colored strips indicate ON periods while blue indicates OFF periods. MC allows the simultaneous detection of water and metabolite spectra enabling detection of the BOLD effect. B) Correlation of FWHMNAA and SNRwater, C) Correlation of FWHMwater and SNRwater D) Correlation of FWHMwater and FWHMNAA. P and R values indicate p-values for testing the hypothesis of no correlation and correlation coefficients respectively. The high correlation coefficients demonstrate that FWHM changes of NAA and Cr peaks are mainly due to BOLD effect.
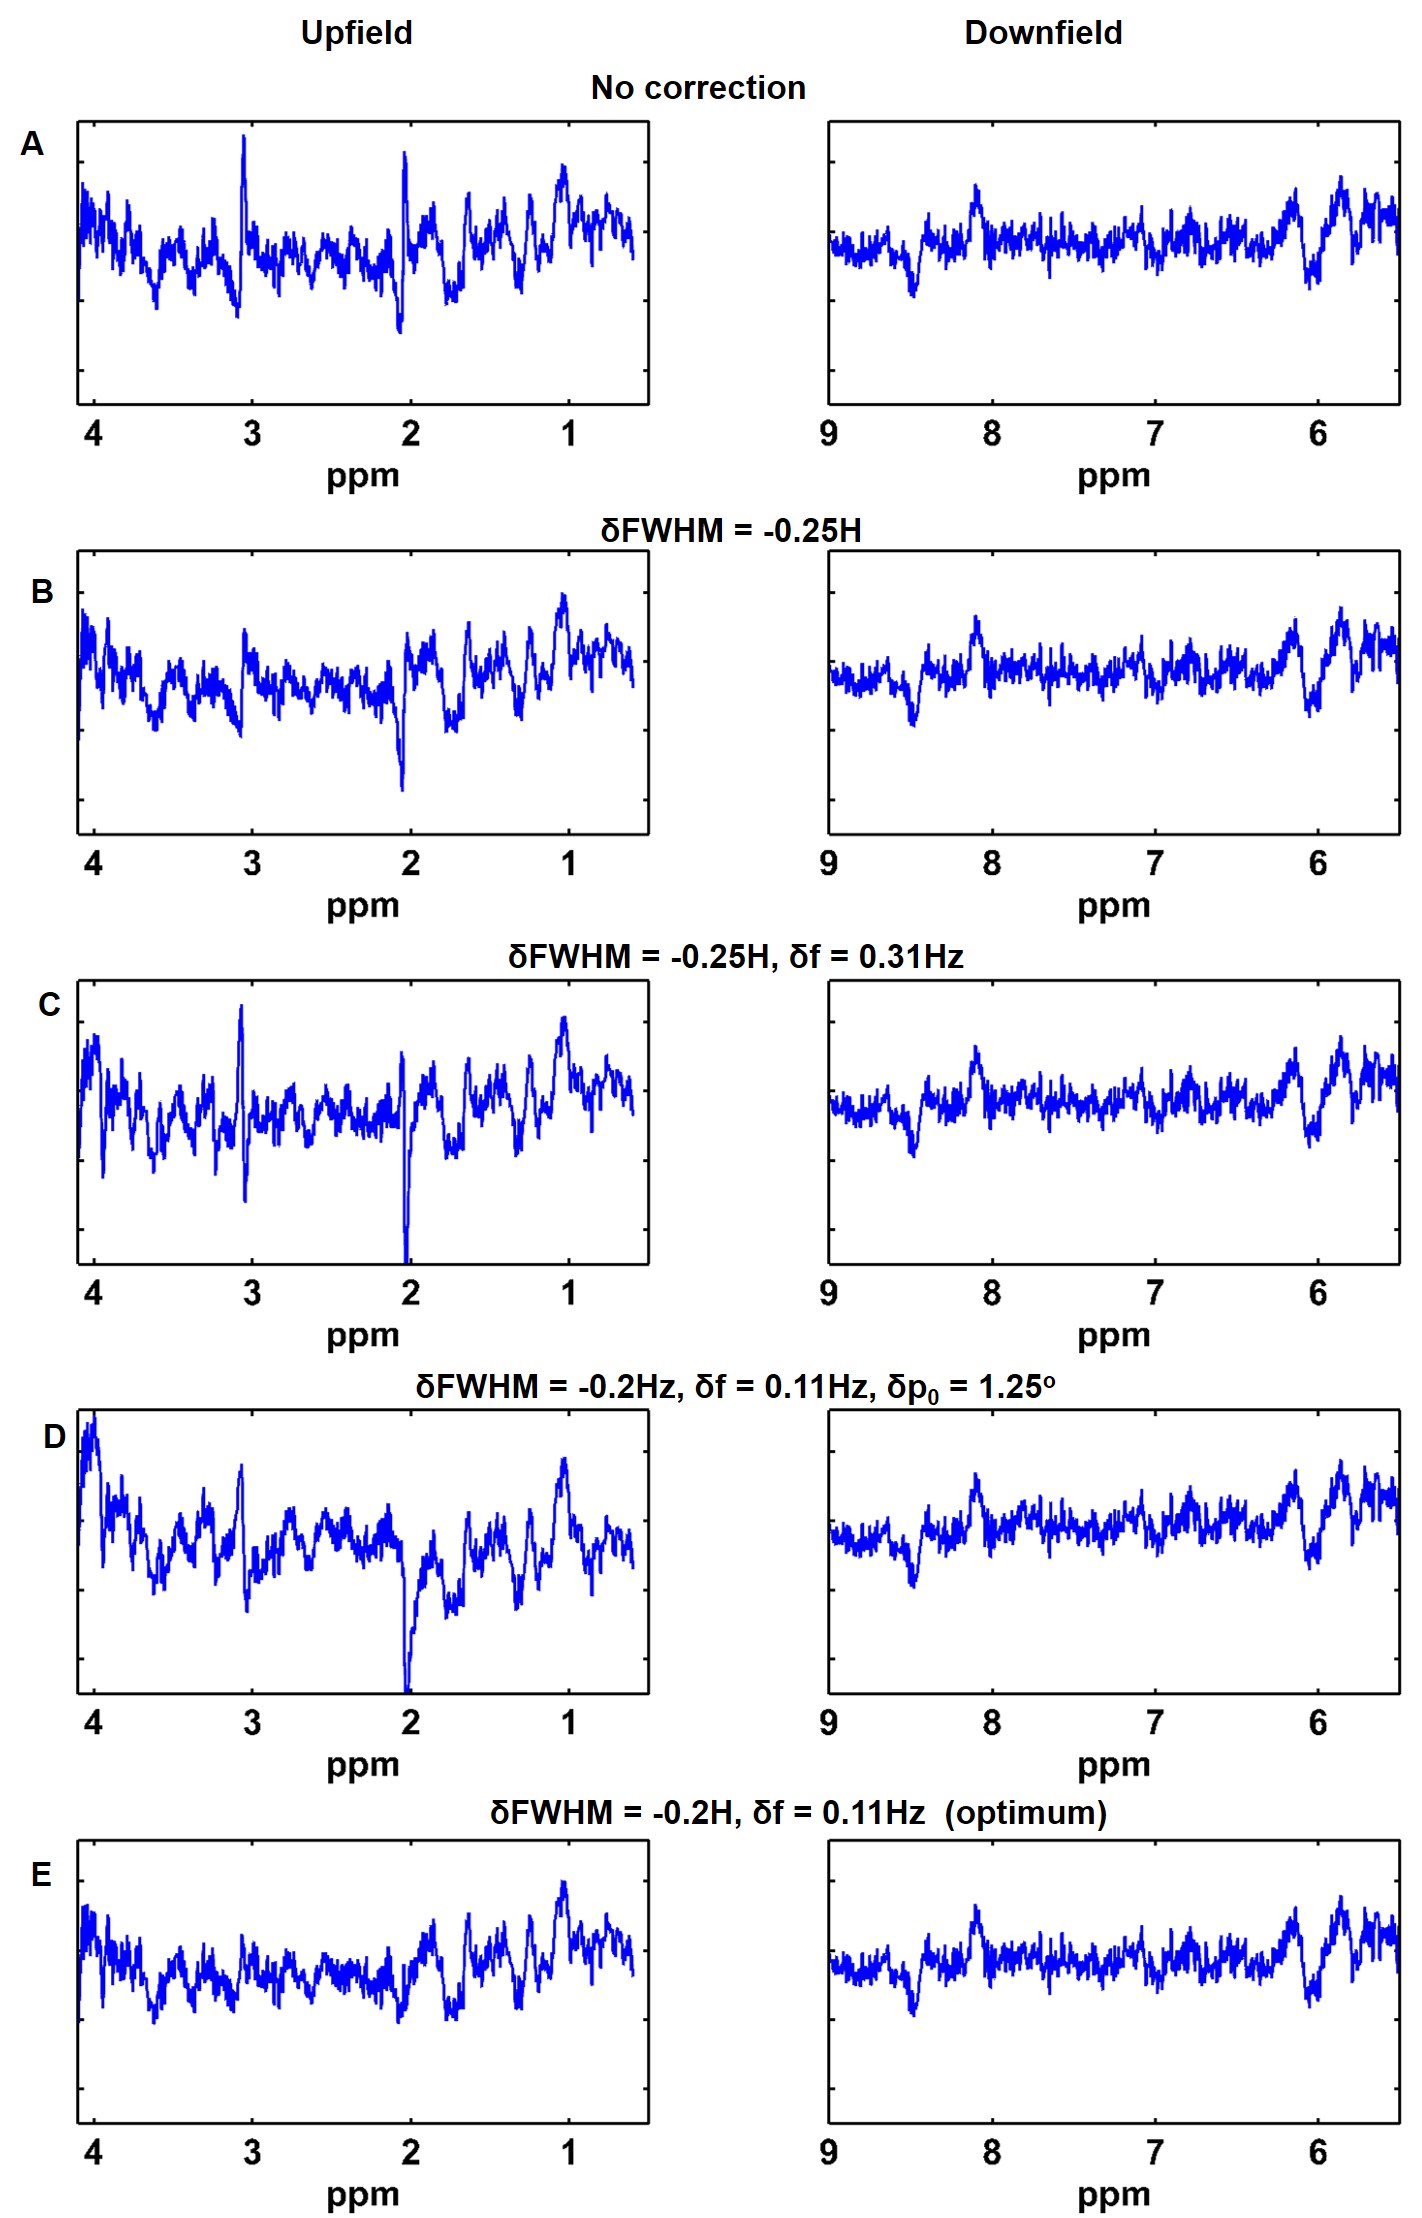
Figure 4: Difference spectra. The OFF block was multiplied with different values of correction factors for linewidth correction(δFWHM) using a lorentzian function, frequency shifts(δf) and zero order phase(δpo) prior to subtraction. Finally, the OFF block was subtracted from the ON block to evaluate the influence of these three factors to the difference spectrum. Even a small frequency shift or linewidth difference can introduce significant residuals induced by the BOLD effect in the difference spectrum. The bottom row shows the difference spectrum for the optimum correction factors.