0399
Effects of transactive response DNA-binding protein 43 (TDP43) pathology on amygdala volume and shape, in a community cohort of older adults1Department of Biomedical Engineering, Illinois Institute of Technology, Chicago, IL, United States, 2Rush Alzheimer's Disease Center, Rush University Medical Center, Chicago, IL, United States, 3Department of Neurological Sciences, Rush University Medical Center, Chicago, IL, United States, 4Department of Pathology, Rush University Medical Center, Chicago, IL, United States, 5Department of Diagnostic Radiology, Rush University Medical Center, Chicago, IL, United States
Synopsis
TDP43 pathology is now recognized as a common and deleterious neuropathology of the aging brain. TDP43 pathology typically originates in the amygdala, which is, however, commonly affected by other age-related neurodegenerative pathologies. The purpose of this work was to investigate the effects of TDP43 pathology on the volume and shape of the amygdala in a large community cohort of older adults.
Purpose
Transactive response DNA-binding protein 43 (TDP43) pathology is the primary protein abnormality in the rare neurodegenerative diseases amyotrophic lateral sclerosis and frontotemporal lobar degeneration1. However, according to recent findings, TDP43 pathology is common in old age, with approximately 50% of older persons showing evidence of the pathology at autopsy2. TDP43 pathology has been reported in up to 55% of those with Alzheimer’s disease pathology3,4, 90% of hippocampal sclerosis cases5, 60% of Lewy body cases3, and in other neurodegenerative diseases6-15, yet has also been detected in normal older persons2. The effect of TDP43 pathology on cognition of older adults is devastating2,16,17. Thus, TDP43 pathology is now recognized as a common and deleterious neuropathology of the aging brain. TDP43 pathology typically originates in the amygdala18, which is, however, commonly affected by other age-related neurodegenerative pathologies19. The purpose of this work was to investigate the effects of TDP43 pathology on the volume and shape of the amygdala in a large community cohort of older adults.Methods
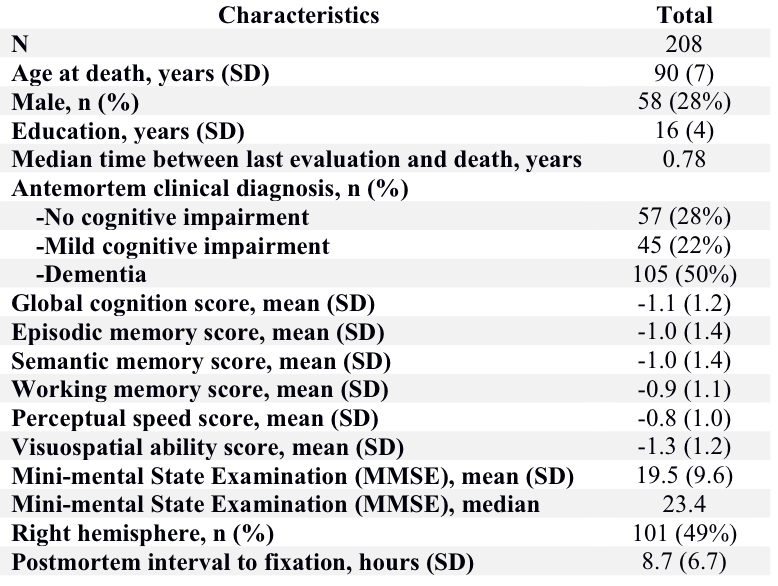
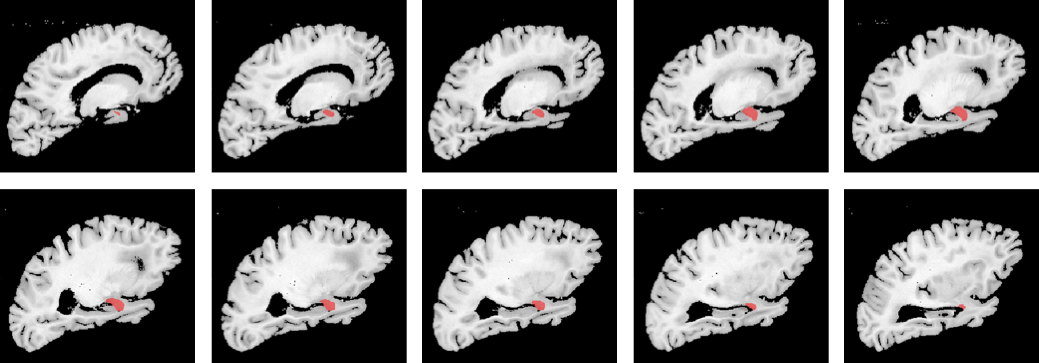
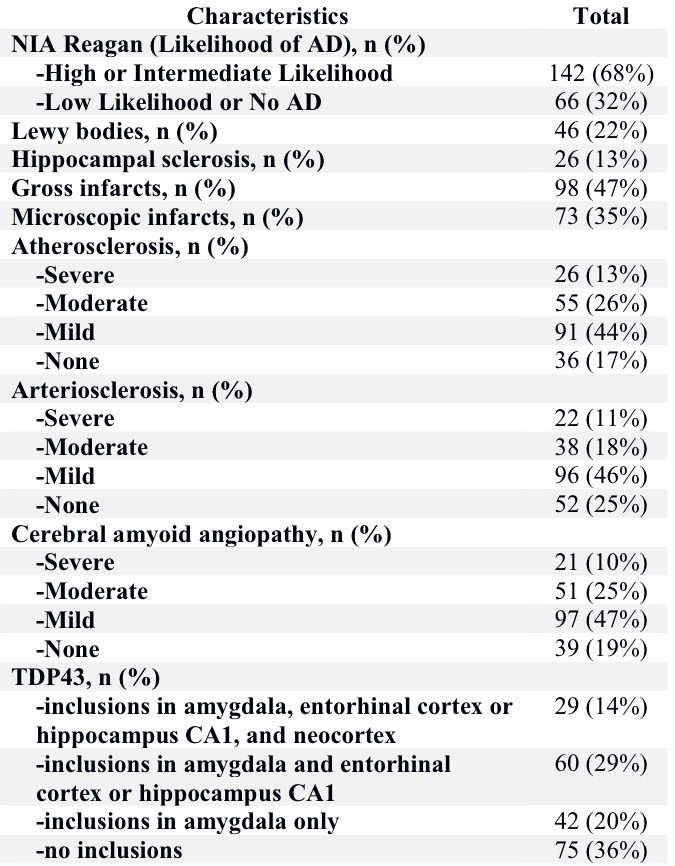
Cerebral hemispheres were obtained from 208 deceased participants of the Rush Memory and Aging Project20 and the Religious Orders Study21, two longitudinal, epidemiologic clinical-pathologic cohort studies of aging (Fig.1). Hemispheres were imaged ex-vivo on a 3T clinical MRI scanner, while immersed in 4% formaldehyde solution, using a 2D spin-echo sequence with multiple echo-times and 0.6 mm3 voxels. An experienced observer blinded to all clinical and pathologic findings manually segmented the amygdala on ex-vivo MR images (Fig.2). For each participant, the volume of the amygdala was measured and normalized by the height of the participant. Following ex-vivo MR imaging, hemispheres underwent neuropathologic examination by a board-certified neuropathologist blinded to all clinical and imaging findings (Fig.3). Multiple linear regression was used to investigate the association of amygdala volume with TDP43, Alzheimer’s pathology, hippocampal sclerosis, Lewy bodies, gross and microscopic infarcts, atherosclerosis, cerebral amyloid angiopathy, and arteriolosclerosis, controlling for age, sex, years of education, postmortem interval to fixation, and postmortem interval to imaging.
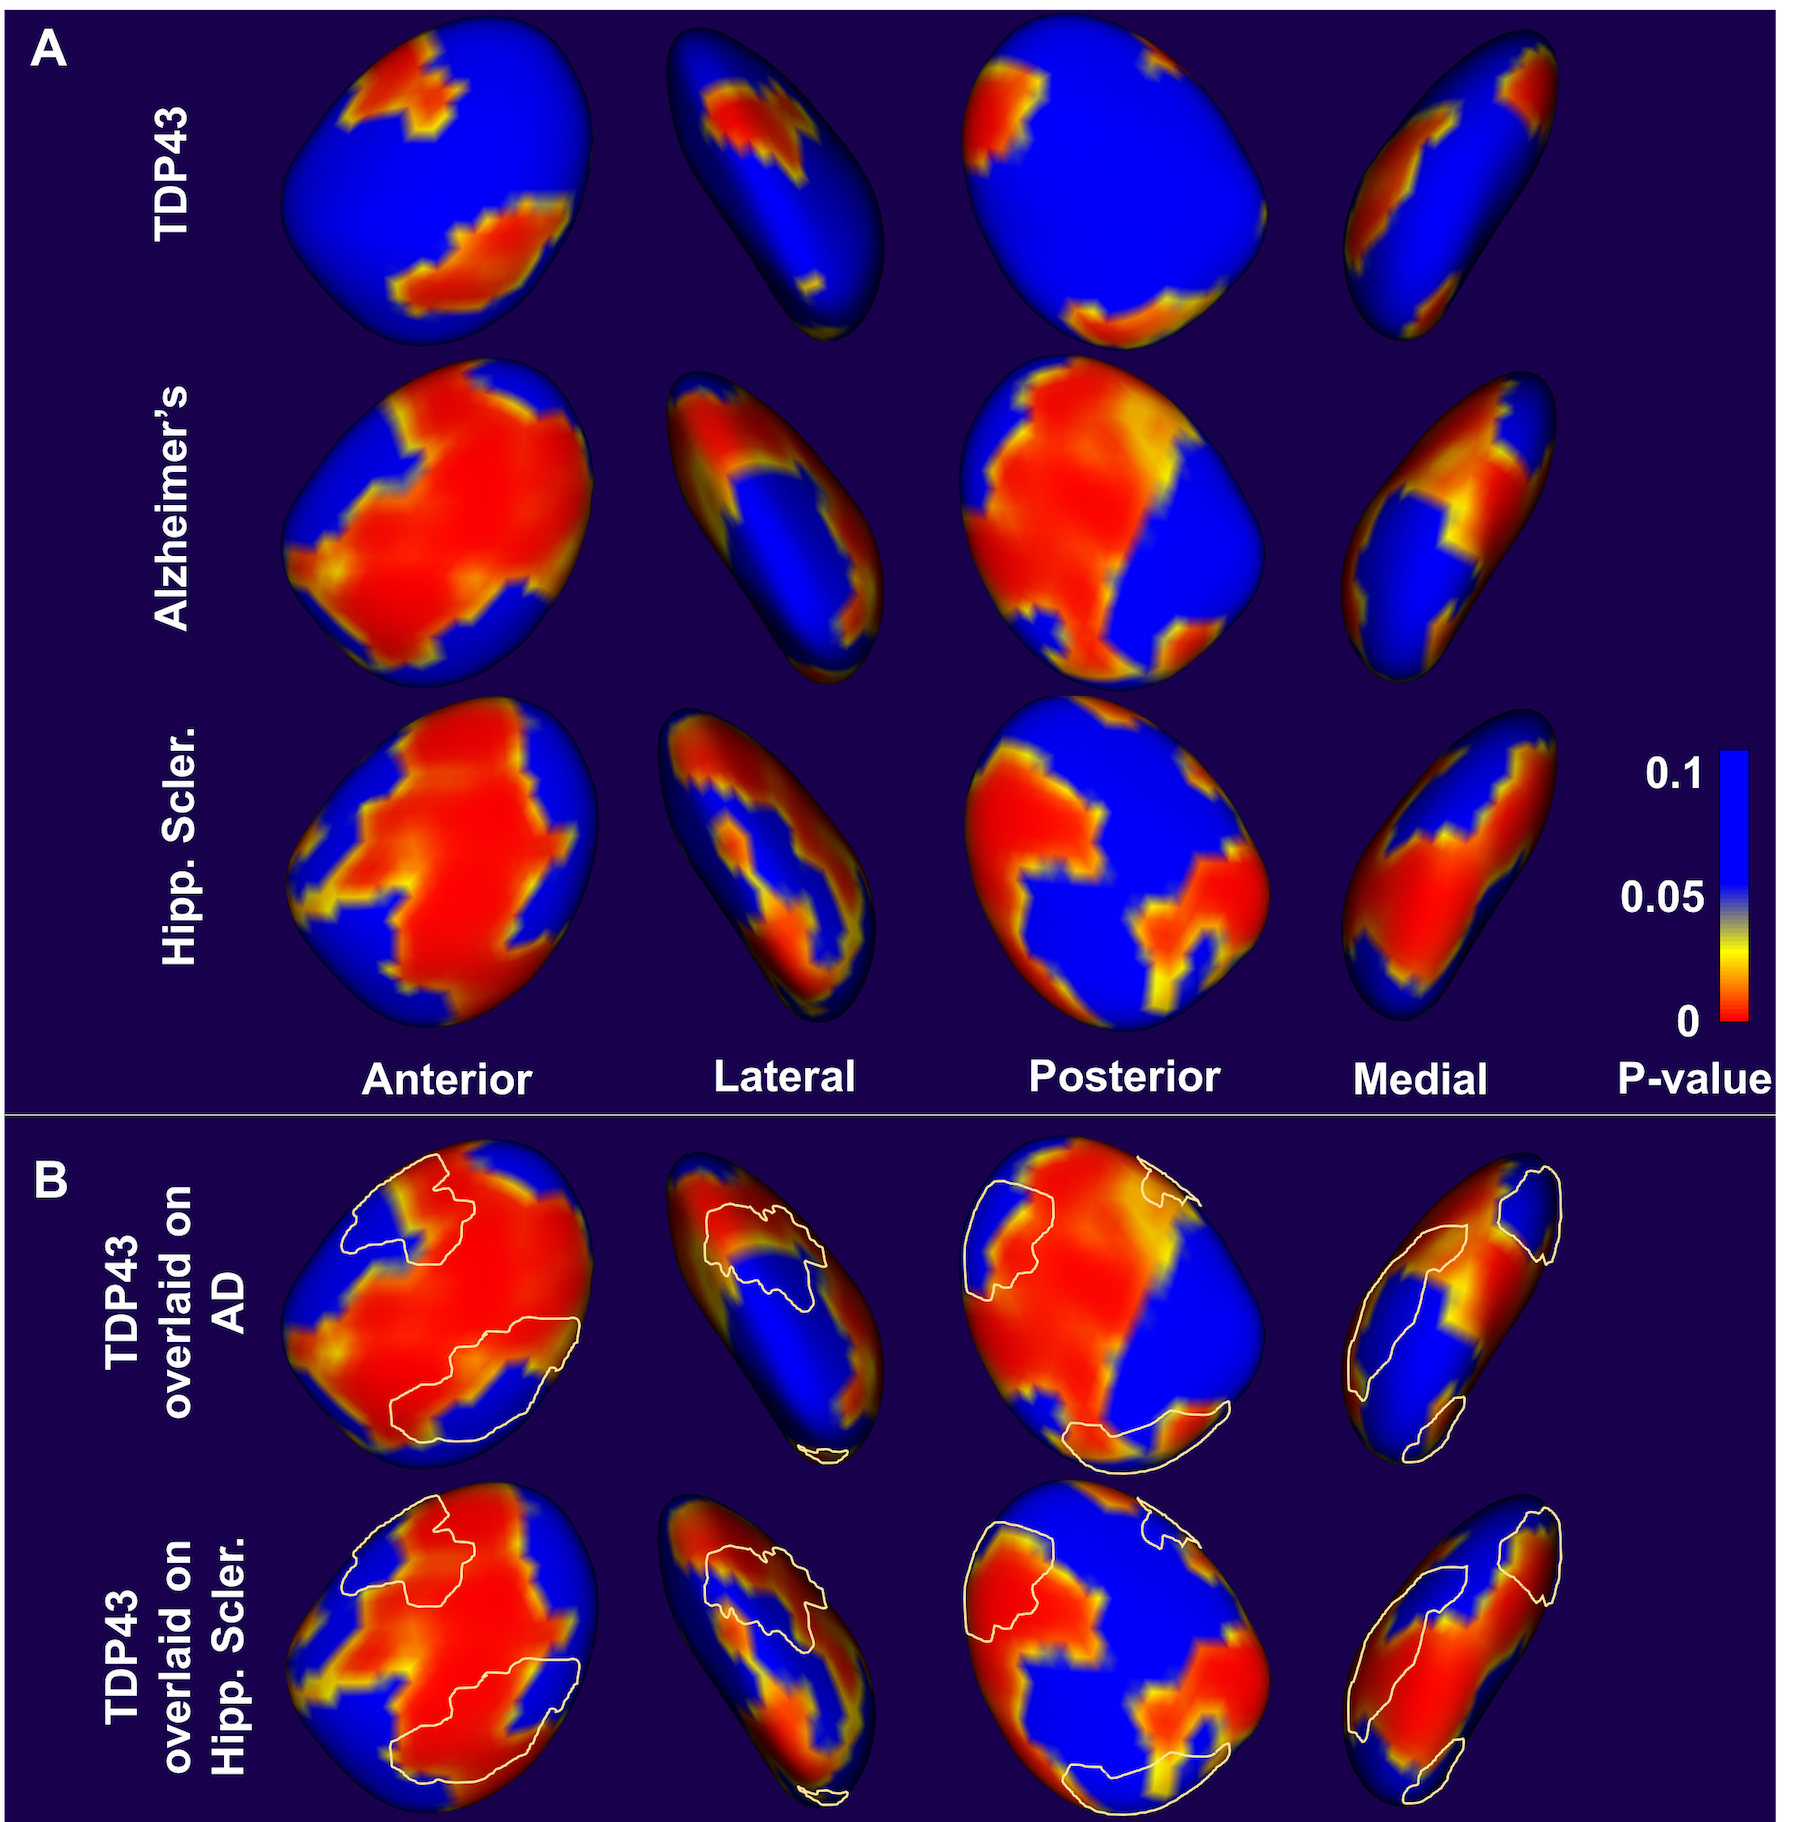
Shape analysis was also conducted using the spherical harmonic point distribution model (SPHARM- PDM) toolbox23. All left amygdalas were first mirrored to resemble right amygdalas, a 3D mesh model of the surface of the amygdala was generated for each participant, and an average mesh was calculated from the whole population. At every node on the amygdala surface of each participant, a distance vector from the corresponding node on the average mesh was calculated, which was then projected to the average surface normal vector to obtain a signed distance value. Multiple linear regression was then used to investigate the association of the signed distance value at each amygdala surface node with all neuropathologies and covariates considered in the volumetric analysis above. Statistical significance was set at p<0.05.
Results and Discussion
The normalized amygdala volume was negatively correlated with TDP43 (-25.5, p=0.006), Alzheimer’s pathology (-74.2, p<10-4), and hippocampal sclerosis (-92.0, p=0.0009), in multiple linear regression. This suggests that TDP43 has an independent contribution on atrophy of the amygdala above and beyond the contributions of Alzheimer’s pathology and hippocampal sclerosis. Shape analysis also demonstrated that the three pathologies are associated with atrophy of the amygdala (Fig.4). Furthermore, shape analysis showed that, although effects of TDP43 on the shape of the amygdala largely overlapped with those of hippocampal sclerosis, more differences existed between the effects of TDP43 and Alzheimer’s pathology (Fig.4). These findings suggest that neurodegeneration in the amygdala due to TDP43 pathology and hippocampal sclerosis may be sharing some common neurobiological mechanisms, while the effects of TDP43 and Alzheimer’s pathology may have somewhat different underlying mechanisms.Conclusion
This work in a community cohort of older adults demonstrated that TDP43 pathology is associated with atrophy of the amygdala, seen in both volumetric and shape analyses. The similarities observed between the effects of TDP43 and hippocampal sclerosis on the shape of the amygdala are intriguing considering the fact that 90% of hippocampal sclerosis cases also suffer by TDP435. The differences observed between the effects of TDP43 and Alzheimer’s pathology on the shape of the amygdala may be exploited towards the development of tools for distinguishing persons with only Alzheimer’s pathology from those with both Alzheimer’s and TDP43.Acknowledgements
National Institute of Neurological Disorders and Stroke (NINDS) UH2NS100599
National Institute on Aging (NIA) R01AG017917
National Institute on Aging (NIA) P30AG010161
National Institute on Aging (NIA) R01AG034374
National Institute on Aging (NIA) R01AG042210
References
1. Neumann M, Sampathu DM, Kwong LK, et al. Ubiquitinated TDP-43 in frontotemporal lobar degeneration and amyotrophic lateral sclerosis. Science 2006;314:130-133.
2. Wilson RS, Yu L, Trojanowski JQ, et al. TDP-43 Pathology, Cognitive Decline, and Dementia in Old Age. JAMA Neurol 2013;70:1418-1424.
3. Arai T, Mackenzie IR, Hasegawa M, et al. Phosphorylated TDP-43 in Alzheimer's disease and dementia with Lewy bodies. Acta Neuropathol 2009;117:125-136.
4. Tremblay C, St-Amour I, Schneider JA, et al. Accumulation of transactive response DNA binding protein 43 in mild cognitive impairment and Alzheimer disease. J Neuropathol Exp Neurol 2011;70:788-798.
5. Zarow C, Weiner MW, Ellis WG, Chui HC. Prevalence, laterality, and comorbidity of hippocampal sclerosis in an autopsy sample. Brain Behav 2012;2:435-442.
6. Schwab C, Arai T, Hasegawa M, et al. Colocalization of transactivation-responsive DNA-binding protein 43 and huntingtin in inclusions of Huntington disease. J Neuropathol Exp Neurol 2008;67:1159-1165.
7. Freeman SH, Spires-Jones T, Hyman BT, et al. TAR-DNA binding protein 43 in Pick disease. J Neuropathol Exp Neurol. 2008;67:62-67.
8. Schwab C, Arai T, Hasegawa M, et al. TDP-43 pathology in familial British dementia. Acta Neuropathol 2009;118:303-311.
9. Lippa CF, Rosso AL, Stutzbach LD, et al. Transactive response DNA- binding protein 43 burden in familial Alzheimer disease and Down syndrome. Arch Neurol 2009;66:1483-1488.
10. Wider C, Dickson DW, Stoessl AJ, et al. Pallidonigral TDP-43 pathology in Perry syndrome. Parkinsonism Relat Disord 2009;15:281-286.
11. Uryu K, Nakashima-Yasuda H, Forman MS, et al. Concomitant TAR-DNA-binding protein 43 pathology is present in Alzheimer disease and corticobasal degeneration but not in other tauopathies. J Neuropathol Exp Neurol 2008;67:555-564.
12. Geser F, Winton MJ, Kwong LK, et al. Pathological TDP-43 in parkinsonism-dementia complex and amyotrophic lateral sclerosis of Guam. Acta Neuropathol 2008;115:133-145.
13. Tan CF, Yamada M, Toyoshima Y, et al. Selective occurrence of TDP-43-immunoreactive inclusions in the lower motor neurons in Machado-Joseph disease. Acta Neuropathol 2009;118:553-560.
14. Fujishiro H, Uchikado H, Arai T, et al. Accumulation of phosphorylated TDP-43 in brains of patients with argyrophilic grain disease. Acta Neuropathol 2009;117:151-158.
15. Olivé M, Janué A, Moreno D, et al. TAR DNA-Binding protein 43 accumulation in protein aggregate myopathies. J Neuropathol Exp Neurol 2009;68:262-273.
16. Josephs KA. Dementia and the TAR DNA binding protein 43. Clin Pharmacol Ther 2010;88:555-558.
17. Nelson PT, Abner EL, Schmitt FA, et al. Modeling the association between 43 different clinical and pathological variables and the severity of cognitive impairment in a large autopsy cohort of elderly persons. Brain Pathol 2010;20:66-79.
18. Josephs KA, Murray ME, Whitwell JL, et al. Staging TDP-43 pathology in Alzheimer’s disease.
19. Kotrotsou A, Schneider JA, Bennett DA, et al. Neuropathologic correlates of regional brain volumes in a community cohort of older adults. Neurobiol Aging. 2015;36:2798-2805.
20. Bennett DA, Schneider JA, Buchman AS, et al. Overview and findings from the Rush Memory and Aging Project. Curr Alzheimer Res 2012;9:646–663.
21. Bennett DA, Wilson RS, Arvanitakis Z, et al. Selected findings from the Religious Orders Study and Rush Memory and Aging Project. J Alzheimers Dis 2013;33 Suppl 1:S397-403.
22. Kotrotsou A, Bennett DA, Schneider JA, et al. Ex vivo MR volumetry of human brain hemispheres. Magn Reson Med. 2014;71:364-374.
23. Styner M, Oguz I, Xu S, et al. Framework for the Statistical Shape Analysis of Brain Structures using SPHARM-PDM. The insight journal. 2006;1071:242-250.
Figures