0398
Cross-sectional and Longitudinal Cerebral Blood Flow Changes in the Progression from Normal Cognition to Alzheimer’s Disease Measured with Continuous Arterial Spin Labeling (CASL)1Department of Computer Science, Binghamton University (SUNY), Binghamton, NY, United States, 2Department of Radiation Oncology, Washington University, Saint Louis, St. Louis, MO, United States, 3Department of Electrical and Computer Engineering, University of Iowa, Iowa City, IA, United States, 4Department of Psychology, University of Pittsburgh, Pittsburgh, PA, United States, 5Department of Psychiatry and Neurology, University of Pittsburgh, Pittsburgh, PA, United States
Synopsis
Cross-sectional and longitudinal analysis of cerebral blood flow (CBF) versus cognitive status were performed in an elderly cohort. Voxel-based ANOVA was used to test the CBF difference between normal control (NC), mild cognitive impairment (MCI) and Alzheimer’s Disease (AD) groups at the baseline. Eight significant clusters were found between groups. The longitudinal CBF change in each cluster was compared across 4 longitudinal groups (stable NC, NC-to-MCI, stable MCI, and MCI/AD-to-AD) using a multiple linear regression
Introduction
From 2002-2010, the cardiovascular health study cognition study (CHS-CS) measured cerebral blood flow (CBF) and brain morphology in 195 elderly volunteers that did not initially have Alzheimer’s disease (AD). During the study, the volunteers progressed from normal cognition (NC) to mild cognitive impairment (MCI) and AD. Volunteers received up to 4 MRIs during the course of the study. Most cohort studies examined cross-sectional differences in CBF between cognitive groups. In this study, we performed cross-sectional and longitudinal analyses of CBF in the CHS-CS cohort to summarize the relationship of CBF and cognitive status.Methods
All studies were conducted at the University of Pittsburgh MR Research Center using a GE Signa 1.5 T MRI (LX Version). Volunteers received 3D T1 spoiled gradient recalled echo (SPGR) images. Volunteers also received continuous arterial spin labeling (CASL) with echo planar imaging (EPI).1-3
The cross-sectional study included 58 NC subjects (31 females, 83.4±3.7 years), 40 AD patients (28 females, 84.1±3.5 years) and 50 MCI patients (32 females, 84.5±3.6 years). The CASL images were co-registered and normalized from their original space to a standard space using the T1 as an intermediate, and smoothed with a 6×6×6 mm Gaussian kernel. We sought brain regions that distinguish NC, MCI, and AD groups via voxel-based one-way ANOVA tests, adjusting for age and gender effects. The statistical difference maps between groups were thresholded using a voxel-level p-value of 0.01/0.05. A cluster-level p-value of 0.05 was used to correct for multiple comparisons.
For the longitudinal analysis, we selected volunteers having at least 2 MRIs, and divided them into 4 groups: 15 stable NC subjects (8 females, 2.79±1.73 years between two scans), 14 NC-to-MCI subjects (8 females, 2.47±1.84 years between two scans), 14 stable MCI subjects (9 females, 2.58±1.68 years between two scans) and 14 MCI/AD-to-AD subjects (9 females, 1.91±1.37 years between two scans). We focused the longitudinal analysis on 8 clusters that demonstrated significant differences among NC, MCI, and AD groups from the cross-sectional study. The mean CBF change (between 2 scans) over each cluster was compared across the 4 groups using a multiple linear regression model. AAL Atlas was used to identify the locations of the significant clusters.4
Results
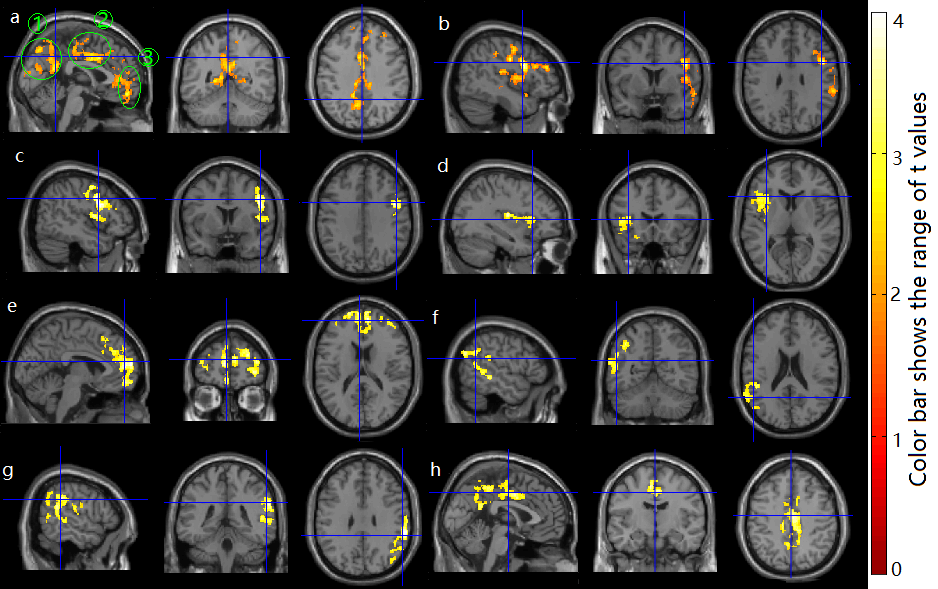
Figure 1 shows 8 significant clusters identified in the cross-sectional study. The AD group had decreased CBF versus the NC group in a large cluster (cluster 1) including posterior cingulate extending to precuneus and cuneus area, anterior and middle cingulate area, superior, middle and inferior frontal area (cluster-level p=1.24e-4, with a voxel-level p-value of 0.05); The MCI group showed marginally increased CBF versus the NC group in a cluster (cluster 2) including insular and temporal-frontal areas (cluster-level p=0.061 with a voxel-level p-value of 0.05); The AD group showed decreased CBF compared to the MCI group in 6 clusters: cluster 3 (right insular and inferior frontal area), cluster 4 (left insular and inferior frontal area), cluster 5 (superior and middle frontal, and anterior cingulate area), cluster 6 (left temporal-parietal area), cluster 7 (right temporal-parietal area), and cluster 8 (posterior cingulate extending to precuneus area, and middle cingulate area). Their cluster-level p-values were 0.007, 0.024, 1.59e-5, 0.006, 1.07e-4, 4.42e-5 respectively with a voxel-level p-value of 0.01.
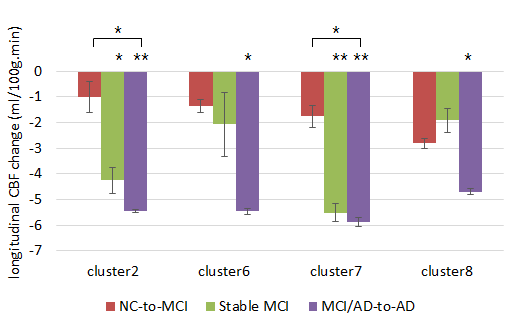
Four out of 8 clusters had significant changes in absolute CBF across the 4 cognitive groups (Fig. 2). Compared to the stable-NC group, both the stable-MCI group and the MCI/AD-to-AD group exhibited significant longitudinal decreases in CBF at cluster 2 and 7; the MCI/AD-to-AD group exhibited significant longitudinal decreases in CBF at cluster 6 and 8. Compared to the NC-to-MCI group, the MCI/AD-to-AD group exhibited significant longitudinal CBF decreases at cluster 2 and 7.
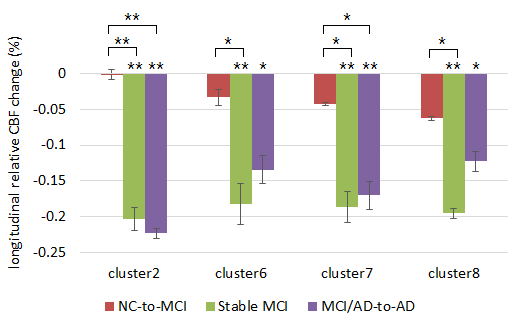
Fig. 3 shows the longitudinal relative CBF (normalized to the whole-brain CBF) changes after correcting for baseline age, gender, and the time gap (in years) between the two MRI scans. The longitudinal relative CBF still showed significance in the aforementioned brain regions. The NC-to-MCI group did not exhibit any significant differences compared to the stable MCl group for longitudinal changes in both absolute and relative CBF.
Discussion
In the cross-sectional study, we observed a small increase in CBF in MCIs versus NCs, consistent with our earlier reports.3 However, in the longitudinal analysis, we did not observe a significant difference in CBF between the stable NCs and NC-to-MCIs. We observed significant differences in CBF between stable NCs and both stable MCIs and MCI/AD-to-ADs. These results indicate that CBF rises in AD-related regions of the brain during MCI and then drops dramatically in advanced MCI or early AD.Acknowledgements
This work was supported by grants AG20098 and AG15928 from the National Institute on Aging (NIA) and by contracts N01-HC-85239, N01-HC-85079 through N01-HC-85086, N01-HC-35129, N01 HC-15103, N01 HC-55222, N01-HC-75150, N01-HC-45133, and grant HL080295 from the National Heart, Lung, and Blood Institute (NHLBI), with additional contributions from the National Institute of Neurological Disorders and Stroke (NINDS). The research was also supported by the State University of New York at Binghamton, Nevada Cancer Institute, the University of Pittsburgh, and Washington University in St. Louis.References
1. DC Alsop and JA Detre. Multisection cerebral blood flow MR imaging with continuous arterial spin labeling. Radiology 208(2): 410-416 (1998).
2. HM Gach and W Dai. Simple model of double adiabatic inversion (DAI) efficiency. MRM 52(4): 941-946 (2004).
3. W Dai et al. Mild cognitive impairment and Alzheimer’s Disease: Patterns of altered cerebral blood flow at MR imaging. Radiology 250(3): 856-866 (2009).
4. N. Tzourio-Mazoyer, B. Landeau, D. Papathanassiou, F. Crivello, O. Étard, N. Delcroix, B. Mazoyer, and M. Joliot. Automated Anatomical Labeling of Activations in SPM Using a Macroscopic Anatomical Parcellation of the MNI MRI Single-Subject Brain. NeuroImage 2002. 15 :273-289 (2002).
Figures