0395
Association of cerebral blood flow and amyloid burden in autosomal dominant Alzheimer’s disease1Stevens Neuroimaging and Informatics Institute, University of Southern California, Los Angeles, CA, United States, 2Neurology, University of Southern California, Los Angeles, CA, United States, 3University of California Los Angeles, United States
Synopsis
The purpose of this study was to investigate the association of cerebral blood flow alternation with cerebral amyloid deposition in autosomal dominant Alzheimer’s disease. Cross-subject negative correlation between cerebral blood flow and amyloid deposition was observed, indicating brain regions with high amyloid deposition may be associated with hypoperfusion. Our finding suggests cerebral hypoperfusion may contribute to the onset and progression of AD.
Purpose
The accumulation of amyloid-β in the form of amyloid plaques is recognized as the central pathologies in Alzheimer’s disease1. Brain function in specific regions is also reduced in the development of Alzheimer’s disease, which is reflected by regional changes of glucose metabolism2 and cerebral blood flow (CBF)3. However, the relationship between amyloid pathology and cerebral perfusion has not been well-studied. Autosomal dominant Alzheimer’s disease (ADAD) is a genetic form of AD that typically develops symptoms at a relatively young age without the burden of substantial atherosclerosis, which allows us to directly interrogate the relationship between amyloid deposition and CBF in the absence of significant cerebrovascular diseases contributing to CBF abnormality. In the current study, we aimed to explore the association between CBF and amyloid deposition from anatomical regions and using whole-brain voxel-wise regression analysis in a cohort of ADAD subjects.Methods
Subjects: Persons known to have PSEN1, PSEN2, or APP mutations in the family were recruited at UCLA as part of the Dominantly Inherited Alzheimer Network (DIAN). Twenty-two ADAD subjects with 20 mutation carriers (age 38±11 years) participated in this study. Persons with significant medical or psychiatric illnesses with the potential to significantly affect cognition in themselves were excluded.
MRI Protocol: All participants underwent MRI scans on a 3T Siemens TIM Trio scanner using the standard 12-channel head coil. Pseudo-continuous arterial spin labeling (pCASL) with 3D background suppressed GRASE sequence was performed for resting CBF measurements with the imaging parameters: FOV=220x220mm2, matrix size=64x64, TE/TR=23/4000ms, PLD=1500ms. Thirty 5-mm slices were acquired to cover the whole brain with 60 repetitions.
PET Protocol: All the participants received C11-PIB PET/CT. Dynamic C11-PIB PET/CT scans were acquired on each subject in list-mode for 70 mins. Raw PiB PET data were rebinned into 6x30 s, 4x180 s, and 11x300 s, and were reconstructed using ordered subset expectation maximization algorithm (6 iterations, 16 subsets) with a post-reconstruction 3D Gaussian smoothing (FWHM: 3 mmx3 mmx3 mm). A retrospective image-based movement correction procedure was applied to correct for possible misalignment between CT and PET scans and between PET image frames.
Data Processing: Quantitative CBF maps were calculated from the 3D GRASE pCASL data based on a single compartment model. Both CBF and PiB PET images of each subject were co-registered to the subject’s MPRAGE images, and further warped to MNI single-subject brain template using the symmetric image normalization method implemented in ANTs4. Using the combined transformation from template to PET space, tissue time-activity curve was generated for cerebellar gray matter (reference region), and parametric image of distribution volume ratio (DVR), which is used for the assessment of amyloid deposition, was constructed by Logan graphical method5 from each subject. To specify regional correlations, the CBF and DVR images were compared within 9 representative regions of interest (ROIs) from the Automated Anatomic Labeling (AAL) template in SPM including the frontal, parietal, occipital, and temporal lobes, amygdala, caudate, cingulum, hippocampus, and insula. The association between the mean DVR in gray matter as the independent variables and CBF at the voxel level was also assessed using a univariate regression analysis.
Results
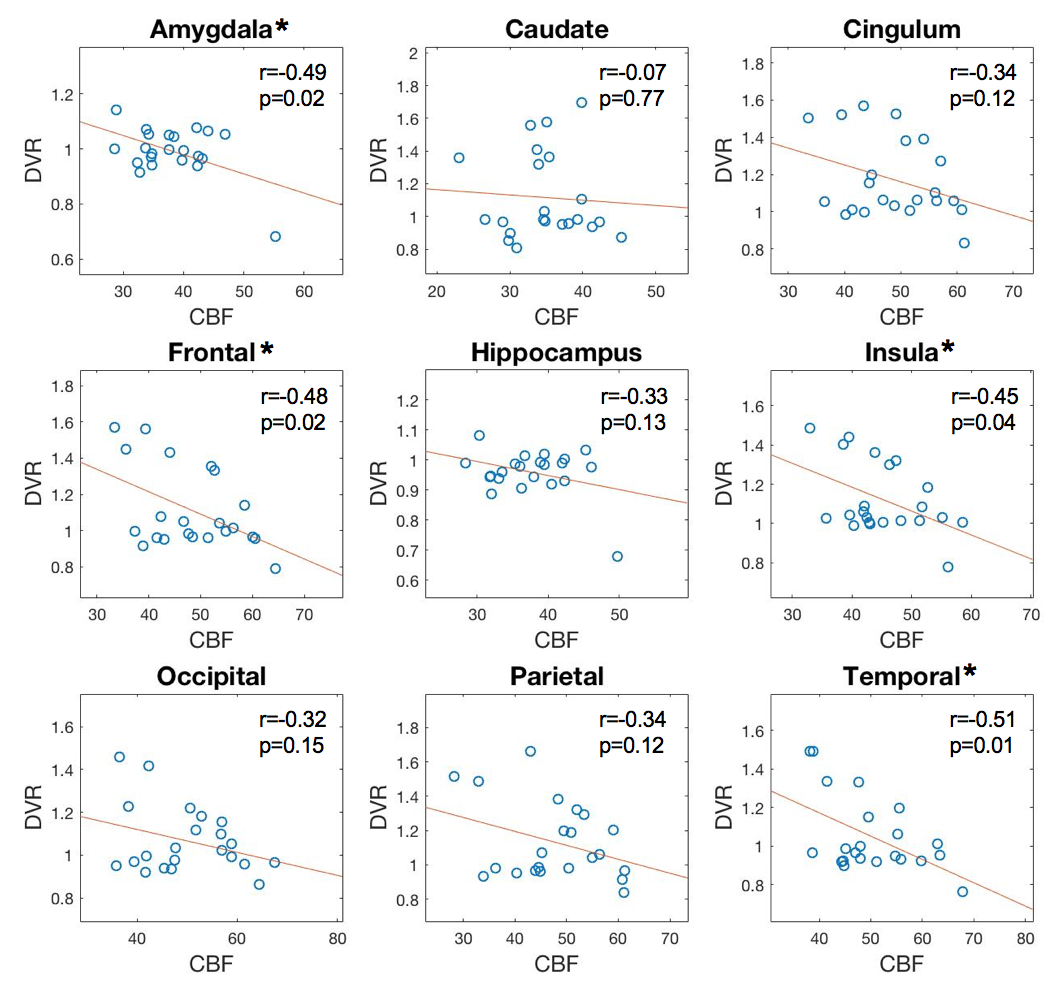
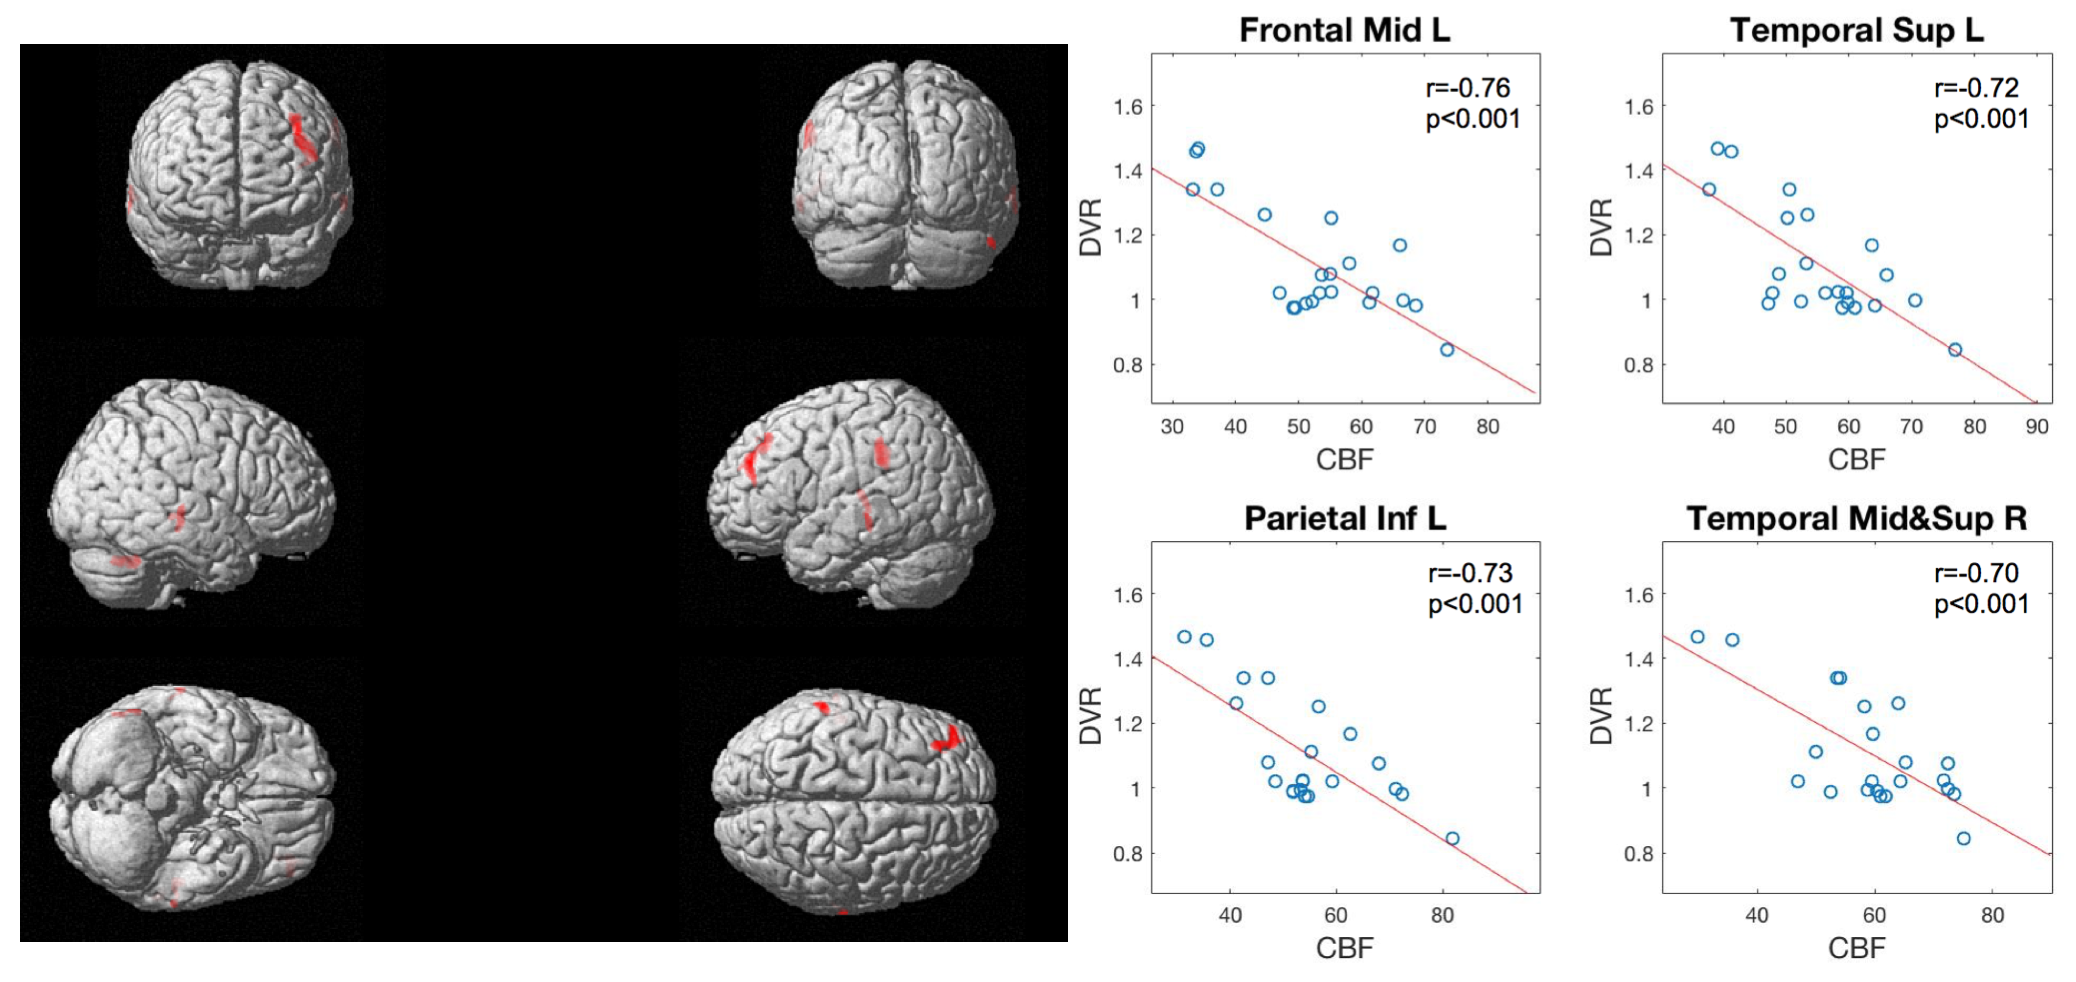
Cross-subject correlations between the mean CBF and mean DVR from the 22 subjects were calculated separately for the 9 anatomical ROIs. The scatter plots of CBF to DVR are shown in Figure 1. Negative correlations between CBF and DVR were observed in the 9 ROIs (r=-0.37±-0.14) with significant correlation in frontal lobe (r=-0.48), temporal lobe (r=-0.51), amygdala(r=-0.49), and insular cortex(r=-0.45). From the voxel-level regression analysis, there was decreased CBF in Frontal Mid L, Temporal Sup L, Temporal Mid&Sup R, and Parietal Inf L (Figure 2), as mean DVR in gray matter increases. After controlling for age, there were similar findings but a reduction of the size of the clusters. Significant negative correlation was observed between the mean DVR in gray matter and the extracted CBF from each of the clusters (Figure 2). Additionally, three clusters in white matter of CBF maps were also detected to show significant correlation with mean DVR in white matter.Discussion
The relationship between CBF and amyloid deposition in ADAD was investigated in this work. A negative cross-subject correlation was obtained between CBF and DVR from anatomical ROIs and voxel-wise analysis, both of which suggested that brain with high DVR values may be associated with hypoperfusion. Since ADAD subjects are relatively young without cardiovascular disease, this finding may be showing that cerebral amyloid deposition impairs neuronal function causing hypoperfusion, or that deposition of amyloid in the walls of blood vessels (amyloid angiopathy) reduces vascular reactivity and therefore perfusion.Acknowledgements
No acknowledgement found.References
1. Hardy J, SelKoe DJ. The amyloid hypothesis of Alzheimer’s disease: progress and problems o the road to therapeutics. Science 2002; 297:353-6.
2. Mosconi L, Tsui WH, Herholz K, Pupi A, Drzezga A, Lucignani G, et al. Multi-center standardized 18F-FDG PET diagnosis of mild cognitive impairment, Alzheimer’s disease, and other dementias. J Nucleic Med 2008; 49:390-8.
3. Rodell A, Aanerud J, Braendgaard H, Gjedde A. Washout allometric reference method (WARM) for parametric analysis of [(11)C]PIB in human brains. Front Aging Neurosci 2013; 27:5-45.
4. Avants BB, Epstein CL, Grossman M, Gee JC. Symmetric diffeomorphic image registration with cross-correlation: evaluating automated labeling of elderly and neurodegenerative brain. Med Image Anal 2008; 12(1):26-41.
5. Logan J, Fowler JS, Wolkow ND, Wang GJ, Ding YS, Alexoff DL. Distribution volume ratios without blood sampling from graphical analysis of PET. J Cereb Blood Flow Metab 1996; 16(5):834-40.
Figures