0394
Cerebral Arteries Hemodynamics in Alzheimer's Disease Assessed by Phase-Contrast Velocity Mapping1Radiology, University of Navarra Hospital, Pamplona, Spain, 2Biomedical Engineering, TECNUN, University of Navarra, San Sebastian, Spain, 3Center for Functional Neuroimaging, University of Pennsylvania, Philadelphia, United States, 4Neurology, University of Navarra Hospital, Pamplona, Spain
Synopsis
Vascular disease increases the risk of Alzheimer's disease. The assessment of vascular dysfunction in subjects at risk for AD has the potential to contribute to the disease early diagnosis and management. In this work, the phase-contrast velocity mapping MRI technique was used to evaluate cerebral hemodynamics in patients with cognitive dysfunction and healthy controls. Results showed significant differences in hemodynamic parameters (velocity and flow) across groups with lower mean values in the AD and MCI groups compared to the CO group. PC-MRI can be used to assess hypoperfusion in an early stage of AD.
Introduction
Vascular disease increases the risk of Alzheimer's disease (AD) (1). Some studies suggest that chronic brain hypoperfusion contributes to amyloid deposition, playing a primary pathogenic role in the disease (2), while others favor the hypothesis of an independent and additive mechanism leading to cognitive dysfunction (3). In any case, the assessment of vascular dysfunction in subjects at risk for AD has the potential to contribute to the disease early diagnosis and management. Cerebral arteries hemodynamic parameters (velocity and flow) can be measured non invasively by MR using phase-contrast (PC) velocity mapping. This technique applied to the arteries that feed the brain (internal carotid and vertebral arteries) can yield a quantitative measurement of total cerebral blood flow in a short scan time. To date very few studies have employed this technique to evaluate cerebral blood flow in patients with cognitive dysfunction (4, 5).
The goal of this study was to investigate whether this parameter was associated with cognitive dysfunction and could be used to differentiate patients suffering from mild cognitive impairment or dementia from healthy subjects.
Methods
Subjects: A total of 115 subjects participated in the study, after signing written informed consent. All participants underwent clinical and neuropsychological tests (including Minimental State Examination to assess global cognitive deficits). Twenty-one were patients with a diagnosis of probable AD, 34 were diagnosed with mild cognitive impairment (MCI), 17 were subjects with subjective memory complaints for which all clinical and neuropsychological tests were normal and 32 were healthy volunteers with no past or present history of neurological or psychiatric disorders. Subjects with subjective memory complaints and healthy volunteers were included in the control group. The three study groups (AD, MCI and CO) were age-matched.
Scanning protocol: The study was performed on a 3T Siemens Trio using a 32-channel head-array. The scanning session included: T2-weighted FLAIR, 3D time-of-flight MR angiography and PC MRI. The PC sequence was a 2D GRE with bipolar gradients, with 4 encoding velocities (venc) and total scan-time of 30s. This sequence was run twice, first in a plane perpendicular to the internal carotid arteries (ICAs), with venc = 25, 35, 45 and 55 cm/s, followed by a second acquisition in a plane perpendicular to the vertebral arteries (VAs), with venc = 15, 20, 25 and 30 cm/s.
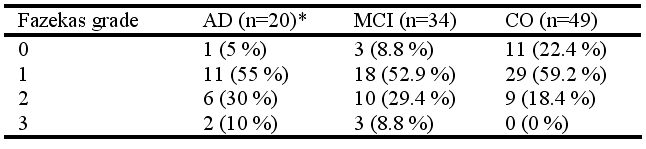
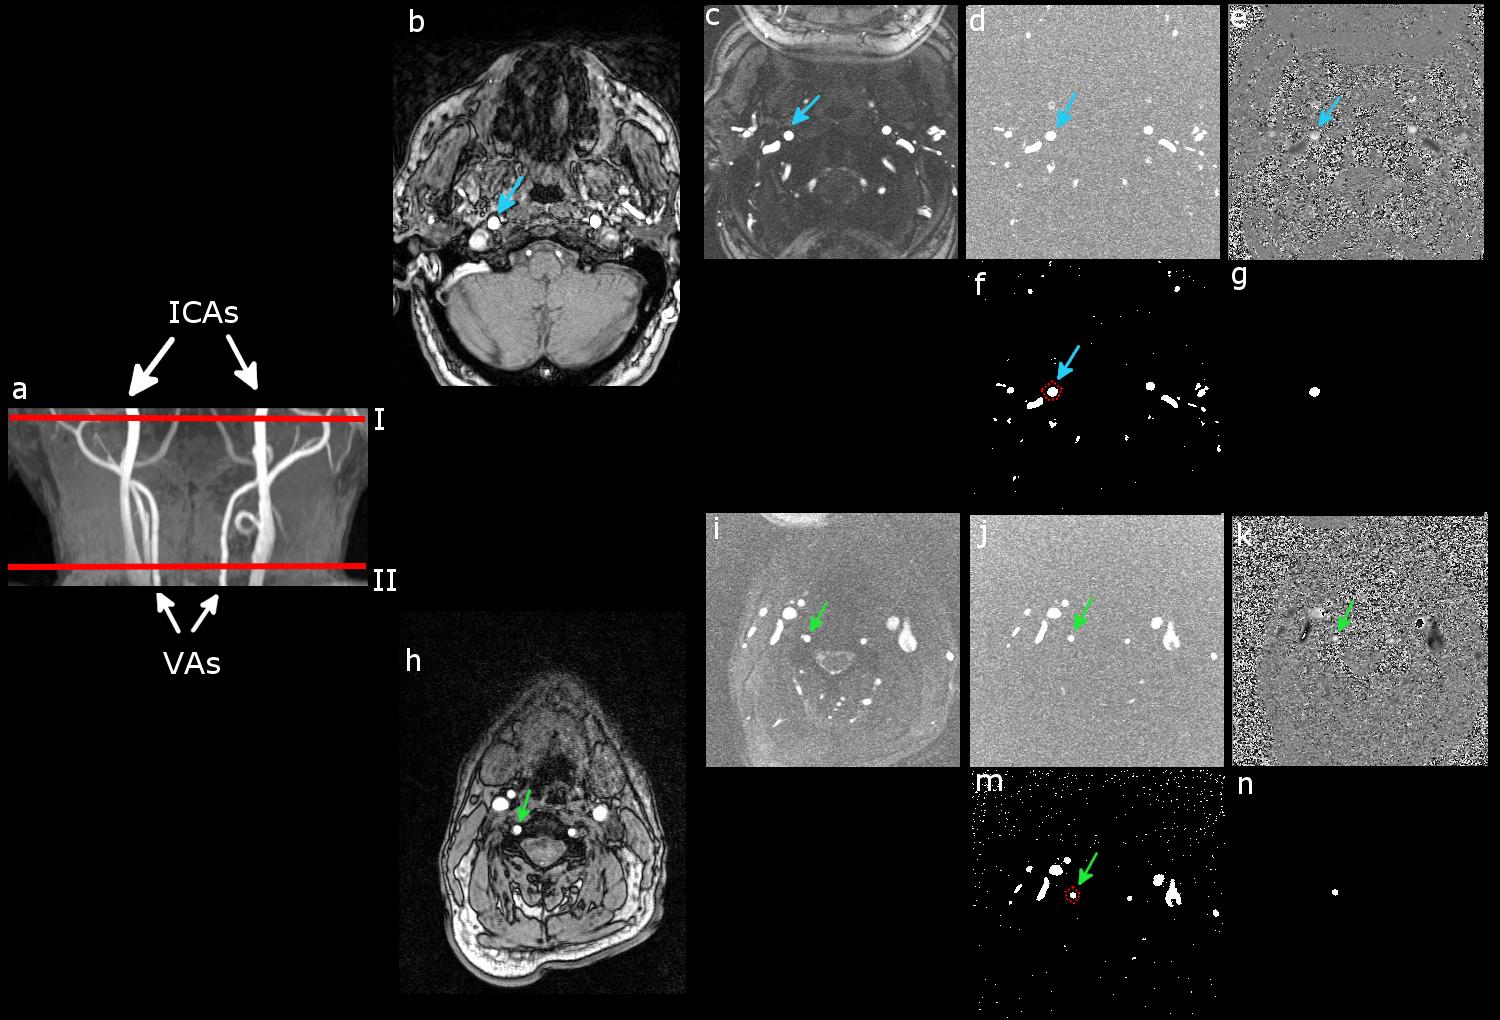
Data processing (Matlab): Hemodynamic data were measured in the ICAs and VAs using the PC dataset with the lowest velocity encoding that did not show velocity aliasing. For each artery, the vessel lumen was segmented based on the complex difference images using a semiautomatic method (see Fig. 1). Mean velocity and cross-sectional area were obtained and used to compute blood flow in each vessel and total intake of blood to the brain (TBF). Visual rating of the FLAIR images was performed using the Fazekas scale to obtain a qualitative evaluation of white matter lesion burden.
Statistical analysis (R 3.0.3): Group differences in cerebrovascular risk factors (diabetis mellitus, hypercolesterolimia and hypertension) and Fazekas scores were assessed using χ2 tests. Differences in hemodynamic parameters across groups were assessed using ANOVA and post-hoc tests with Bonferroni correction (significance threshold p<0.05). Differences in MMSE scores were evaluated using ANOVA. A linear regression model was used to study the relationship between hemodynamic parameters, MMSE scores and age.
Results and Discussion
Demographic and clinical variables are reported in
Table 1. MMSE scores demonstrated statistically significant differences among
the three groups in the expected directions (AD < MCI, AD < CO, MCI <
CO). Cerebrovascular risk factors and Fazekas scores (shown in Table 2) did not
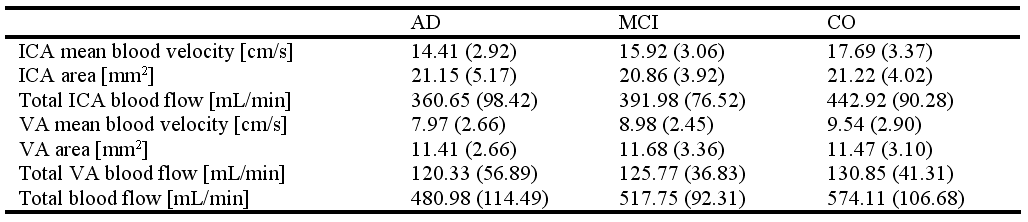
differ significantly across the groups. Hemodynamic parameters are reported in
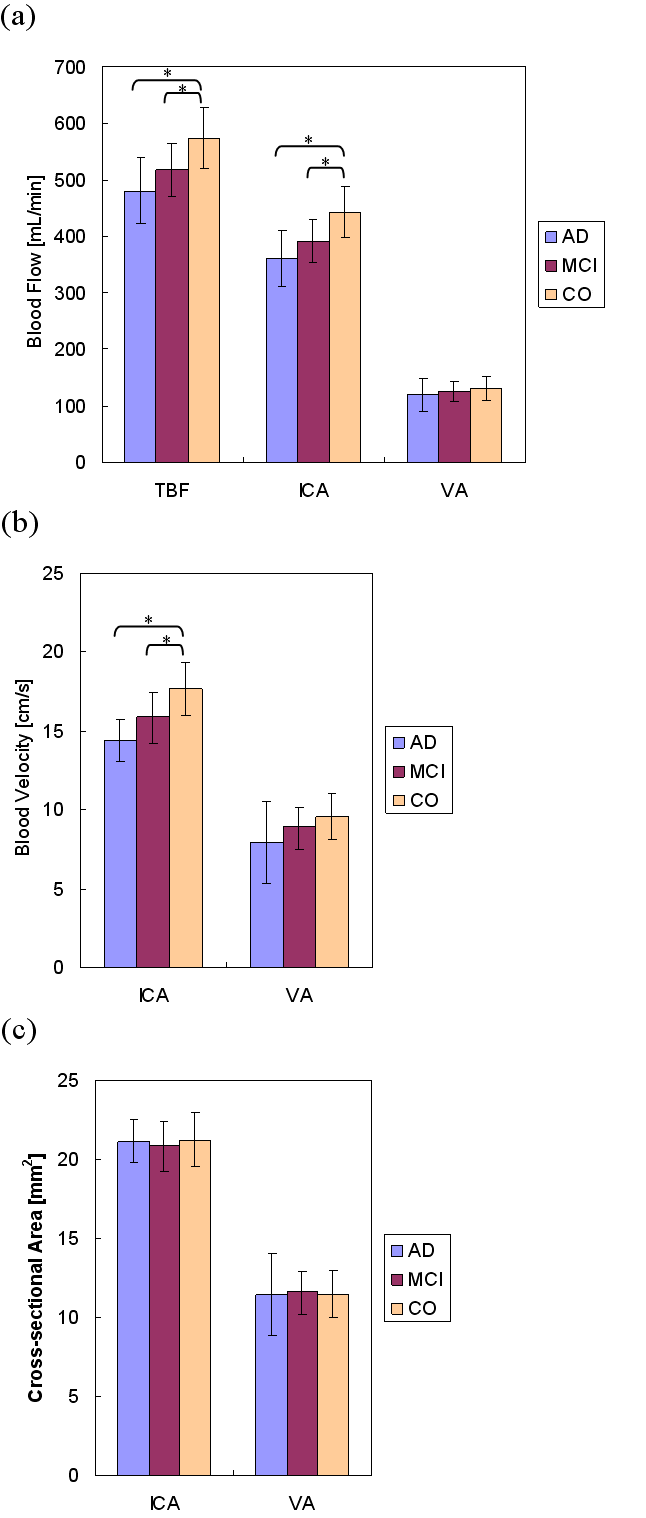
Table 3. Significant differences in TBF, ICA
blood flow and ICA
blood velocity were found across groups with lower mean values in the AD and
MCI groups compared to the CO group (Fig. 2). There was a significant
relationship between TBF and MMSE (T = 3.06, p = 0.003) after controlling for
age (T = -1.19, p = 0.236). Our results are in agreement with previous studies
(4, 5) that support the evidence that the dysregulation of cerebral blood flow
contributes to the cognitive impairment in AD.Conclusion
This work demonstrates the feasibility of using
PC-MRI to assess hypoperfusion in an early stage of AD. The quantitative
measurement of total brain blood flow appears to be sensitive enough to
discriminate MCI patients from controls. This technique could contribute to the
identification of patients that could benefit from interventions aimed at
controlling vascular risk factors, in addition to serving as a potential
biomarker in the early diagnosis of AD.Acknowledgements
Grant SAF2014-56330-R.References
1. Breteler, Neurobiol Aging, 21:153-60 (2000). 2. Di Marco et al., J Alzheimers Dis, 46:35-53 (2015). 3. Bangen et al., Alzheimers Dement, 11:394-403 e1 (2015). 4. Rivera-Rivera et al., J Cereb Blood Flow Metab, 36:1718-30 (2015). 5. Roher et al., Vasc Health Risk Manag, 8:599-611 (2012).Figures