0393
Age-related changes in cerebrovascular reactivity and their relationship to cognition and vascular risk: A four-year longitudinal study1Department of Radiology, Johns Hopkins University School of Medicine, Baltimore, MD, United States, 2Department of Biomedical Imaging and Radiological Science, China Medical University, 3Center for Vital Longevity, School of Behavioral and Brain Sciences, University of Texas at Dallas
Synopsis
Although cerebrovascular factors are the cause of cognitive impairment, the vascular decline in aging have not been characterized. In this work, we present four-year longitudinal cerebrovascular reactivity (CVR) data measured in 116 individuals. Our data revealed temporal lobe showed the fastest CVR decline and middle age manifested the fastest CVR decline. Vascular risk of hypertension results in a lower CVR when compared to normal and well-controlled subjects. Individuals with poorer general cognitive status, as indexed by a low mini-mental-state-exam (MMSE), had a lower CVR compared to participants with higher MMSE scores. These findings help elucidate age-related decline in brain hemodynamics.
Purpose
Although vascular factors are the second most common cause of dementia in older individuals, the precise trajectories of vascular decline in aging have not been characterized. With an advanced cerebrovascular reactivity (CVR) magnetic resonance imaging (MRI) technique1, a central goal of this study is to determine changes in cerebrovascular function over a four-year interval in a lifespan sample of adults. We elucidated spatial (e.g. which brain region shows the fastest vascular decline) and temporal (e.g. which age range manifests the fastest decline) characteristics of CVR decline in aging. The influence of vascular risk of hypertension was also studied. We also examined the relationship between cognition and cerebrovascular function by studying the association between CVR and general cognitive status, as indexed by mini-mental-state-exam (MMSE).Methods
Participants: The data were collected from a longitudinal aging study, the Dallas Lifespan Brain Study (DLBS). Of these, 205 subjects (aged 20-88) received the CVR MRI scan at Wave1, and 116 of them completed the follow-up Wave2 CVR. The interval between the two waves was 4.1±0.2 years. Hypertension status was obtained by a self-reporting questionnaire and measurement of blood pressure at study visit. The lowest MMSE score of the participants was 25 (N=2). Informed consent was obtained using IRB-approved protocol. CVR MRI: CVR measurement was performed on a Philips 3T system, following protocols established in our previous studies2. Briefly, each subject was fitted with a nose clip and a mouthpiece to ensure mouth breathing. Hypercapnia (5% CO2 mixed with 21% O2 and 74% N2) was administered through a plastic bag with a valve to switch between room air and CO2 mixture. BOLD images and physiologic parameters (end-tidal CO2 (EtCO2), breathing rate, heart rate, and arterial oxygenation) were continuously collected. Wave1 and Wave2 studies used identical protocols. Data analysis: CVR maps were obtained by general linear regression using BOLD signal as dependent variable and EtCO2 time course as independent variable. For cross-sectional data, age-related decline in CVR was examined through the slope of linear regression of CVR as a function of age. For longitudinal data, CVR decline rate was examined through the subtraction of the two time-points and then dividing by the time gap. Impact of hypertension on CVR was studied by regressing CVR on age and hypertension.Results
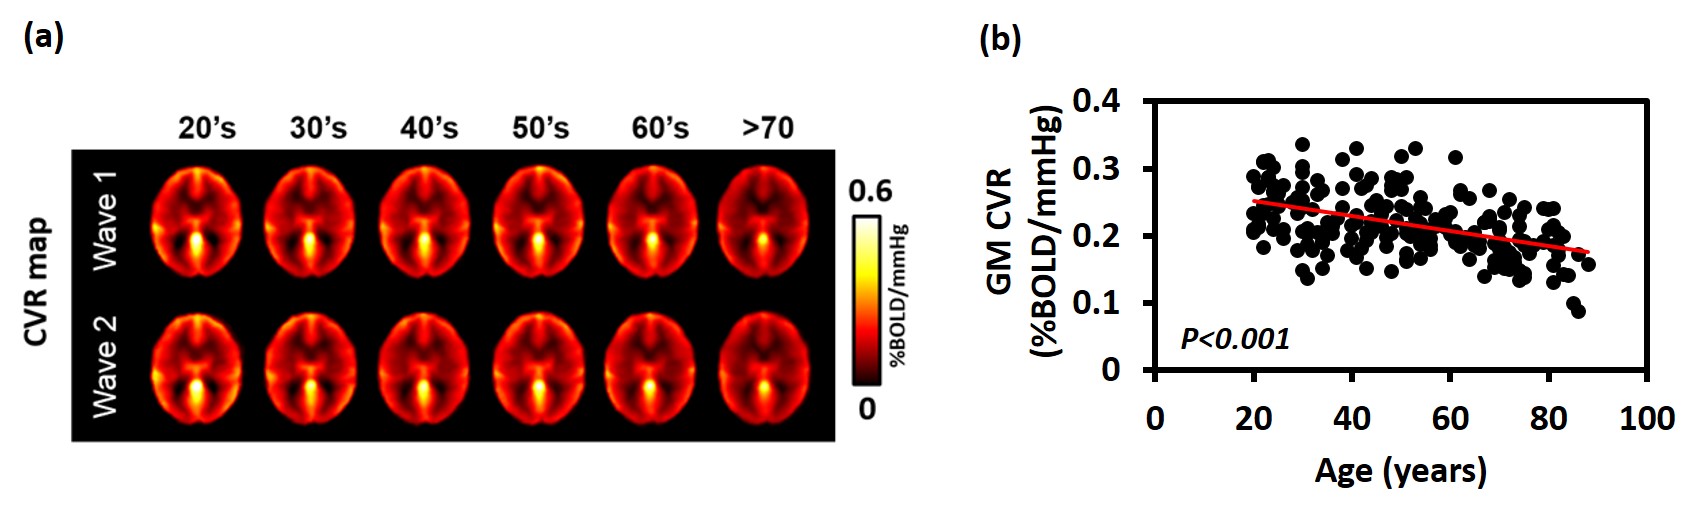
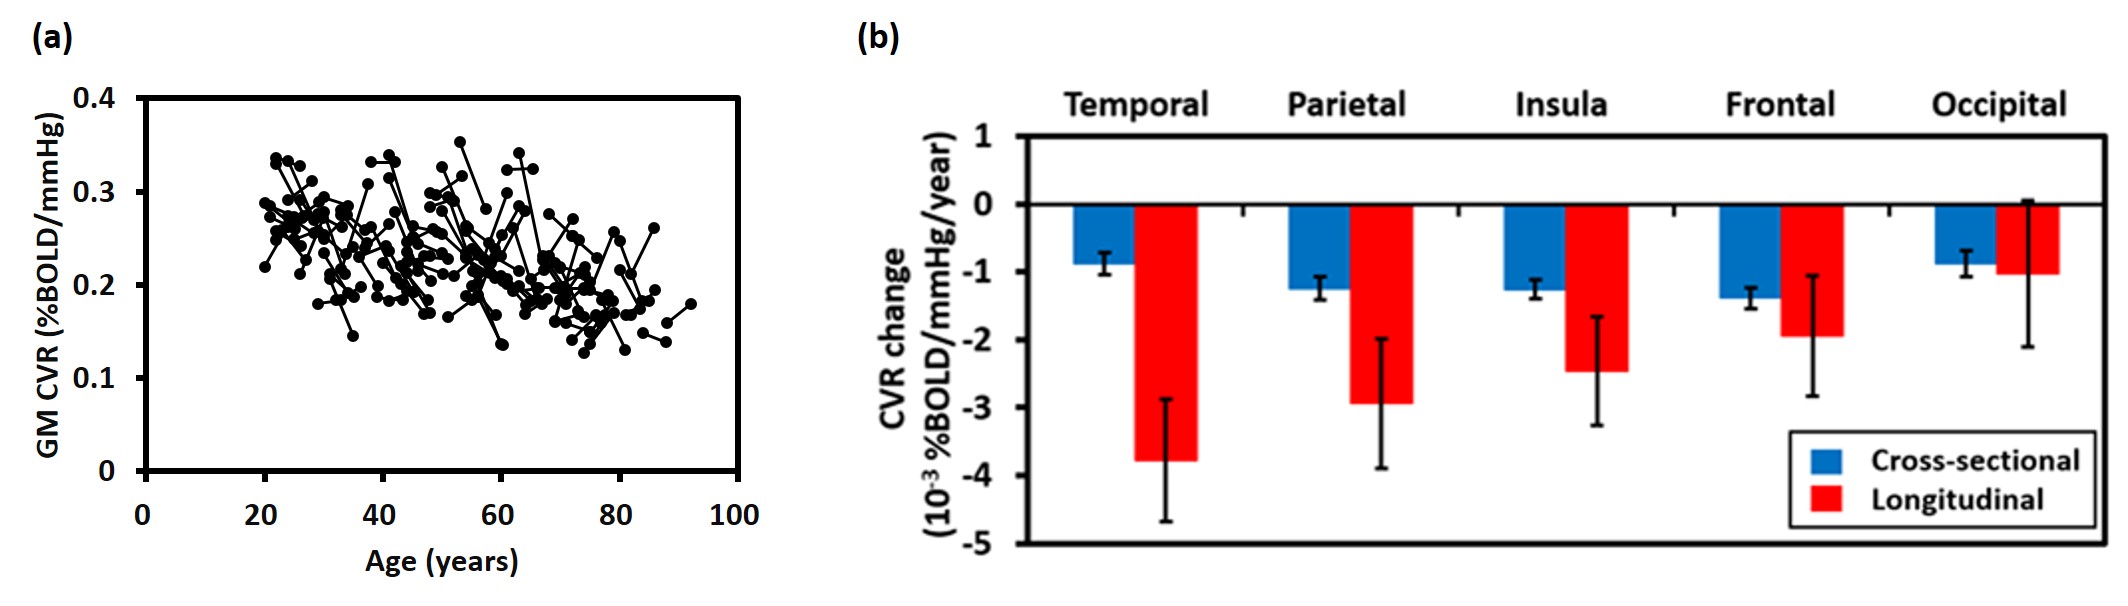
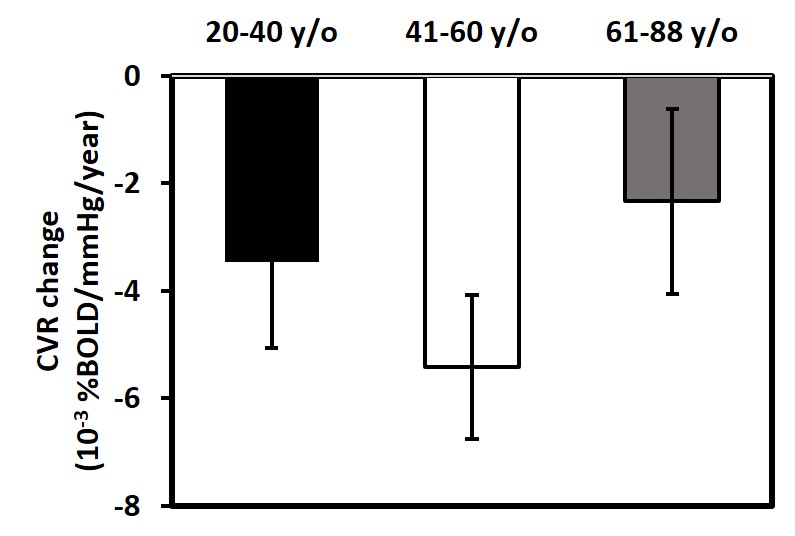
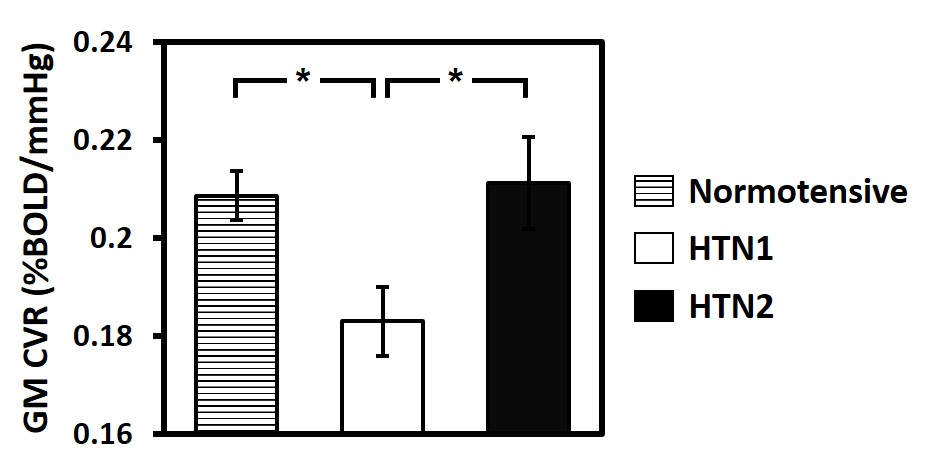
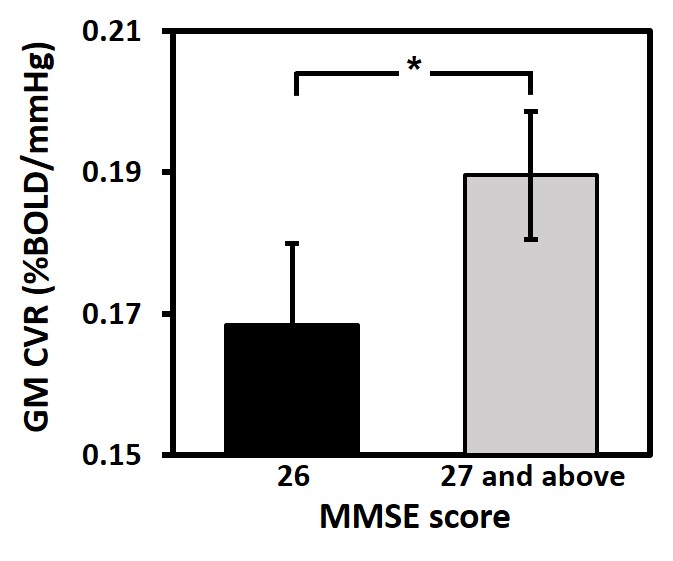
Age-related changes in CVR: Decade-by-decade CVR maps are shown in Figure 1a. Cross-sectional result of whole-brain gray matter (GM) CVR as a function of age is shown in Figure 1b. Regression analysis revealed an age-related decrease in CVR with a decline rate of 0.0011 %BOLD/mmHg/year (P<0.001). Whole-brain GM CVR values for the longitudinal data are plotted in Figure 2a. The longitudinal decline rate was significantly faster than the cross-sectional rate in temporal (P<0.001) and parietal lobe (P=0.03) (Figure 2b). Across brain lobes, rates of CVR decline varied. The longitudinal data revealed temporal lobe showed a faster decline rate than frontal (P<0.001) and occipital lobe (P<0.001). When stratifying by age, it can be seen CVR decline rate in the temporal lobe varies with age (Figure 3). Regression analysis between decline rate and age showed a quadratic dependence (P=0.027) between annual CVR decline rate and age, with the fastest decline appearing in the middle age. Impact of vascular risk on CVR: In the cross-sectional cohort, 35 subjects self-report a history of hypertension. Of these, they are divided into a sub-group (HTN 1) that has a history of hypertension and self-reports a current diagnosis of hypertension (N=21); and another sub-group (HTN 2) that has a history of hypertension but is not currently hypertensive (N=14). HTN 1 sub-group had a lower CVR (by -0.026 %BOLD/mmHg, P=0.013), compared to the normotensive group. Interestingly, CVR of HTN 1 sub-group is also lower (by -0.029 %BOLD/mmHg, P=0.026) than HTN 2 sub-group (Figure 4). Relationship between CVR and general cognitive status: In the cross-sectional cohort, elderly subjects with an MMSE score of 26 (N=15, 67 to 86 years) had a lower whole-brain CVR (P=0.048) compared to an age equivalent group (N=44, 67 to 88 years) who had higher MMSE scores (Figure 5).Discussion and Conclusion
This work showed that CVR, a specific biomarker of cerebral vasodilatory function, decreases with age. Decline in vascular function was most pronounced in the middle age. Hypertension causes a significant diminishment in CVR, but those with well controlled blood pressure seem to have a preserved CVR. Individuals with low MMSE scores, a widely used index for cognitive impairment, have lower whole-brain CVR. CVR imaging marker has the potential to be a diagnostic and therapeutic biomarker for cerebrovascular conditions in elderly populations.Acknowledgements
No acknowledgement found.References
1. Lu H, Xu F, Rodrigue KM, Kennedy KM, Cheng Y, Flicker B, et al. Alterations in cerebral metabolic rate and blood supply across the adult lifespan. Cereb Cortex. 2011;21:1426-1434
2. Yezhuvath US, Lewis-Amezcua K, Varghese R, Xiao G, Lu H. On the assessment of cerebrovascular reactivity using hypercapnia bold mri. NMR in biomedicine. 2009;22:779-786
Figures