0387
Whole Brain Inversion Recovery Diffusion Weighted Imaging Using Slice-Shuffled Acquisition1Center for Cognitive and Neurobiological Imaging, Stanford University, Stanford, CA, United States, 2Department of Electrical Engineering, Stanford University, Stanford, CA, United States, 3Department of Radiology, Stanford University, Stanford, CA, United States, 4Applied Sciences Laboratory West, GE Healthcare, Menlo Park, CA, United States
Synopsis
Combined acquisition of diffusion weighted MRI and T1 relaxation allows us to extract information about the microstructures of human brain on a sub-voxel level. We design an inversion recovery pulse sequence with diffusion weighting using the slice-shuffled technique to accelerate the T1 measurement and demonstrate whole brain scans acquired in under 20 minutes. We show potential applications of the sequence in differentiating the T1 relaxation of compartments with different diffusion properties within a voxel .
Introduction
Quantitative measurement of T1 relaxation in human brain has been extensively studied, and knowledge of the relaxation time is used to characterize brain tissues. In a typical measurement, the T1 value is a mixed relaxation of complex sub-voxel structures such as crossing fibers in white matter. Introducing diffusion weighted imaging (DWI) into the T1 measurement allows us to differentiate the T1 relaxation of compartments with different diffusion properties1,2. Here we design and test an inversion recovery (IR) DWI pulse sequence using the slice-shuffled (SS) technique3,4 to accelerate the T1 measurement. We demonstrate whole brain scans acquired in under 20 minutes and potential applications of the sequence.Methods
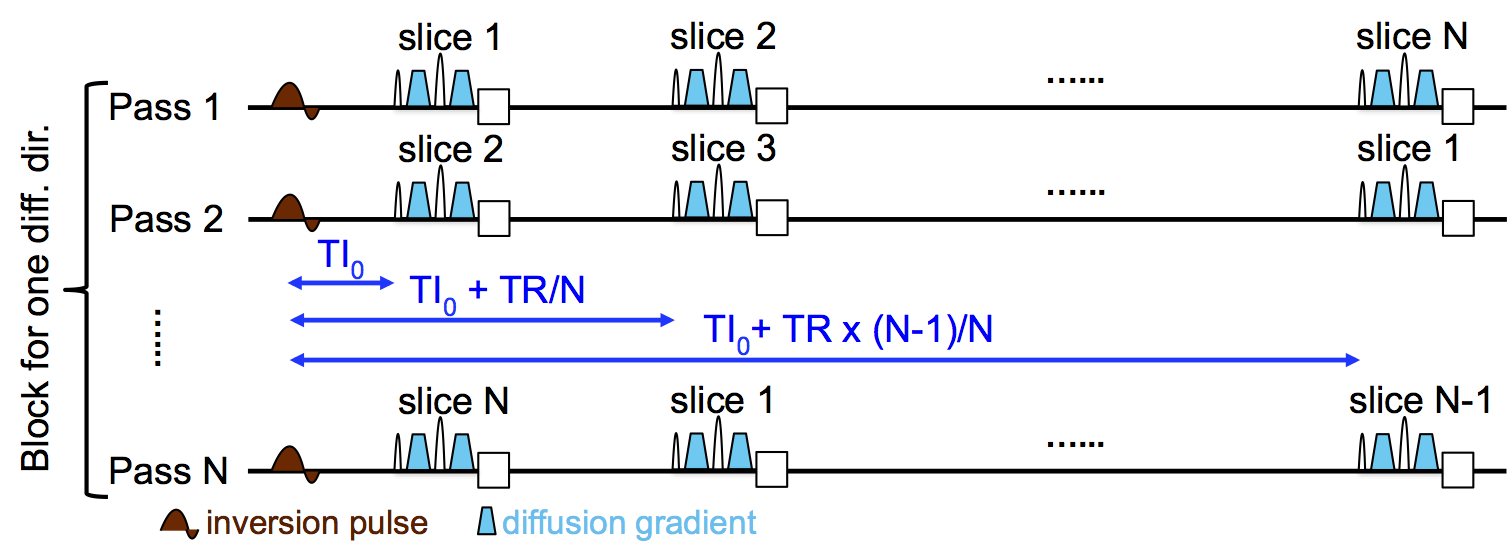
As shown in Fig.1, a non-selective inversion pulse was applied at the beginning of each TR, followed by an interleaved acquisition of all the slices with diffusion-weighting. The SS technique accelerates the sampling of T1 relaxation by shuffling the slice acquisition order each TR. All slices are acquired at N different TI's in N TR's, with TI=TI0+n$$$\cdot$$$TR/N where TI0 is the TI of the first slice acquired, N is the number of prescribed slices. The block of N TR's is then repeated for Nd diffusion directions, so that each combination of diffusion direction and inversion time (g, TI) is measured at least once. In total the SS IR-DWI sequence requires N$$$\cdot$$$Nd times TR to acquire N$$$\cdot$$$Nd data points.
We performed in-vivo scans on a GE Discovery MR750 3T scanner with a Nova 32-channel head coil. Simultaneous multi-slice (SMS)5 was applied to accelerate the scan. The scan parameters for a complete SS IR-DWI measurement were: TE/TR/TI0=63.7/2750/50 ms, FOV=22 cm, matrix size=110x110, slice thickness=2 mm, # prescribed slices=11, SMS factor=5, # diffusion directions=30, # b0 images=6, b-value=1000 s/mm2; total scan time=19.5 min. To estimate the signal-to-noise-ratio (SNR) we also acquired diffusion weighted images along diffusion direction R-L at b=1000 and 2000 respectively. All scans were performed with a 0.65 partial-k acquisition. Blipped-CAIPI6 together with a 1/3 field-of-view shift were applied to minimize the slice-aliasing artifacts. Image reconstruction was done with a home-built Matlab package using split-slice-GRAPPA7 and SENSE1 coil combination8.
Results and Discussions
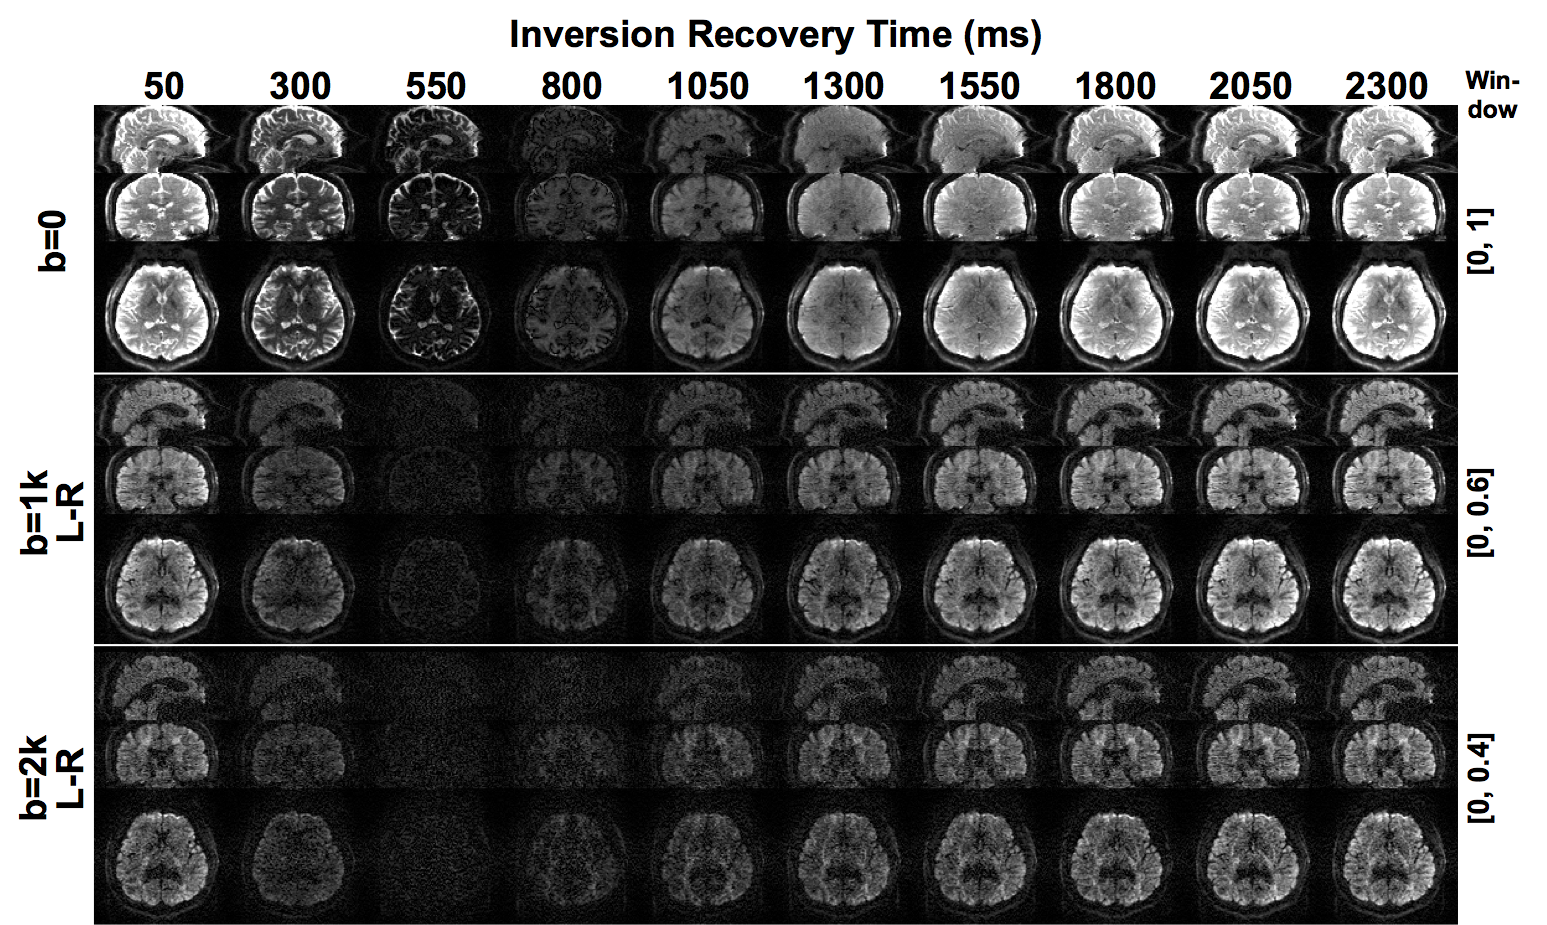
Fig.2 shows the raw images from the whole brain scans at b=0, 1000 and 2000 for diffusion direction R-L. Fig.3 shows the SNR map of a typical axial slice in the center of the brain and the average SNR in white matter. The expected variation in signal level for different TI's can be seen in the images. The signal from white matter is the weakest for TI=550 ms as this is near the null point of white matter magnetization at 3T.
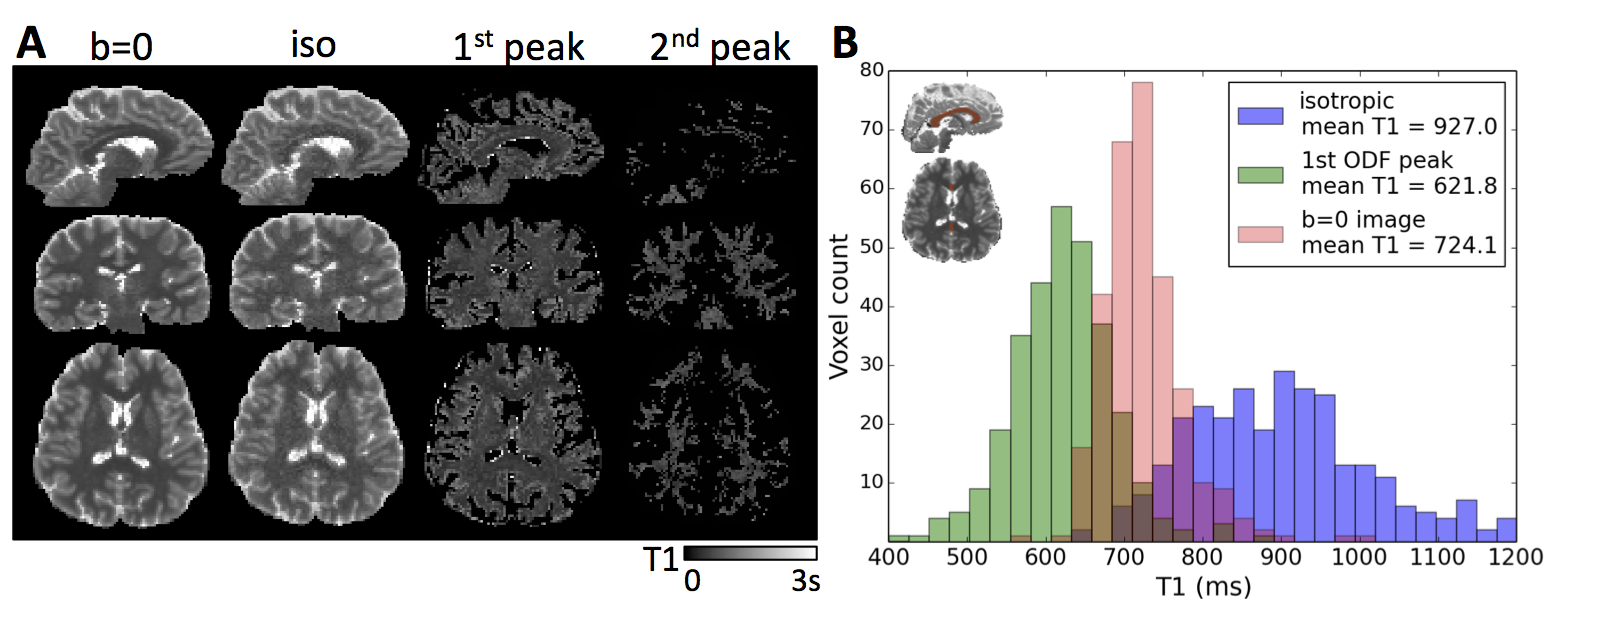
One important application of this new sequence is to estimate the T1 relaxation of the brain in combination with its diffusion properties. As proposed in Ref.1, the IR-DWI signal can be modeled by the sum of different diffusion compartments within each single voxel, weighted by the T1 relaxation of that compartment: S(g,TI)=S0$$$\sum$$$i$$$\{$$$fi$$$\cdot$$$exp(-gTDi g)$$$\cdot$$$[1- c$$$\cdot$$$exp(-TI/T1i)]$$$\}$$$, c being the efficiency of the inversion pulse, Di the diffusion tensor, fi the volume fraction of each compartment. We added another term i=0 to this equation to represent the isotropic diffusion compartment. Using the peaks of the fiber orientation distribution function (ODF) and their volume fraction information (FSL's bedpostx) obtained from a separate HARDI scan, we fit the above model with the IR-DWI data to extract the T1 and diffusivity coefficient for up to three compartments, i.e. the isotropic, first and second ODF peaks. Fig.4A shows the fitted T1 values over whole brain compared to the T1 obtained from the non-diffusion weighted images using the single exponential model9, S(TI)=S0[1- c$$$\cdot$$$exp(-TI/T1)]. Fig.4B shows an exemplary region-of-interest covering corpus callosum where we know the dominant terms should be the isotropic and the first ODF peak. We observe a significant difference between the T1 of the isotropic diffusion compartment and the T1 associated with the first ODF peak when using the multi-exponential model, whereas the T1 from the b=0 images is effectively a mixed average of the former two T1's. This result showed the prospective of using the IR-DWI data to separate different diffusion compartments as related to fiber orientations, and potentially observe the T1 relaxation of different fiber bundles over the whole brain.
Conclusions
We developed a slice-shuffled IR-DWI sequence that allows simultaneous measurement of T1 and diffusion properties across the whole brain in a feasible scan time. The new sequence has potential applications in characterizing the T1 relaxation of brain tissues with mixed diffusion compartments such as those introduced by crossing-fibers.Acknowledgements
No acknowledgement found.References
1. De Santis S, Barazany D, Jones DK, Assaf Y. Resolving relaxometry and diffusion properties within the same voxel in the presence of crossing fibres by combining inversion recovery and diffusion-weighted acquisitions. Magnetic Resonance in Medicine. 2016;75(1):372-380. doi:10.1002/mrm.25644.
2. De Santis S, Assaf Y, Jeurissen B, Jones DK, Roebroeck A. T1 relaxometry of crossing fibres in the human brain. Neuroimage. 2016;141:133-142. doi:10.1016/j.neuroimage.2016.07.037.
3. Ordidge R, Gibbs P, Chapman B, Stehling M, Mansfield P. High-speed multislice T1 mapping using inversion-recovery echo-planar imaging. Magn Reson Med. 1990;16(2):238–245.
4. Wu H, Dougherty RF, Kerr AB, Zhu K, Middione MJ, Mezer A. Fast T1 mapping using slice-shuffled simultaneous multi-slice inversion recovery EPI. In: Proc. Int. Soc. Magn. Reson. Med. vol. 23; 2015. p. 6225.
5. Feinberg DA, Moeller S, Smith SM, Auerbach E, Ramanna S, Glasser MF, et al. Multiplexed echo planar imaging for sub-second whole brain FMRI and fast diffusion imaging. PLoS One. 2010;5(12):e15710.
6. Setsompop K, Gagoski BA, Polimeni JR, Witzel T, Wedeen VJ, Wald LL. Blipped-controlled aliasing in parallel imaging for simultaneous multi-slice echo planar imaging with reduced g-factor penalty. Magn Reson Med. 2012;67(5):1210–1224.
7. Cauley SF, Polimeni JR, Bhat H, Wald LL, Setsompop K. Interslice leakage artifact reduction technique for simultaneous multislice acquisitions. Magn Reson Med. 2014;72(1):93–102.
8. Sotiropoulos S, Moeller S, Jbabdi S, Xu J, Andersson J, Auerbach E, et al. Effects of image reconstruction on fiber orientation mapping from multichannel diffusion MRI: reducing the noise floor using SENSE. Magn Reson Med. 2013;70(6):1682–1689.
9. Barral JK, Gudmundson E, Stikov N, EtezadiAmoli M, Stoica P, Nishimura DG. A robust methodology for in vivo T1 mapping. Magn Reson Med. 2010;64(4):1057–1067.
Figures