0381
Quantitative Off Resonance Saturation 3D UTE Imaging1GE Healthcare, San Diego, CA, United States, 2UCSD, CA, United States
Synopsis
Off-resonance saturation (ORS) is a tool which can be used in UTE magnetic resonance imaging to selectively reduce short T2 signals. Here we develop a simple quantitative theoretical model. The theoretical equations can be used to determine the ORS sequence parameters such as foff and θORS to maximize short T2 contrast.
Introduction
Direct magnetic resonance (MR) imaging of tissues such as tendons, ligaments, and cortical bone which have short transverse relaxation times (T2s) has become possible with the development of ultrashort echo time (UTE) sequences [1-4]. Conventional UTE images are typically proton density weighted and lack short T2 contrast. Off-resonance saturation (ORS) is a tool which can be used with UTE MR imaging to selectively reduce short T2 signals. When ORS prepared UTE images are subtracted from non-suppressed UTE images, the short T2 signals are highlighted [5]. Here we develop a quantitative theoretical model to optimize the short T2 contrast. In addition, this model can be used to fit experimental data to calculate T2s for short T2 tissues.Theory
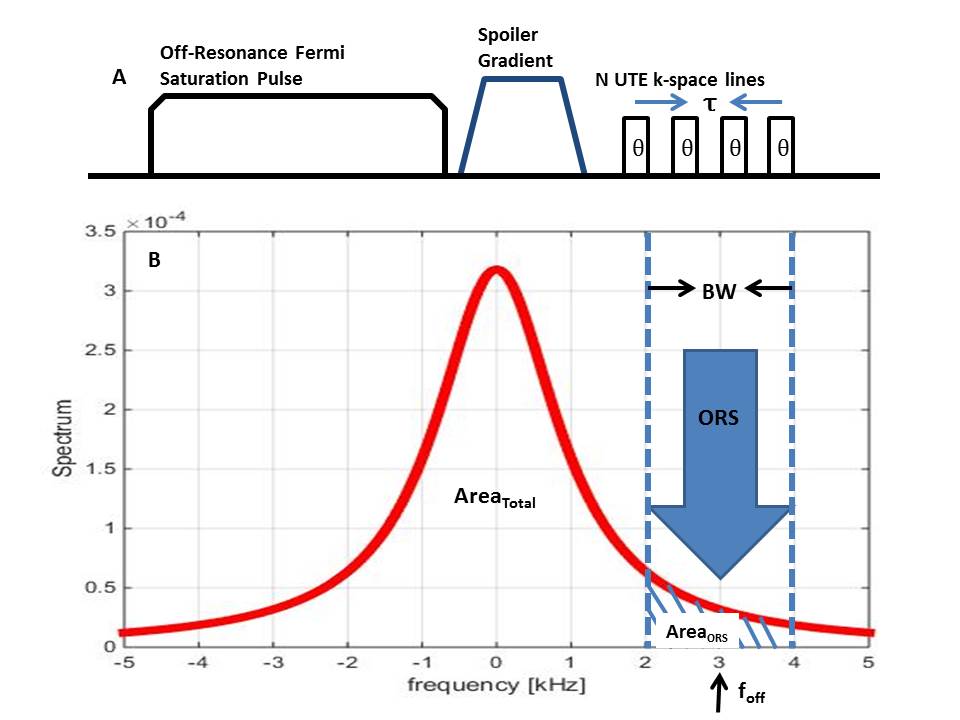
The
pulse sequence is shown in Fig.1. The ORS preparation module is repeated every
TR period, and is immediately followed by N separate k-space spokes during
short time intervals τ. With the
application of an off resonance saturation RF pulse with a flip angle of θORS,
the rate of saturation of the z-magnetization is given by: $$\frac{\text{d}M_z}{\text{d}\theta_{ORS}}=-\alpha \theta_{ORS} M_z [1]$$
leading to a Gaussian attenuation
with respect to θORS: $$M_z=M_0 exp\left(-\frac{\alpha \theta_{ORS}^2}{2}\right) [2]$$
The proportionality constant α
which determines the saturation efficiency can be calculated by the spectral
area covered by the off-resonance RF pulse divided by the total spectral area
(see Fig.1B): $$\alpha \equiv\frac{Area_{ORS}}{Area_{Total}}\approx\frac{2T_2BW}{1+\left(2\pi f_{off}T_{2}\right)^2} [3]$$
Qualitatively this implies that the saturation rate increases as
the RF bandwidth (BW) is increased or as the RF off resonance frequency (foff)
is brought closer to the resonance frequency of the spins, as would be
expected. One can calculate an expression for the area covered by the ORS pulse by
integrating the normalized Lorenzian line shape over the bandwidth covered by
the ORS pulse:
assuming that the line shape is
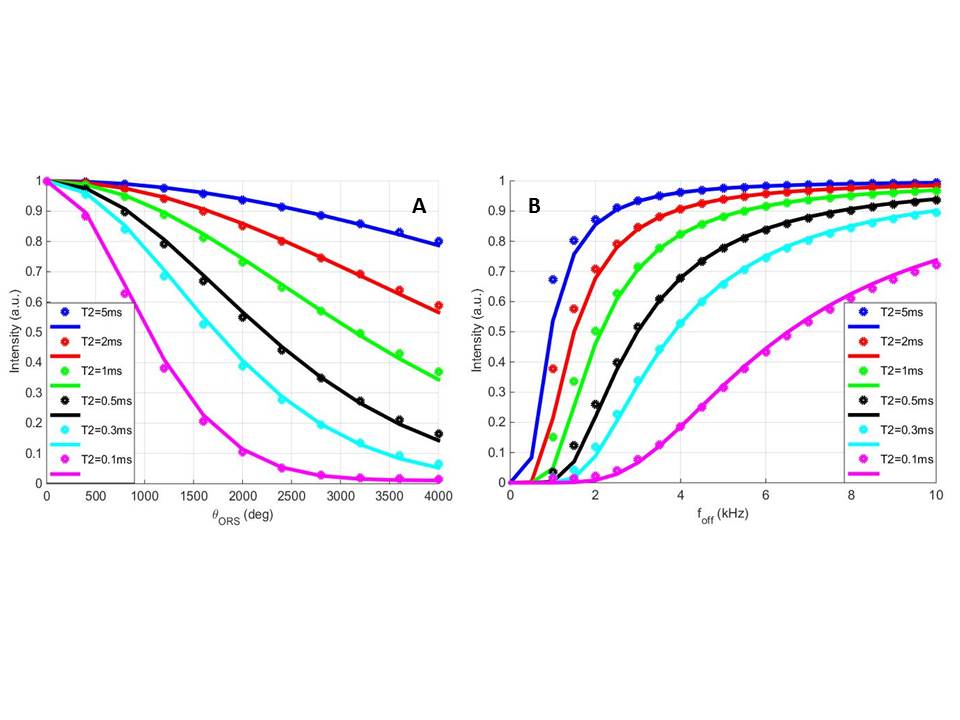
properly normalized (i.e. AreaTotal = 1). Eq.[1] was compared to
Bloch simulations. Fig.2A shows the Bloch simulations as well as the
theoretical signal curves as a function of saturation flip angle which exhibit
the expected Gaussian shapes. Fig.2B shows similar curves as a function of off-resonance frequency. Both show good agreement between Bloch simulations and
theoretical curves.
Methods
Volunteer
imaging was performed on a healthy male volunteer (age 28 yr) using an 8-channel knee coil on a 3T
GE HDxt clinical MR scanner. Off-resonance
saturation preparation was performed using a Fermi RF pulse (duration = 8 ms) with
a BW of 160 Hz and flip angle of θORS = 1500º. Relevant sequence parameters were field of
view (FOV) = 20 cm, matrix = 256x256, slice thickness = 4 mm, UTE RF duration TRF
= 70 µs, TE = 30 µs, TR = 300
ms, N = 10, τ = 4.3 ms, excitation
flip angle θ = 25º, and foff = [-500, 0, 500, 1000, 1500, 2000, 3000,
5000, 10000, 20000] Hz. Additionally, a reference scan was performed without
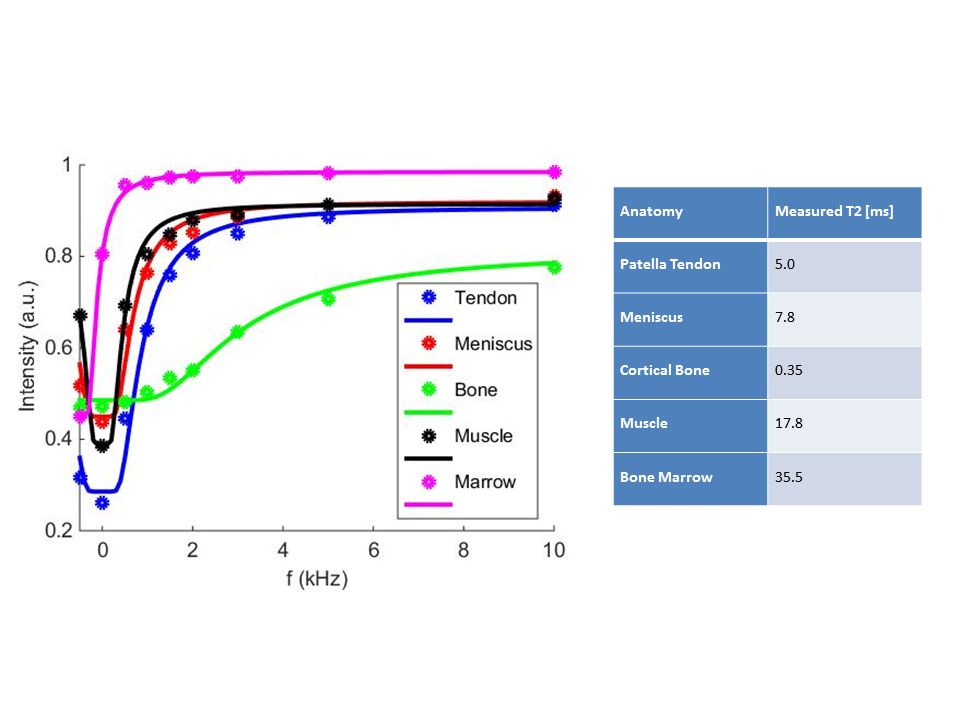
application of the ORS pulse. Five regions of interests (ROIs) were drawn in
patella tendon, meniscus, cortical bone, muscle, and bone marrow, respectively,
and their T2 values
were calculated according to Eq. [1].Results
The experimentally measured signal curves in the knee are shown in Fig.3 as a function of off-resonance frequency. All signals were normalized to the non-ORS signal levels. Both the experimental data points and the fitted theoretical curves are shown. Also shown next to the figure are the resulting fitted T2 values. The values for the short T2 tissues agree well with values published in the literature [6], however there were deviations for the longer T2 tissues such as muscle and fat.Conclusion
Off-resonance saturation 3D UTE imaging can be used to generate contrast between tissues with long T2 signals and those with short T2 signals. The theoretical equations developed here match the simulated and experimental data well, and can be used to determine the ORS sequence parameters such as foff and θORS to maximize short T2 contrast. The quantitative ORS technique provides a novel approach to measure T2s for short T2 tissues.Acknowledgements
The authors acknowledge grant support from NIH (1R01 AR062581-01A1, 1 R01 AR068987-01)References
[1] Rahmer J et al, Magn Reson Med, 2006. 55(5): p.1075-82.
[2] Du J et al, Magn Reson Imag 2011:29:470–482
[3] Weiger M et al, NMR Biomed. 2015 28(2):247-54
[4] Li C et al, Magn Reson Med 2012 68(3):680
[5] Du J et al, Magn Reson Med 2009; 62:527-531.
[6] Robson MD et al, J Comput Assist Tomogr, 2003. 27(6): p. 825-46.
Figures