0380
The magic angle effect can (partially) explain load-induced increases in meniscal T2 and T1ρ1Department of Radiology, Academic Medical Center, Amsterdam, Netherlands, 2Biomedical NMR, Department of Biomedical Engineering, Eindhoven University of Technology, Eindhoven, Netherlands, 3Orthopaedic Research Lab, Radboud UMC, Nijmegen, Netherlands, 4Biomedical Engineering and Physics, Academic Medical Center, Amsterdam, Netherlands
Synopsis
Often, knee injury and disorders are caused by or lead to abnormal biomechanical loading patterns in the knee joint menisci. Quantitative information on in vivo loading patterns is therefore in high demand to evaluate therapy and prevent further damage. T1ρ and T2 in meniscus were shown to increase upon application of compressive load, although the mechanisms leading to changes remain unclear. In this work we apply compressive load on the meniscus of volunteers and one cadaver and show that compression-induced internal fiber reorganization may manifest as the magic angle effect, which may be responsible for load-induced T2 and T1ρ increases.
Introduction
Often, knee injury and disorders are caused by or lead to abnormal biomechanical loading patterns in the knee joint menisci. Quantitative information on in vivo loading patterns is therefore in high demand to evaluate therapy and prevent further damage. Meniscal T1ρ and T2 values depend on the proteoglycan and collagen content, as well as on the tissue architecture, and were shown to increase upon application of load [1, 2]. Therefore, T1 ρ and T2 have been introduced as surrogate markers of knee load, although the underlying mechanisms leading to changes in the relaxation values with load remain unclear. The aim of this study was to investigate the origin of changes in meniscal T1ρ and T2 under compressive load. We hypothesize that these changes are caused by changes in the proton dipolar interactions when the internal fiber structure reorients upon compressive loading. In tissues with highly structured collagen compartments (e.g. meniscus) dipolar interactions are modulated by 3cos2(θ)-1, with θ the fiber orientation with respect to B0 field. Dipolar interactions are 0 for θ=54.7° (the magic angle) [3].Methods
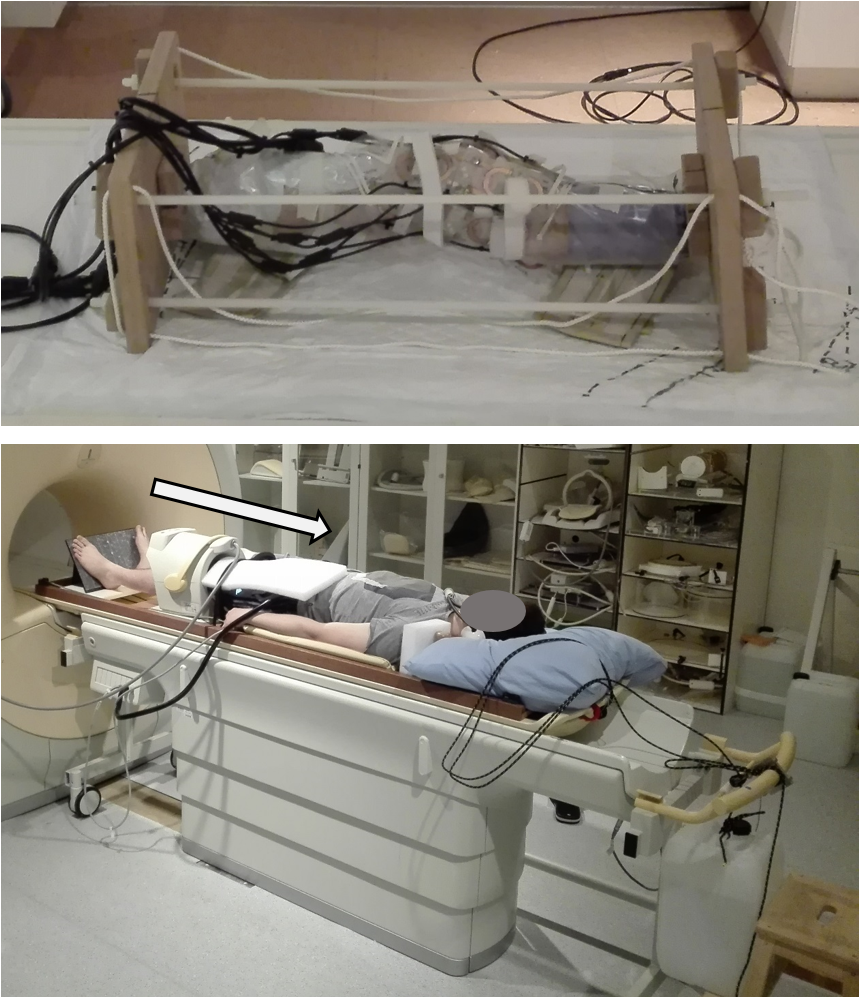
Experiments were performed in healthy volunteers and a human cadaver knee. A static compressive load of 25% body weight was applied using custom-made loading devices (Figure 1). All images were acquired sagittally.
In vivo: 17 young healthy volunteers aged 27.0 ± 2.7 years were recruited with informed consent. All experiments started after 1 hour of non-weight-bearing and were done at 3T (Philips Achieva). After a 3D water-selective single-shot TFE anatomical scan, T1ρ (300Hz, 0/10/20/35 ms) and T2 (0Hz) scans were measured using a B0-and B1-compensated preparatory pulse sequence [4]. Subsequently the compressive load was applied and the T2 and T1ρ scans were repeated after 30 minutes. An 8-channel knee coil was employed. Registration (elastix™) and manual segmentation (ITK-SNAP 3.4.0) were performed to yield four different groups of ROIs: global, individual, horn/body, and circumferential. A pixelwise monoexponential decay curve fit was done (Mathematica 10.1). N=14 T2 and N=15 T1ρ datasets were statistically evaluated (SPSS 23.0). Simple effects analysis (α=0.05) was applied to investigate the effect of loading in each ROI.
Ex vivo: One cadaver knee was scanned in 4 different orientations (circa 0°/10°/25°/35° with respect to B0) in unloaded and loaded configuration using a 3T Philips Ingenia scanner. A proton density-weighted anatomical scan was followed by the same T1ρ and T2 measurements used in the in vivo experiments. A flexible 15-channel knee coil was employed (Figure 1, top). Pixelwise fits were applied and mean values were determined in ROIs drawn in the medial meniscus. All images were rigidly registered to the scan obtained for the leg parallel to B0 (elastix™).
Results
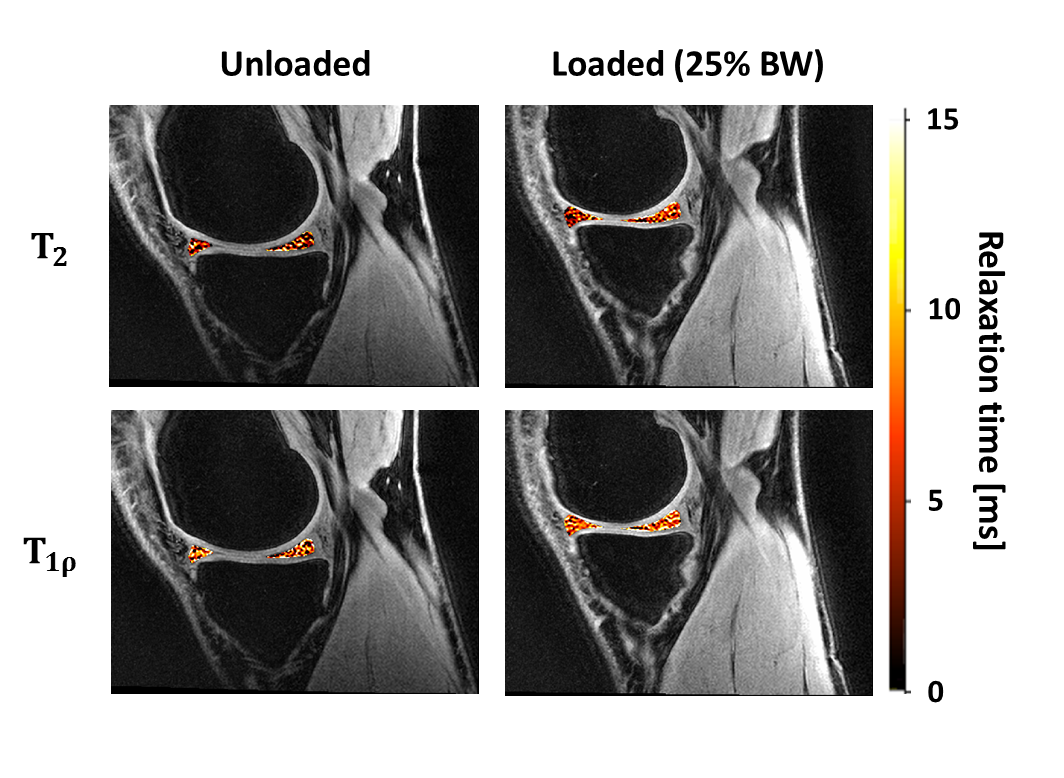
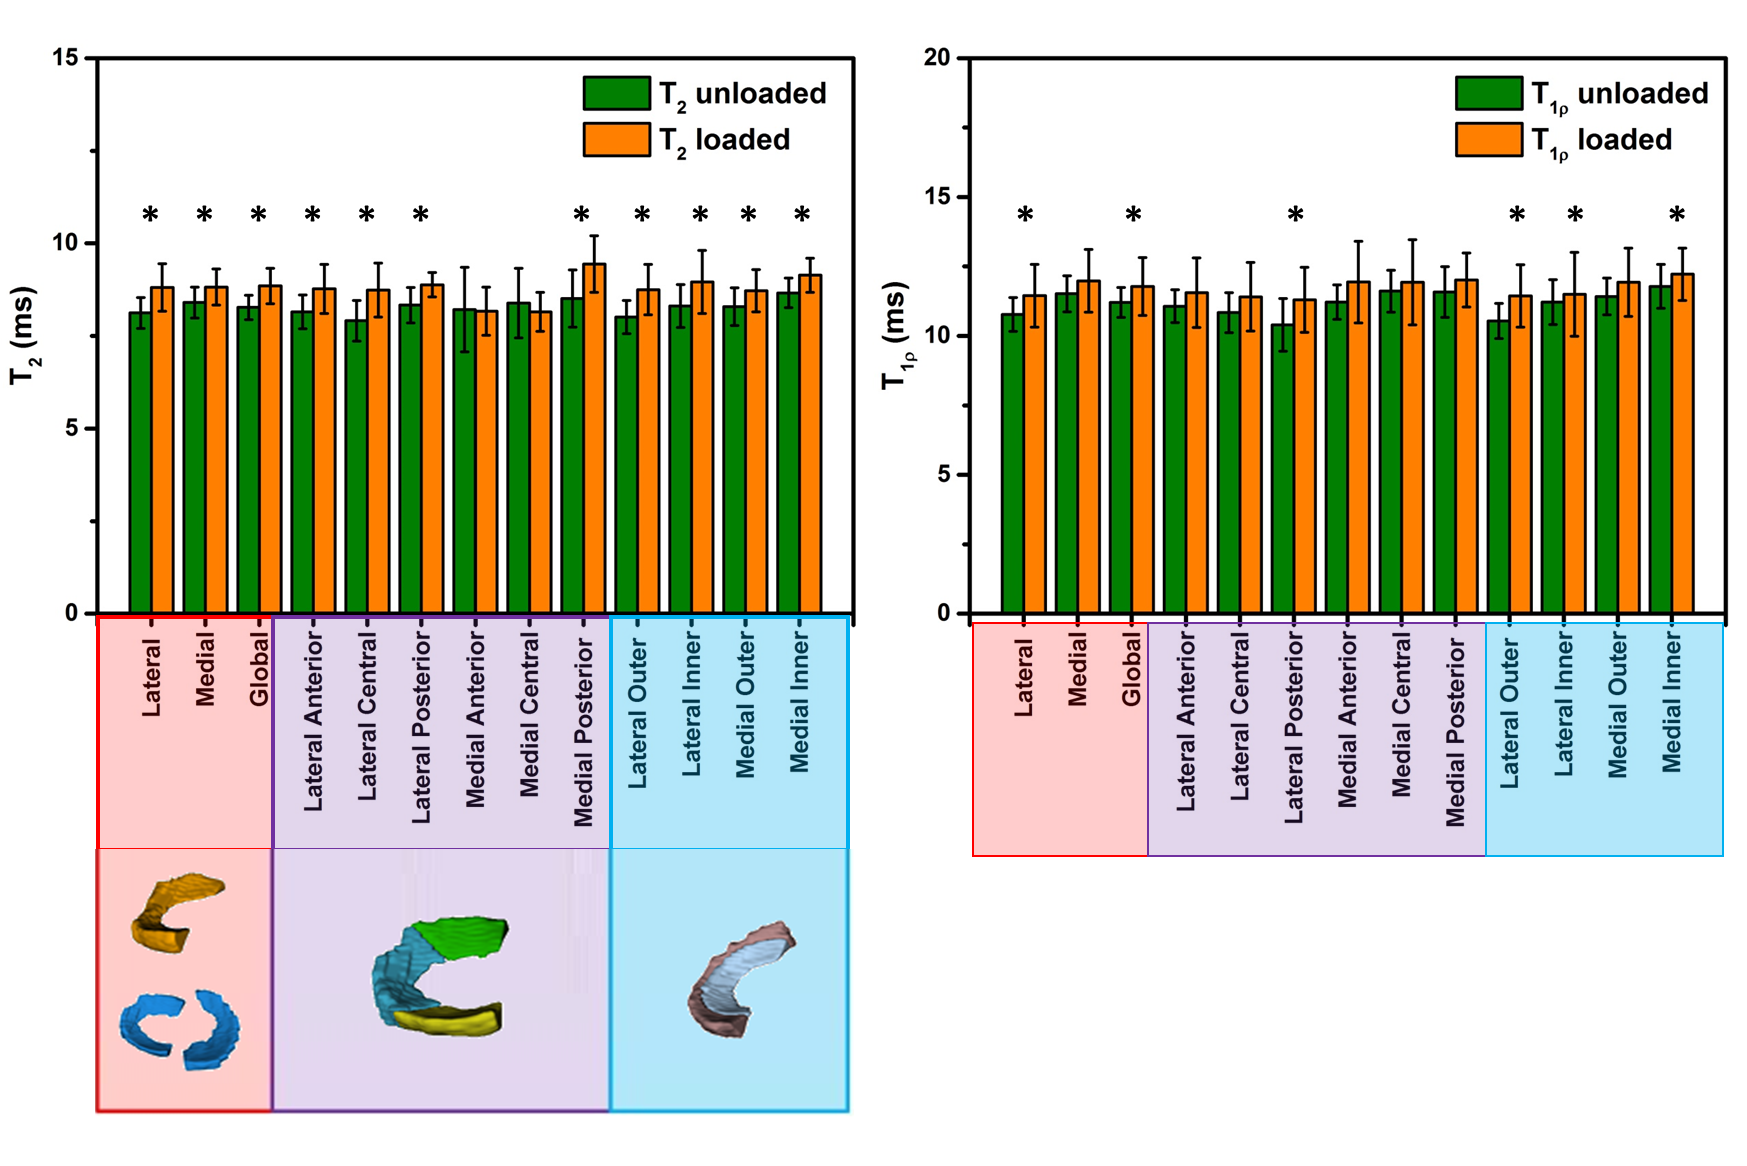
In vivo: Figure 2 shows representative T2 and T1ρ maps for both loading situations. Loading had a significant effect on the mean T2 in each ROI (p< 0.028) except for the medial anterior and central meniscus, while it significantly affected T1ρ only in the global, lateral whole, posterior and outer meniscus and the medial anterior horn (p < 0.04) (Figure 3).
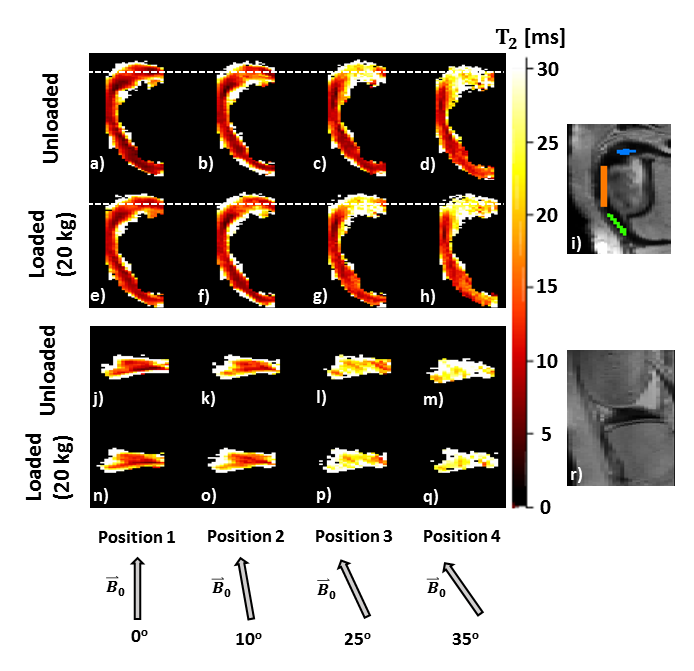
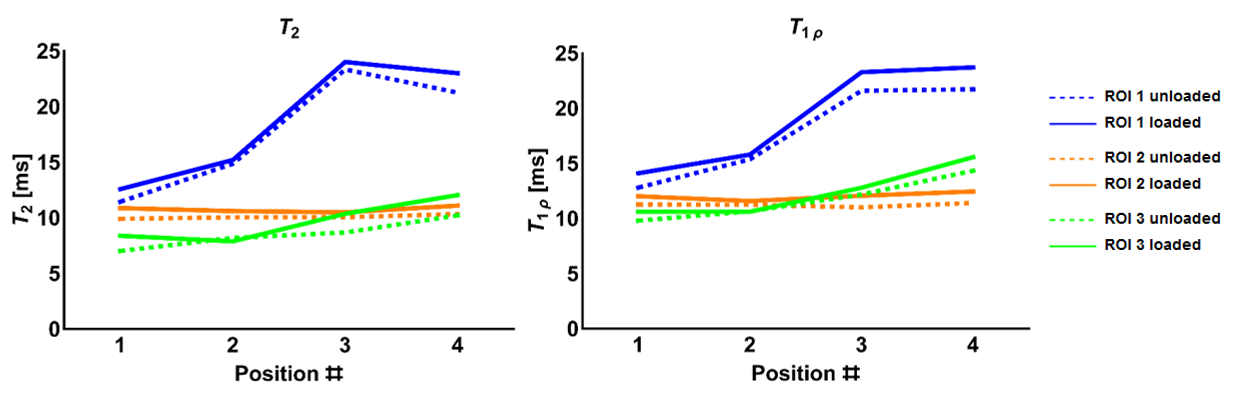
Ex vivo: Figure 4 and 5 show increased T1ρ and T2 as a function of orientation in ROI 1 and 3, while no change was observed in ROI 2. T2 had a larger dynamic range than T1ρ as a function of sample orientation. Generally, increases in response to loading were observed as well, with larger changes seen at larger angles of the samples to B0.
Discussions
The load-induced increases observed in vivo were in agreement with the increases found in previous studies [1,2], which confirms that in the meniscus T2 seems more sensitive to changes in load than T1ρ. In the ex vivo experiment T1ρ and T2 values were higher in the loaded configurations when the leg was placed parallel to B0, in agreement with the in vivo results obtained at the same position. The larger dynamic range seen ex vivo likely is a result of the higher sensitivity of T2 to changes in fiber-to-B0 angle resulting from the dipolar interactions. In fact, there was an angle-dependent increase in the relaxation times, with higher differences observed for increasing angle of rotation. The presented data appear to support our hypothesis that compression-induced internal fiber reorganization may manifest as the magic angle effect, which may be responsible for load-induced T2 (and T1ρ, although to a smaller extent) increases. Information on the actual fiber orientation/architecture obtained from histology or dissection and changes therein upon loading might provide further evidence to support our findings.Acknowledgements
The authors acknowledge Ing. Richard van Swam (Radboud UMC) for help in designing and manufacturing the ex vivo loading deviceReferences
[1] Subburaj et al., J Magn Res Imaging 41:536-543 (2015)
[2] Calixto et al., J Orthop Res 34:249–261 (2016)
[3] Erickson et al., Radiology 188:23-25 (1993)
[4] Zeng et al., Proc. Intl. Soc. Mag. Reson. Med. 14:2356 (2006)
Figures