0379
Collagen fiber to magnetic field angle dependence in human meniscus – a preliminary T2* MR-microscopy study at 7T1High Field MR Centre, Department of Biomedical Imaging and Image-guided Therapy, Medical University of Vienna, Vienna, Austria, 2Christian Doppler Laboratory for Clinical Molecular MR Imaging, Vienna, Austria, 3Department of Orthopaedic Surgery, Medical University of Vienna, Vienna, Austria, 4Department of Imaging Methods, Institute of Measurement Science, Slovak Academy of Sciences, Bratislava, Slovakia, 5Department of Radiology, Division of Radiological Physics, University of Basel Hospital, Basel, Switzerland, 6Center for Medical Physics and Biomedical Engineering, Medical University of Vienna, Vienna, Austria
Synopsis
We evaluated the fiber-to-field dependence of a meniscal specimen using T2* mapping on high-field 7T MRI in combination with an MR microimaging insert and validated the results with histology. We found that, different structures of the meniscus behave very differently with orientation to the magnetic field. For example, short T2/T2* tendon-like structure located in the external circumference showed strongest T2* dependence reflecting the anisotropic nature of these structures and consequential incomplete averaging of dipolar coupling. The results shown here are the first MR Microscopy evaluations of the orientational dependence of T2* relaxation in human meniscus.
Purpose
The aim of this study was to visualize how quantitative T2* values reflect the local differences of the human meniscus in collagen fiber orientation and tissue morphology in dependence to the main magnetic field. The study was performed with an MR microscopy insert at 7T MRI and the findings were histologically validated.Introduction
Human knee meniscus as a fibrocartilage tissue, represents a complex architecture in fibril organization. Mono and bi-exponential T2* mapping with a variable echo times sequence [1] have been found to be sensitive to degenerative changes in menisci [2]. Interestingly, highly orientated collagen tissues with short T2/T2* such as tendon, ligament and meniscus are prone to magic angle artifacts due to unaveraged dipolar interaction [3,4] and the understanding of fiber-to-field dependence of meniscus structures could contribute to the improvement of musculoskeletal MR imaging. Our aim was to use quantitative MR microscopy to investigate how T2* values within different meniscal zones variate depending on the orientation of the collagen fibers to the main magnetic field.Methods
MRI of human meniscus (64a, female) was performed at 7T (Magnetom Siemens Healthineers, Erlangen, Germany) using a microimaging system [5] (gradient strength: 750 mT/m) and a 39 mm proton NMR volume coil (Rapid Biomedical, Wuerzburg, Germany).
Prior to imaging, the meniscus specimen was imbedded in the middle of a 30mm diameter plastic sphere filled with physiologic saline solution.
For morphological evaluation of the meniscus structure, a spin echo proton density weighted sequence was used. Image parameters: TE = 6.4 ms, TR = 3500 ms, FA = 180°, FOV = 30 x 30 mm, matrix = 448 x 448, pixel size = 67 x 67 μm, slice thickness = 0.4 mm, slice offset =100%, number of slices = 14.
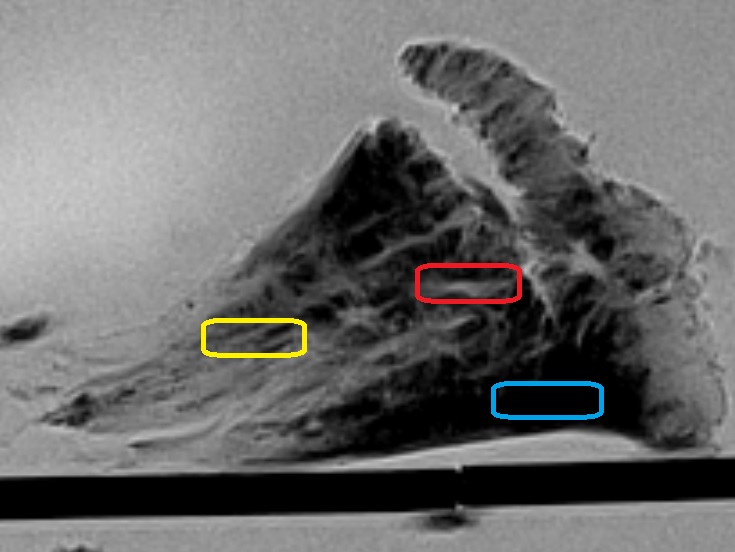
For quantitative mono-exponential T2* assessment a 3D variable echo time (vTE) sequence was used, which allows sub-ms echo time by using asymmetric readout and a variable echo time scheme in phase and slice encoding direction [1]. Image parameters: 12 TEs ranging from 0.82 to 23.55 ms, TR = 38 ms, FA = 17 ms, FOV = 30 x 30 mm, matrix = 448 x 448, pixel size = 67 x 67 μm, slice thickness = 0.4 mm, number of slices = 72. All measurements (PD- weighted, T2*) were performed in both axial and coronal direction of the meniscus and in three orientations: 0°, 55° and 90°. ROIs were defined in three different areas representing the variability in human meniscus depicted in the PD image in Fig. 1.
After the MR experiment, the meniscus was fixed in 4% formalin, decalcified, dehydrated and embedded in paraffin for histological processing in coronal and axial direction. Deparaffined 2.5 µm sections were stained with Picrosirus red (PSR).
Results
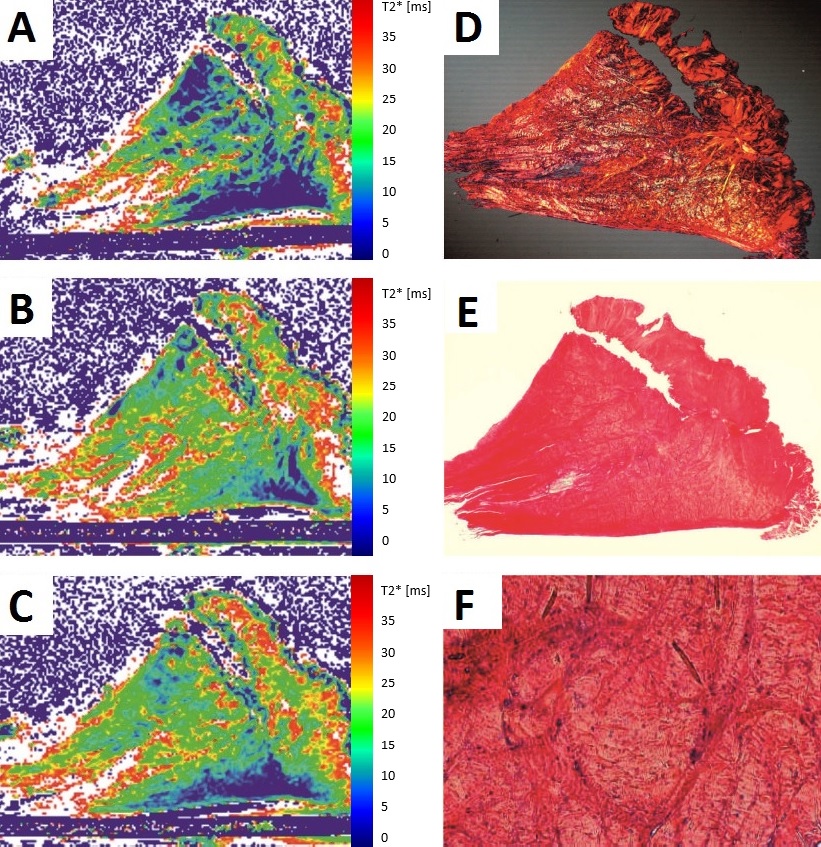
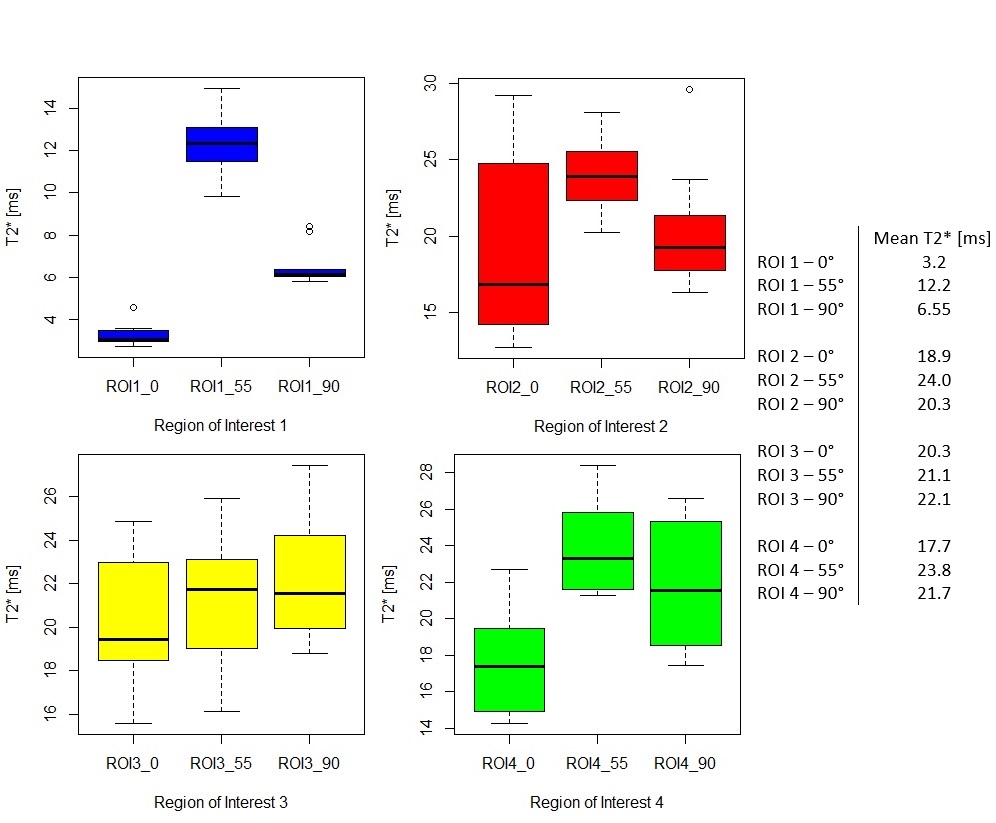
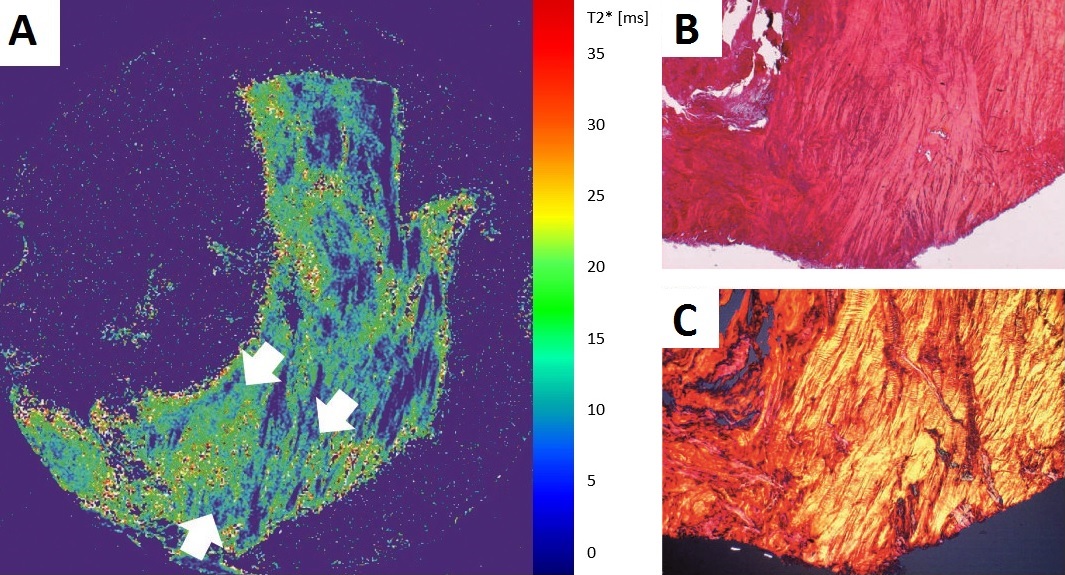
MR Microscopy identified a zonal variety of T2* values in the meniscus which highly depends on the orientation of the collagen fibers to the magnetic field.Tendon-like structure located in the external circumference showed strongest dependence reflecting the anisotropic motions of these tissues and the consequential incomplete averaging of dipolar coupling (Fig. 2, 3, 4). In contrast, fibrous-like tissue and fibrocartilage morphology show less angle dependent changes (Fig. 2,3,4) which can be attributed to the nature of this structures, which is less anisotropic and averages dipolar interaction with time.Discussion
We showed that T2* values are changing with orientation especially in highly orientated tendon-like parts of the meniscus. This is in line with the results of Henkelmann [7], who found that particularly short relaxing components are affected by orientation due incomplete averaging of dipolar coupling.
A bi-exponential T2* decay could not be found on a pixel by pixel basis with microscopic resolution. This seems to be in contradiction to the results of high resolution T2* mapping in vivo [2]. However, we assume that this can simply be attributed to the compartmentalization of the meniscus. With increased voxel size, the probability of voxels covering multiple tissue types of the meniscus at once (for example tendon-like collagen fibers and fibrous tissue together) will be increased.
Conclusion
The results reported herein are the first MR Microscopy evaluations of the orientational dependence of T2* relaxation in human meniscus. The 3D vTE sequence allows microscopic T2* mapping of meniscal tissues in reasonable scan times. The fiber-to-field experiment shows, that different regions of the meniscus show considerable changes in T2* values with orientation, e.g. factor 4 for highly oriented tendon-like structure in the external circumference, while for other, less orientated structures, there is only a minor change.Acknowledgements
No acknowledgement found.References
[1] Deligianni X. et al., High-resolution Fourier-encoded sub-millisecond echo time musculoskeletal imaging at 3 Tesla and 7 Tesla. Mag. Reson. Med. 2012; 70(5): 1434-1439
[2] Juras V. et al., Quantitative MRI analysis of menisci using biexponential T2* fitting with a variable echo time sequence, Mag. Reson. Med. 2014; 71(3): 1015–1023
[3] Szeverenyi N. M., Bydder G.M., Dipolar anisotropy fiber imaging in a goat knee meniscus. Mag. Reson. Med. 2010; 65(2): 463-470
[4] Fullerton G.D., Cameron I.L., Ord V.A., Orientation of tendons in the magnetic field and its effect on T2 relaxation times. Radiology 1985 May; 155(2):433-5.
[5] Berg A., Potthast P., Starewicz, MR- Microscopy on a human 7T-scanner. Proc. ISMRM/ESMRMB 2010, progr nr. 1048, Stockholm, Sweden, 2010
[6] Deligianni X. et al., Water-selective excitation of short T2 species with binomial pulses. Mag. Reson. Med. 2013; 72(3): 800-805
[7] Henkelman R.M. et al., Anisotropy of NMR properties of tissues. Magn Reson Med 1994;32:592–601
Figures