0375
Bi-Component Ultra-short Echo-Time T2* Analysis in Patients with Patellar TendinopathyFang Liu1, John Wilson2, and Richard Kijowski1
1Department of Radiology, University of Wisconsin-Madison, Madison, WI, United States, 2Department of Orthopedics, University of Wisconsin-Madison, Madison, WI
Synopsis
A bi-component ultra-short echo-time (UTE) T2* mapping sequence was performed on the knees of 10 patients with patellar tendinopathy and 10 healthy volunteers at 3T. The fraction of the fast relaxing water component (FF) and the T2 relaxation times of the fast relaxing (T2*F,) and slow relaxing (T2*S) water components of patellar tendon were measured. Patients with patellar tendinopathy had significantly lower FF (P=0.007), significantly higher T2*F (P=0.014), and similar T2*S (P=0.10) of patellar tendon when compared to healthy volunteers. Our results suggest that bi-component UTE T2* analysis can detect early compositional and microstructural changes in degenerative tendon.
Introduction
A bi-component ultra-short echo-time (UTE) T2* mapping sequence was performed on the knees of 10 patients with patellar tendinopathy and 10 healthy volunteers at 3T. The fraction of the fast relaxing water component (FF) and the T2 relaxation times of the fast relaxing (T2*F,) and slow relaxing (T2*S) water components of patellar tendon were measured. Patients with patellar tendinopathy had significantly lower FF (P=0.007), significantly higher T2*F (P=0.014), and similar T2*S (P=0.10) of patellar tendon when compared to healthy volunteers. Our results suggest that bi-component UTE T2* analysis can detect early compositional and microstructural changes in degenerative tendon.Methods
An MRI examination of the knee was performed on 10 patients with clinically diagnosed patellar tendinopathy and 10 healthy volunteers on a 3T scanner (Discovery MR750, GE Healthcare) using an 8-channel phased-array extremity coil. Sagittal intermediate weighted (TR/TE=1600/30ms), fat-suppressed T2-weighted (TR/TE=3600/74ms), and UTE sequences were performed on all subjects. A three-dimensional (3D) gradient-echo-based, multi-echo UTE sequence (3D-Cones, GE Healthcare) was used to acquire a total of 16 echoes at 0.03, 0.1, 0.8, 1.6, 4.3, 6.0, 8.0, 10.0, 14.0, 16.0, 18.0, 20.0, 24.0, 26.0, 28.0, and 30ms with a 40ms TR, 20o flip angle, 16cm field-of-view, 256x256 matrix, 3mm slice thickness, one excitation, 10 slices through the patellar tendon, and 12 minutes total scan time [5]. Voxel-by-voxel least-squares curve fitting was performed in MATLAB to create bi-component T2* parameter maps of the fraction of the fast relaxing water component (FF) and the T2 relaxation times of the fast relaxing (T2*F,) and slow relaxing (T2*S) water components. The patellar tendon of all subjects was manually segmented on all image slices and superimposed over the bi-component T2* maps to measure the mean and standard deviation of FF, T2*F, and T2*S of patellar tendon. Wilcoxon sign rank test were used to compare bi-component T2* parameters of patellar tendon between patients with patellar tendinopathy and asymptomatic volunteers.Results
On the intermediate-weighted and T2-weighted images, seven patients with patellar tendinopathy and no healthy volunteers had thickening and increased signal intensity of the patellar tendon, while no patients with patellar tendinopathy and no healthy volunteers had other knee joint abnormalities. Figure 1 compares FF, T2*F, and T2*S maps of the patellar tendon in a patients with patellar tendinopathy and a healthy volunteer. As shown in Figure 2, patients with patellar tendinopathy had significantly lower FF (P=0.007) and significantly higher T2*F (P=0.014) of patellar tendon when compared to healthy volunteers with no significant difference in T2*S (P=0.10) between groups of subjects. As shown in Figure 3, noticeably lower FF and higher T2*F was visualized in the proximal patellar tendon of the three patients with patellar tendinopathy who had no corresponding changes in tendon morphology or signal intensity on intermediate-weighted and T2-weighted images.Discussion
Our study has shown that patients with patellar tendinopathy have significantly lower FF and significantly higher T2*F of patellar tendon when compared to healthy volunteers. Histologic studies have shown that tendon degeneration results in increased water content, decreased collagen content, and disruption of the highly ordered collagen fiber microstructure of tendon [6]. The lower FF in patients with patellar tendinopathy is likely due to the combined effects of decreased water bound to damaged collagen fibers and increased bulk water in degenerative tendon. The higher T2*F in patients with patellar tendinopathy is likely due to the fact that water bound to the damaged collagen fibers of degenerative tendon would have greater mobility and hence higher T2 relaxation time than water bound to intact macromolecules. Juras and associates used a multi-echo, variable echo-time UTE sequence with 20 echoes between 0.8ms and 20ms to perform bi-component T2* analysis of the Achilles tendon and found that patients with Achilles tendinopathy had significantly higher T2*F when compared to healthy volunteers [4]. However, this study did not find significant differences in FF between groups of subjects as demonstrated in our study which may be due to differences in experimental details including gradient systems, pulse sequence design, imaging parameters, and type of tendon evaluated. The noticeably lower FF and higher T2*F visualized in the proximal patellar tendon of patients with clinically diagnosed patellar tendinopathy and no corresponding changes on intermediate-weighted and T2-weighted images in our study suggests that bi-component T2 parameters can detect early changes in the composition and microstructure of degenerative tendon prior to changes to changes in tendon morphology. Additional studies with histopathologic correlation are needed to investigate the exact mechanisms responsible for changes in bi-component T2* parameters during various stages of tendon degeneration.Acknowledgements
We acknowledge support from NIH R01-AR068373-01, GE Healthcare, and University of Wisconsin Department of Radiology Research and Development Committee.References
[1] E. Diaz, C.B. Chung, W.C. Bae, S. Statum, R. Znamirowski, G.M. Bydder, J. Du, Ultrashort echo time spectroscopic imaging (UTESI): an efficient method for quantifying bound and free water, NMR Biomed, 25 (2012) 161-168. [2] E.Y. Chang, J. Du, S. Statum, C. Pauli, C.B. Chung, Quantitative bi-component T2* analysis of histologically normal Achilles tendons, Muscles Ligaments Tendons J, 5 (2015) 58-62. [3] V. Juras, S. Apprich, P. Szomolanyi, O. Bieri, X. Deligianni, S. Trattnig, Bi-exponential T2 analysis of healthy and diseased Achilles tendons: an in vivo preliminary magnetic resonance study and correlation with clinical score, European radiology, 23 (2013) 2814-2822. [4] V. Juras, S. Zbyn, C. Pressl, L. Valkovic, P. Szomolanyi, I. Frollo, S. Trattnig, Regional variations of T(2)* in healthy and pathologic achilles tendon in vivo at 7 Tesla: preliminary results, Magnetic resonance in medicine : official journal of the Society of Magnetic Resonance in Medicine / Society of Magnetic Resonance in Medicine, 68 (2012) 1607-1613. [5] P.T. Gurney, B.A. Hargreaves, D.G. Nishimura, Design and analysis of a practical 3D cones trajectory, Magn Reson Med, 55 (2006) 575-582. [6] K.M. Khan, F. Bonar, P.M. Desmond, J.L. Cook, D.A. Young, P.J. Visentini, M.W. Fehrmann, Z.S. Kiss, P.A. O'Brien, P.R. Harcourt, R.J. Dowling, R.M. O'Sullivan, K.J. Crichton, B.M. Tress, J.D. Wark, Patellar tendinosis (jumper's knee): findings at histopathologic examination, US, and MR imaging. Victorian Institute of Sport Tendon Study Group, Radiology, 200 (1996) 821-827.Figures
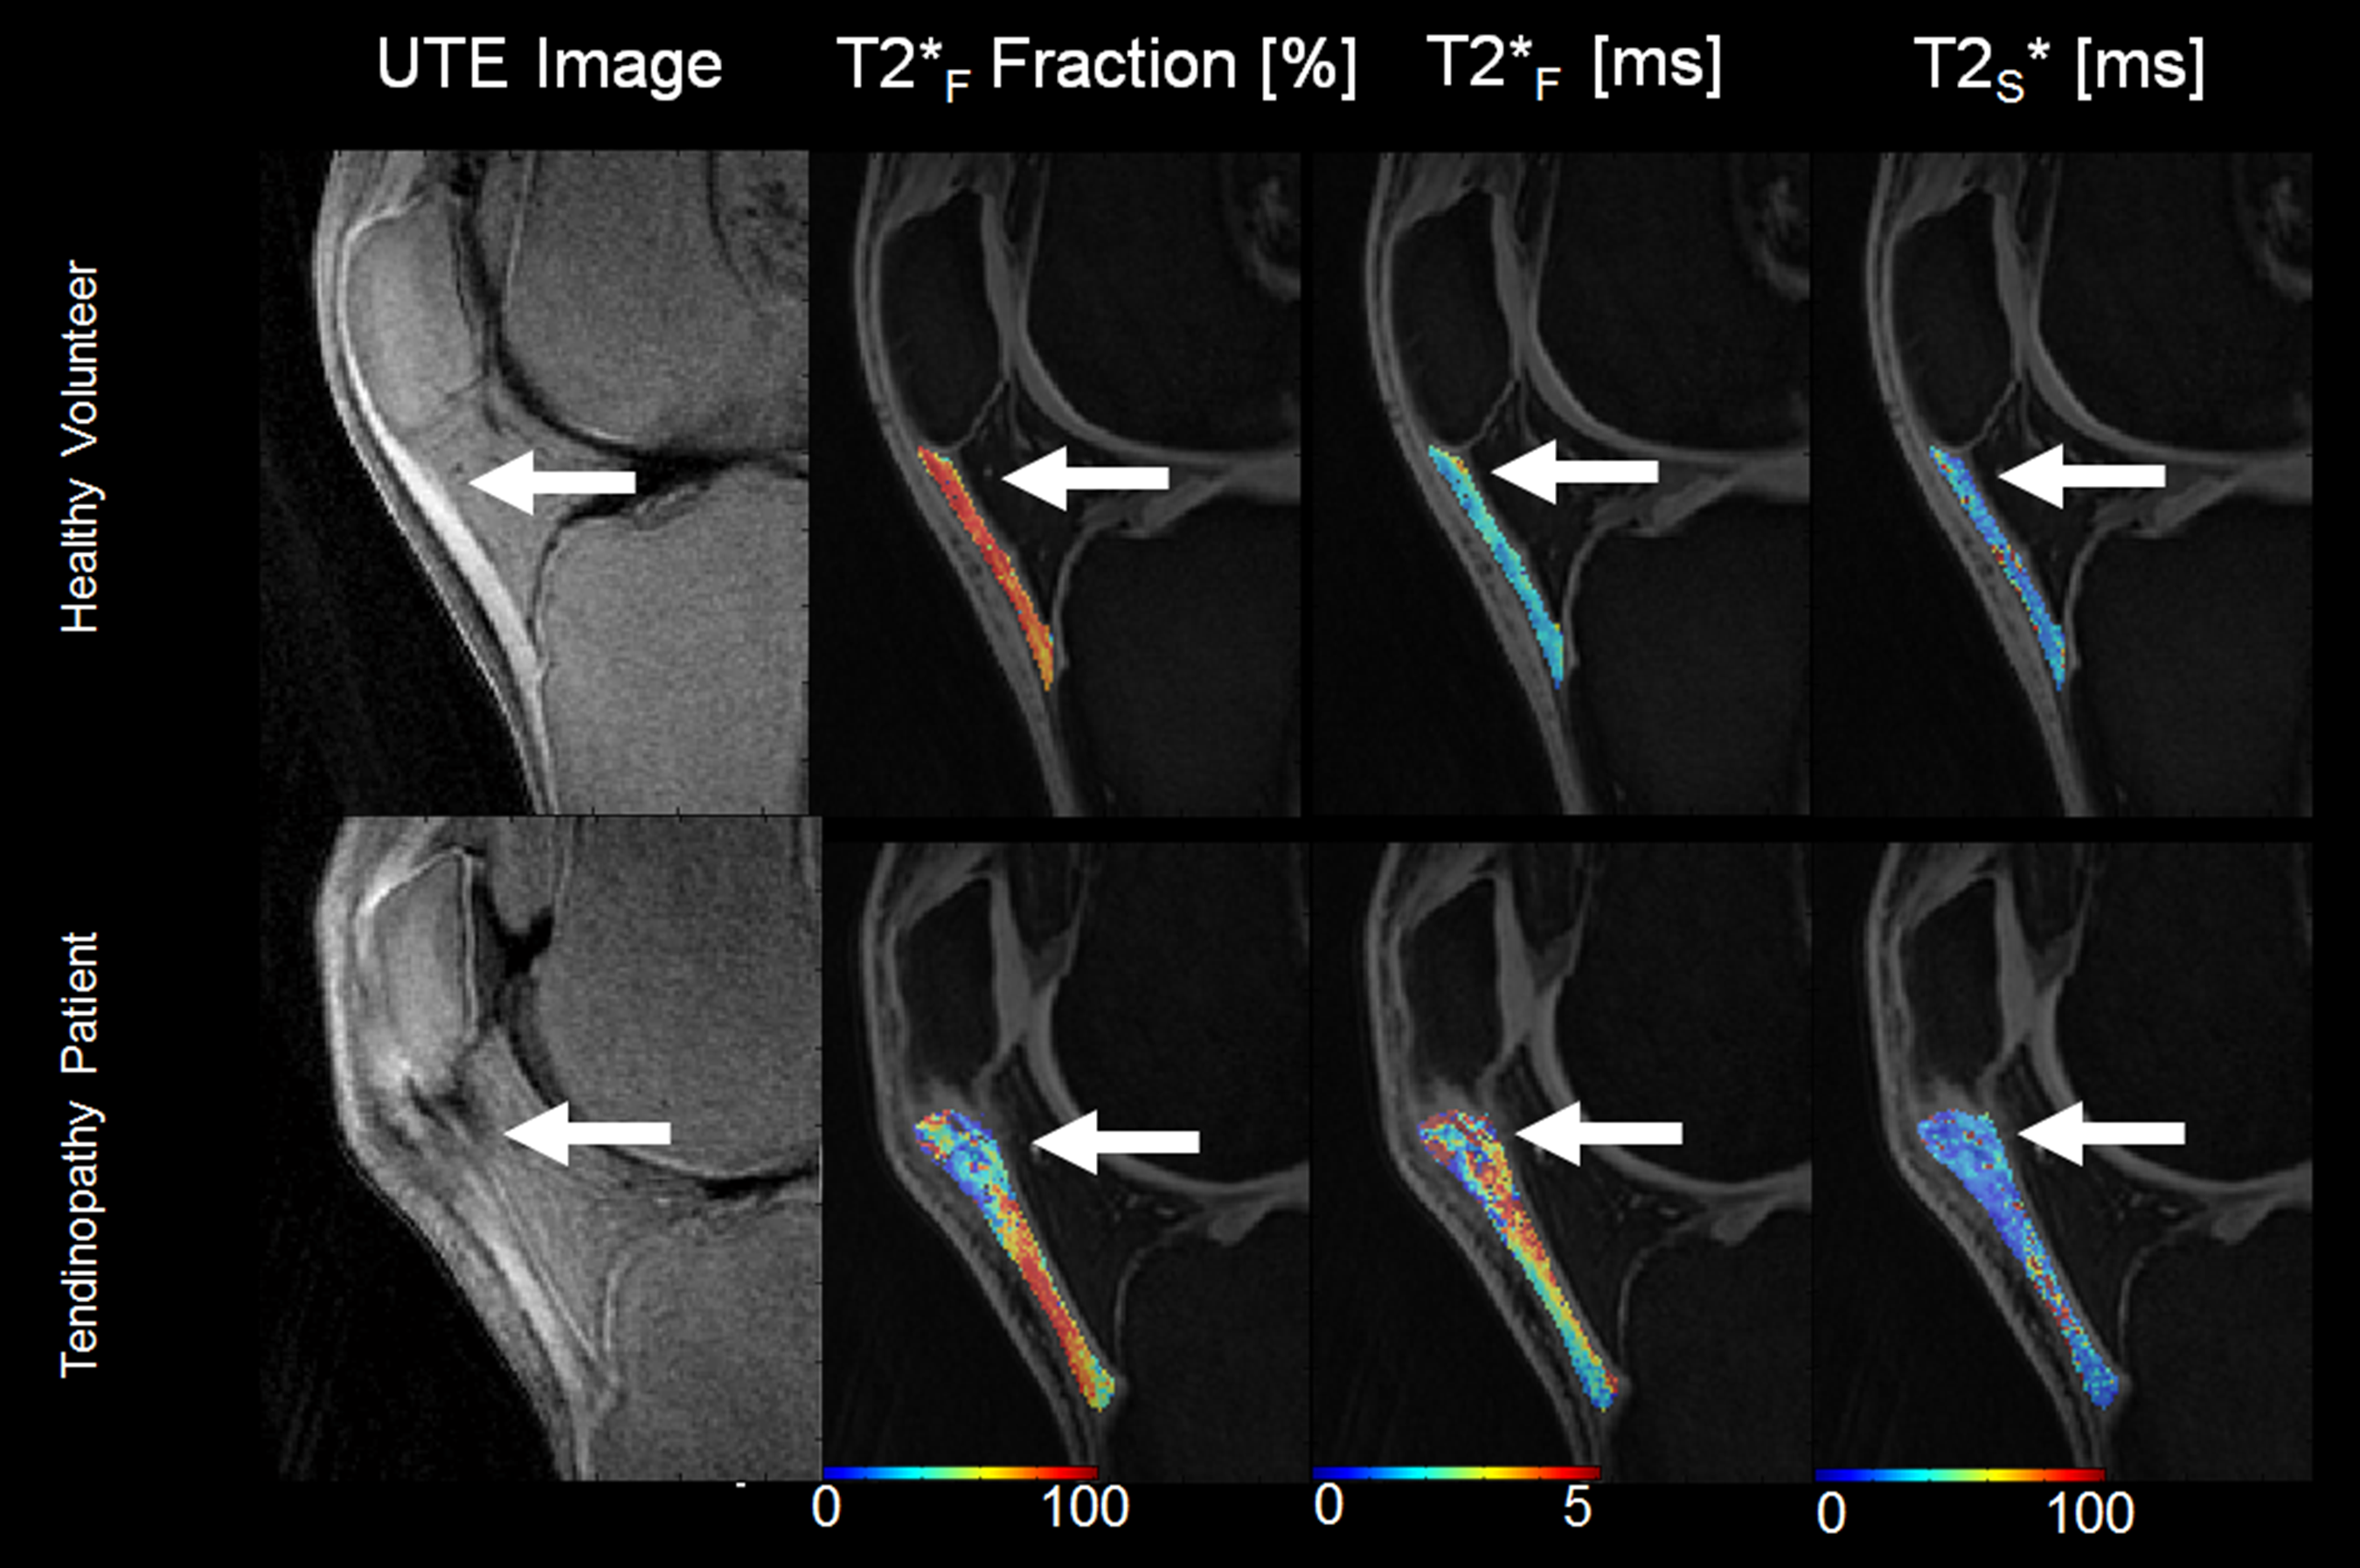
Figure 1:
Comparison of FF, T2*F, and T2*S maps
of the patellar tendon in a patients with patellar tendinopathy and a healthy
volunteer. Note the focal area of lower FF,
higher T2*F, and similar T2*S in the thickened
proximal patellar tendon in the patient with patellar tendinopathy (arrows).
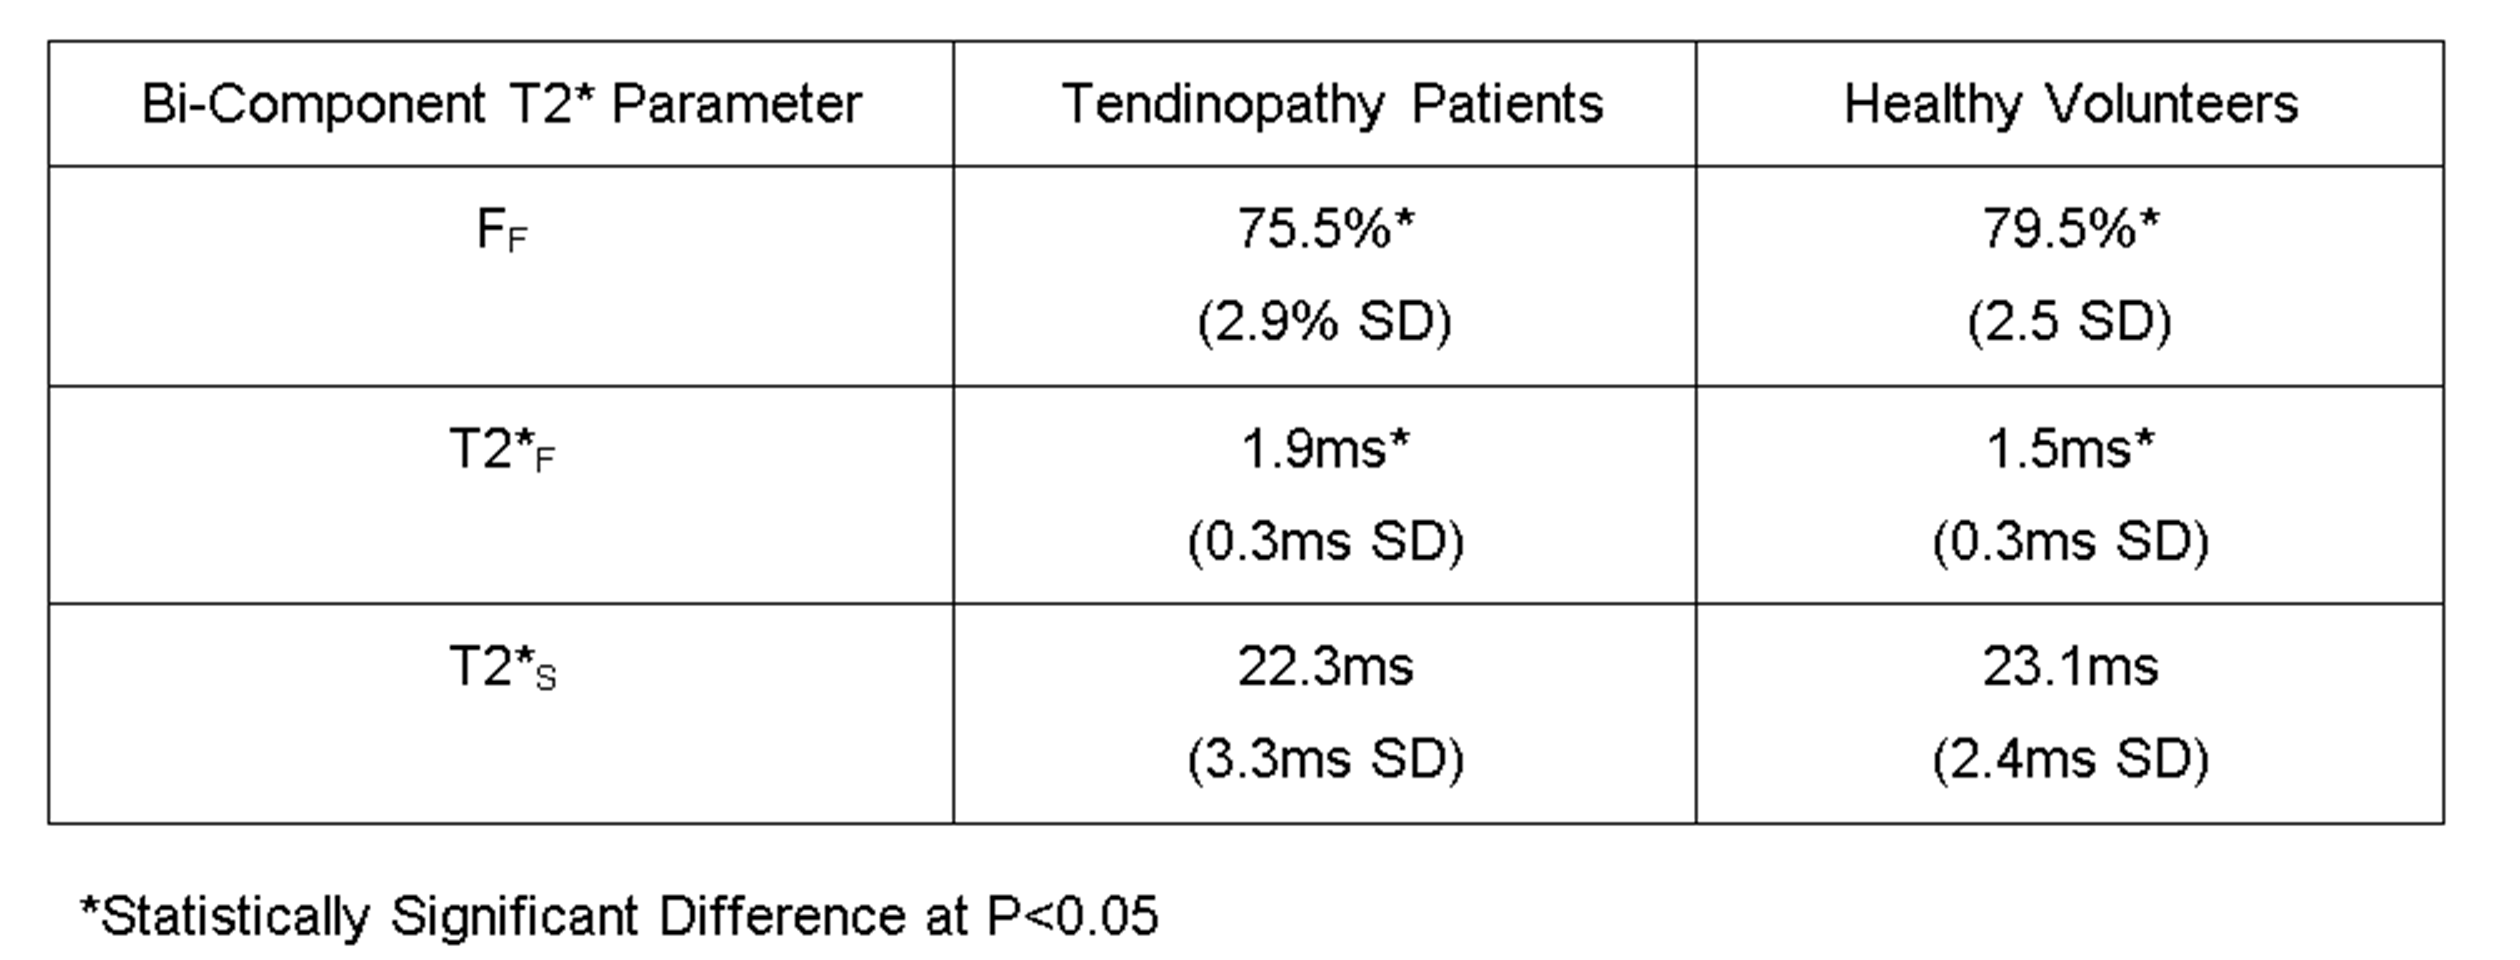
Figure 2:
Mean and standard deviation (SD)
of bi-component T2* parameters of the patellar tendon in patients with patellar
tendinopathy and healthy volunteers.
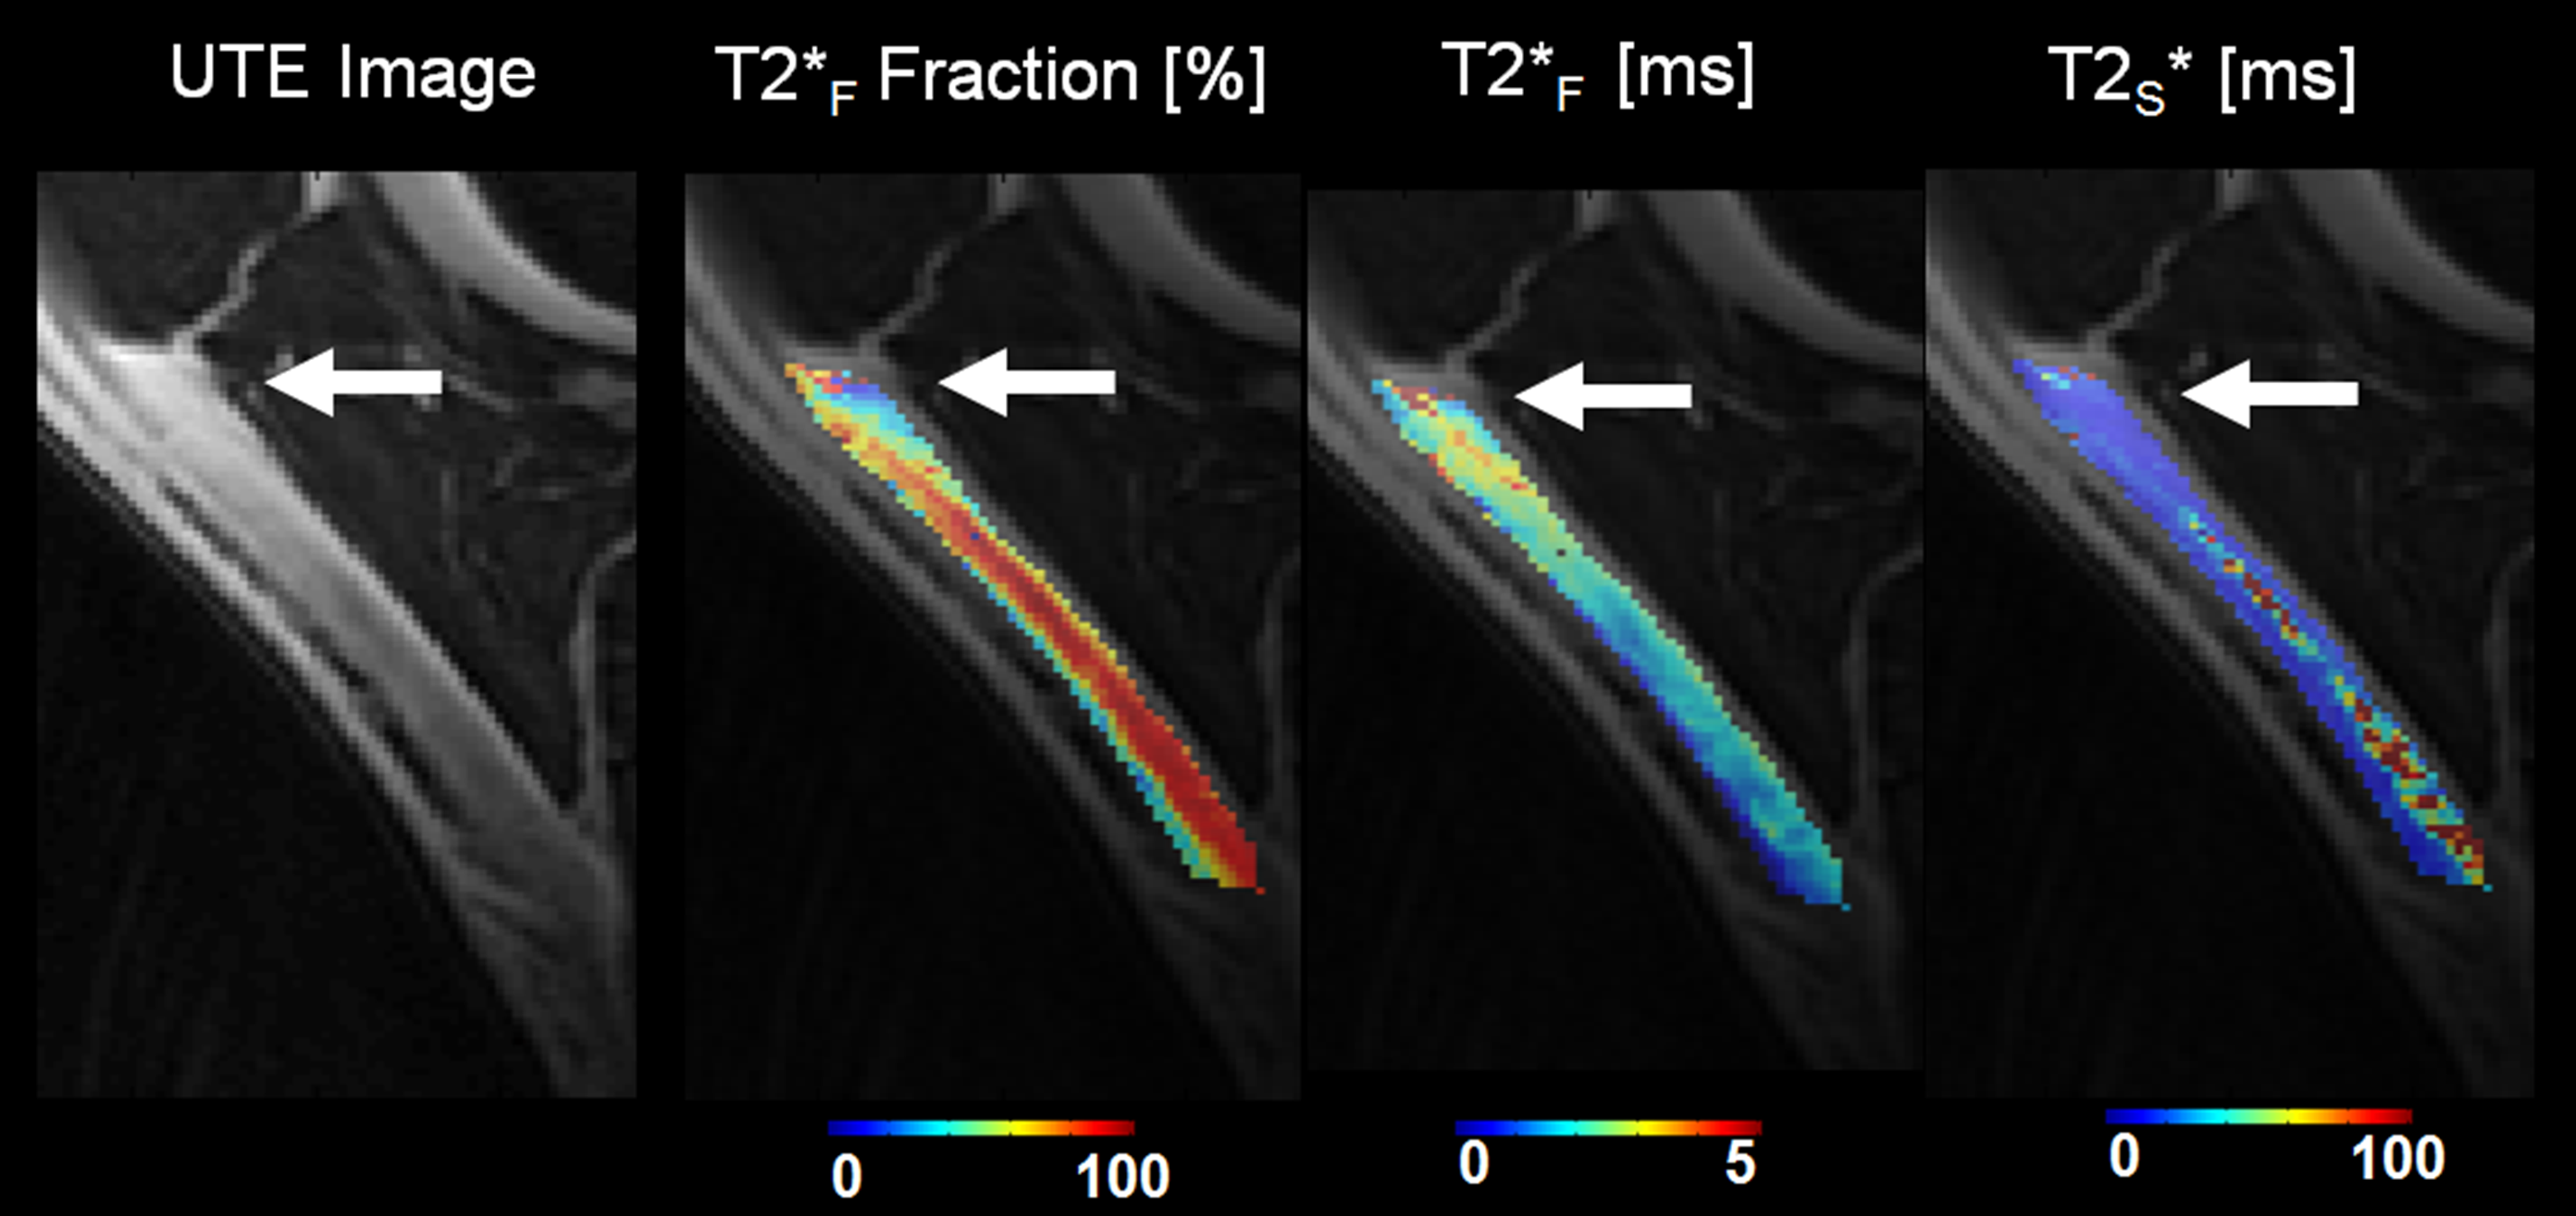
Figure 3:
FF, T2*F, and T2*S maps of the patellar
tendon in a patients with clinically diagnosed patellar tendinopathy who had no
corresponding changes in tendon morphology or signal intensity on
intermediate-weighted and T2-weighted images.
Note the focal area of lower FF and higher T2*F in
the non-thickened proximal patellar tendon (arrows).